Disability Services Census Report 2004
2004
Disability Services Census Report 2004 provides detailed information on Australian Government funded specialist disability services and their consumers.
Table of contents
1. Executive Summary
The Commonwealth State Territory Disability Agreement (CSTDA) provides the national framework for the provision of government services for people with a disability. To date, there have been three Agreements, and under each of these, the Australian Government has been responsible for specialist disability employment services. State and territory governments are responsible for accommodation support, community support, community access, and respite services. Responsibility for advocacy, information, and print disability services is shared between jurisdictions.
Under the CSTDA, funding for specialist disability employment services is provided by the Australian Government. The Australian Government funding provides access for people with a disability to vocational programs and employment, thereby promoting economic and social participation and choice for people with disabilities in work and the community. Together, the Australian Government and state/ territory governments, fund the remaining disability services.
The current CSTDA (through the National Minimum Data Set) requires Australian Government and state/territory governments to collect disability program, service and consumer data on an annual basis. The Australian Government fulfills its obligations by collecting data through its annual Census. This report details the findings from the 2003-04 Census collection.
The report provides national data on specialist services for people with disabilities funded under the CSTDA. Data are provided on people with a disability (consumers) who used specialist disability employment services during the 2003-04 financial year. In addition to the comprehensive information on disability employment services and their consumers, the report also provides information on other Australian Government funded disability services; respite, advocacy, information, and print disability. The purpose of this report is to provide detailed information on Australian Government funded specialist disability services and their consumers, to government agencies, disability ministers, policy makers, the disability sector, and the general public. The report could also provide the basis for research and policy development.
1.1 Summary of the Disability Services Census
This report has been written in five separate, yet interrelated chapters. The first chapter is the executive summary, which provides a brief outline of the layout and major findings of the current report. The second chapter provides a brief history of the Disability Services Census collection, while the third gives detailed information on disability service outlets and their staff; including the number of outlets and the services provided, as well as staff numbers, hours worked and other information. Chapter 3 also provides specific information on disability employment services.
The largest component of the report, Chapter 4, provides information on consumers of Australian Government funded disability employment services. Demographic data, including gender, age, Indigenous status, country of birth, main language spoken at home, and need for interpreter, are provided. The relationship between some of these data and service outlet type are detailed as well. Information about consumer's primary disability, need for assistance, residential setting, living arrangements and income are included. Employment characteristics make up the last section of this chapter.
Chapter 5 provides a breakdown of data across Australian jurisdictions. Information is provided for each jurisdiction, and covers service outlet and staff numbers, consumer demographics, and specific employment-related data. The report also includes a reference list, glossary of terms, and appendices. Please note that tables appearing in the Appendices are labelled with an A (e.g., Table 1A).
1.2 Major Findings
There were 908 Australian Government funded disability service outlets operational during 2003-04, and 760 of these were disability employment services. In the previous financial year, there were a total of 932 outlets. The lower number of outlets is primarily due to the amalgamation of some disability employment service outlets.
Staff in Australian Government funded disability services in 2003-04 worked a total of 257,267 hours per week. This is a decrease of 1,477 hours from the 258,744 hours reported in 2002-03. With regard to full-time equivalent (FTE) hours, approximately 6,770 FTE staff worked in disability services nationally. This represents 39 fewer FTE staff across Australia in 2003-04 compared with 2002-03. However, when the proportion of hours is calculated across employment service type and direct or indirect service provision, there is very little difference across the 2002-03 and 2003-04 financial years. It is therefore likely that service amalgamations have meant that outlets can provide quality services with slightly fewer staff.
In total, there were 68,873 consumers assisted by Australian Government funded disability employment services in 2003-04, which is an increase on the 68,137 reported in 2002-03. Of these, 44,429 were male and 24,444 were female, and most consumers spoke English as their main language. Across the three employment service types, 45,717 consumers accessed open employment services, 19,690 accessed supported employment services, and 3,466 accessed dual open/ supported employment services.
Although fewer disability employment service outlets were operational in 2003-04 than in 2002-03 (2.6% decrease), the total hours worked by staff decreased slightly during this period (0.6%). Further, the number of disability employment service consumers increased by around one per cent. Over the last few years, while the number of operational outlets has declined, the number of consumers accessing these services has increased. The most likely explanation is that a number of services have amalgamated and in this way were able to more efficiently assist consumers.
Most other data are similar across the 2002-03 and 2003-04 financial years. For example, the proportion of consumers born overseas and those whose main language is not English have remained stable over time. Similarly, the proportion of Indigenous consumers has remained steady, as has the income earned by working employment service consumers.
2. History of the Disability Services Census
The Australian Government Disability Services Census was developed to provide comprehensive information on Australian Government funded specialist disability employment services and their consumers.
In March 1991, a survey was conducted to assess all Australian Government funded disability services. This survey was conducted by AGB Australia and funded through the then Department of Health, Housing and Community Services (DHHCS). The final report summarised data collected on disability employment services between January and June 1991 (DHHCS, 1991).
A decision at the April 1993 meeting of the Working Party to the Review of Funding Arrangements for the Disability Services Program instigated a review of the 1991 Census. As a result of this review, pilot testing was conducted in July 1993 to improve the Census collection. The resultant report was more comprehensive than its predecessor (Department of Human Services and Health [DHSH], 1994).
The 1995 report provided data for the period 1 October 1994 to 30 September 1995. This report signified the first instance of reporting on data other than those related to disability employment services. Specifically, data on print disability, advocacy, information, and disability employment services were included in the 1995 report (Department of Health and Family Services [DHFS], 1997).
While the 1997 report remained relatively unchanged compared to its immediate predecessor, it signified the first year that (i) the Department of Family and Community Services (FaCS) became responsible for the Census collection and report, and (ii) the report became an annual publication (Department of Family and Community Services [FaCS], 1998). Since that time, FaCS has continued to have responsibility for the collection and reporting of Census data.
In 1998, the Accessibility/Remoteness Index of Australia (ARIA) was included in the Census collection to provide updated information on service accessibility. For the 1998 report, data were collected for the period 20 October 1997 to 19 October 1998 (FaCS, 1999). There were no changes made to the 1999 Census collection, where data were collected for the period 25 May 1998 to 26 May 1999 (FaCS, 2000).
The 2000 report included two major data additions. Full financial year data was published for the first time, as was information on respite services (FaCS, 2002). These data have been reported in subsequent reports. Between 1995 and 2001, the report was titled Commonwealth Disability Services Census. In 2002, the title changed to reflect a name change from Commonwealth to Australian Government, and has since been referred to as the Australian Government Disability Services Census.
Very few amendments have been made to the Census since 1998. While the 2003 report provided some attempt at cross year comparison (FaCS, 2005), the current report presents more in-depth analysis than previous reports, attempting to provide more meaningful information to disability ministers, policy makers, researchers, the disability sector, and the general public.
3. Disability service outlets and staff profiles
This chapter provides information on all types of Australian Government funded disability services, as well as the distribution of these service types within each jurisdiction. Specific information is provided on specialist disability employment services, including the number and per cent of service outlets operational during the 2003-04 financial year. The final section provides data on disability employment service staff, including the hours they worked and their role in service provision.
3.1 Disability Service Outlet Profiles
3.1.1 Number of Disability Services
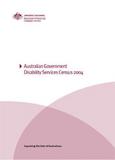
There were 908 Australian Government funded disability service outlets operational in 2003-04, which is 24 fewer (2.6% decrease) than the 932 outlets reported in 2002-03. The number of service outlets is lower because of amalgamations between some outlets in an attempt to better align service delivery for consumers with a disability.
Figure 3.1 shows the breakdown of service type across the 908 outlets. This Figure indicates that of all service outlets, the vast majority (760; 83.7%) were disability employment services, and there were only two (0.2%) information services. The breakdown of proportions across service type are comparable to those reported in 2002-03. For example, in 2002-03, 84.3 per cent of the 932 funded services were disability employment services, and 0.2 per cent were information services.
Information about disability service outlets across Australian jurisdictions is shown in Table 3.1. The number (and per cent) of employment, respite, print disability, advocacy, and information service outlets is given. The data are presented for each jurisdiction. For example, there were 11 disability employment service outlets in the Australian Capital Territory (ACT), which corresponds to 61.1 per cent of the 18 disability service outlets in the ACT.
Table 3.1 indicates that across all jurisdictions there were more disability employment service outlets than any other service type. Further, respite services made up almost one-quarter of disability services in the Northern Territory (NT), which is much higher than the proportion reported for other jurisdictions. Similarly, the ACT and NT had higher proportions of advocacy services than did other jurisdictions. Finally, the ACT and New South Wales (NSW) were the only jurisdictions to provide a disability information service (see Table 3.1 for more information). Overall, these data are similar to those reported in 2002-03.
|
Employment |
Respite |
Print |
Advocacy |
Information |
TOTAL |
|
|---|---|---|---|---|---|---|
| ACT | 11 | 1 | 1 | 4 | 1 | 18 |
| (61.1) | (5.6) | (5.6) | (22.2) | (5.6) | ||
| NSW | 271 | 17 | 4 | 17 | 1 | 30 |
| (87.4) | (5.5) | (1.3) | (5.5) | (0.3) | ||
| NT | 10 | 4 | 0 | 3 | 0 | 17 |
| (58.8) | (23.5) | (17.6) | ||||
| QLD | 123 | 13 | 1 | 8 | 0 | 145 |
| (84.4) | (9.0) | (0.7) | (5.5) | |||
| SA | 81 | 4 | 1 | 7 | 0 | 93 |
| (87.1) | (4.3) | (1.1) | (7.5) | |||
| TAS | 32 | 3 | 1 | 3 | 0 | 39 |
| (82.1) | (7.7) | (2.6) | (7.7) | |||
| VIC | 176 | 9 | 3 | 22 | 0 | 210 |
| (83.8) | (4.3) | (1.4) | (10.5) | |||
| WA | 56 | 9 | 2 | 9 | 0 | 76 |
| (73.7) | (11.8) | (2.6) | (11.8) | |||
| Total | 760 | 60 | 13 | 73 | 2 | 908 |
| (83.7) | (6.6) | (1.4) | (8.0) | (0.2) |
[ Return to Top Return to Section ]
3.1.2 Accessibility of Disability Services
The number (and per cent) of disability services classified across the five accessibility groupings is provided in Table 3.2. This Table shows that of the 73 advocacy services, 65 (89.0%) were in highly accessible areas, and very small numbers of services were located across the remaining four ARIA classifications. Further, both information services and all 13 print disability services were located in highly accessible areas. These findings are similar to those from 2002-03.
While most respite services were located in highly accessible (65.0%) or accessible (18.3%) areas, a sizeable minority of services were located in remote (5.0%) or very remote (8.3%) areas. Finally, the majority of disability employment services were located in highly accessible (71.3%) or accessible (19.0%) areas. However, there were a number of disability employment services located across the remaining three ARIA classifications. These data are similar to the 2002-03 data.
|
|
Highly Accessible |
Accessible |
Moderately Accessible |
Remote |
Very Remote |
TOTAL |
|---|---|---|---|---|---|---|
| Employment | 542 | 145 | 48 | 17 | 8 | 760 |
| (71.3) | (19.0) | (6.3) | (2.2) | (1.1) | ||
| Respite | 39 | 11 | 2 | 3 | 5 | 60 |
| (65.0) | (18.3) | (3.3) | (5.0) | (8.3) | ||
| Print Disability | 13 | 0 | 0 | 0 | 0 | 13 |
| (100) | ||||||
| Advocacy | 65 | 4 | 1 | 2 | 1 |
73 |
| (89.0) | (5.5) | (1.4) | (2.8) | (1.4) | ||
| Information | 2 | 0 | 0 | 0 | 0 | 2 |
| (100) | ||||||
| Total | 661 | 160 | 51 | 22 | 14 | 908 |
| (72.8) | (17.6) | (5.6) | (2.4) | (1.5) |
3.1.3 Number of Specialist Disability Employment Services
Specialist disability employment services are separated into three service types according to the nature of the services they provide. These types are:
- Open Employment Services - services that assist people with a disability to work in the open labour market. They can also assist people with a disability in transferring from special education or employment in a supported work setting, to paid employment in the open labour market;
- Supported Employment Services (or business services) - are those that directly provide support and employment to people with a disability; and
- Open/Supported Employment Services - services that provide both open and supported employment assistance to people with a disability.
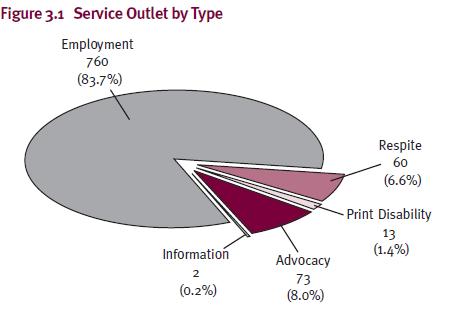
The proportions of consumers using open, supported, or dual open/supported employment services within each jurisdiction are shown in Figure 3.2. This Figure shows that open employment services were the most common type of employment assistance offered in all jurisdictions. However, the proportion of open employment services provided in South Australia (SA) was almost the same as the proportion of supported employment disability employment services provided by NSW, SA, and Queensland (QLD), only a small minority were dual open/supported services.
[ Return to Top Return to Section ]
3.1.4 Accessibility of Disability Employment Services
The number of open, supported, and dual open/supported employment services classified across the five accessibility areas is provided in Table 3.3. This Table shows that across each of the three employment service types, the majority of outlets were located in highly accessible areas. For example, 70.0 per cent (215/307) of open employment service outlets, and 72.3 per cent (306/423) of supported employment service outlets, were located in highly accessible areas. Of the 542 outlets located in highly accessible areas, 215 (39.7%) were open employment services, 306 (56.5%) were supported employment services, and 21 (3.9%) were dual open/supported employment services.
A significant proportion (19.1%; 145/760) of disability employment services were located in accessible areas for all employment service types as well (see Table 3.3). Finally, a small number of services were located across the remaining three ARIA classifications, with 25 (3.3%) outlets located in remote or very remote areas.
|
|
Highly Accessible |
Accessible |
Moderately Accessible |
Remote |
Very Remote |
TOTAL |
|---|---|---|---|---|---|---|
| Open | 215 | 55 | 22 | 10 | 5 | 307 |
| Supported | 306 | 85 | 25 | 6 | 1 | 423 |
| Open/Supported | 21 | 5 | 1 | 1 | 2 | 30 |
| Total | 542 | 145 | 48 | 17 | 8 | 760 |
3.1.5 Accessibility Across Employment Service Type and Consumer
The number (and per cent) of disability employment service consumers living within particular ARIA classifications of their employment service is shown in Table 3.4. This Table shows that the majority of consumers used services in areas that were similar to the area in which they were living. For example, the overwhelming majority of consumers living in a highly accessible area used services in highly accessible areas (54,868; 99.1%), those living in accessible areas tended to use services in accessible areas (7,950; 82.4%); and most consumers living in very remote areas used services in very remote areas (276; 71.5%). This means that very few people living in a remote area travel to use services in an accessible area. See Table 3.4 for more detailed information.
|
|
Highly Accessible |
Accessible |
Moderately Accessible |
Remote |
Very Remote |
TOTAL |
|---|---|---|---|---|---|---|
| Highly Accessible | 54,868 | 451 | 30 | 16 | 0 | 55,365 |
| (99.1) | (0.8) | (0.1) | (0.0) | |||
| Accessible | 1,249 | 7,950 | 449 | 5 | 0 | 9,653 |
| (12.9) | (82.4) | (4.7) | (0.1) | |||
| Moderately Accessible | 183 | 458 | 2,028 | 31 | 2 | 2,702 |
| (6.8) | (17.0) | (75.1) | (1.1) | (0.1) | ||
| Remote | 23 | 59 | 31 | 633 | 21 | 767 |
| (3.0) | (7.7) | (4.0) | (82.5) | (2.7) | ||
| Very Remote | 8 | 18 | 19 | 65 | 276 | 386 |
| (2.1) | (4.7) | (4.9) | (16.8) | (71.5) | ||
| Total | 56,331 | 8,936 | 2,557 | 750 | 299 | 68,873 |
[ Return to Top Return to Section ]
3.2 Staff Profile
Staff in all Australian Government funded disability services in 2003-04 worked a total of 257,267 hours per week. This is a decrease of 1,477 (0.6%) hours from the 258,744 hours reported in 2002-03. These weekly staff hours equated to approximately 6,770 FTE staff across Australia. This means there were 39 fewer FTE staff nationally in 2003-04 compared to 2002-03. However, when the proportion of hours is calculated across employment service type and direct or indirect service provision, there is very little difference across the 2002-03 and 2003-04 financial years. For example, in 2003-04, 69.8 per cent of open employment service staff hours were for direct service provision, and in 2002-03 this was 69.9 per cent. Similarly, for supported employment services, 67.0 per cent of staff hours were direct service provision in 2003-04, and 67.5 per cent in 2002-03. Given these data, it is likely that service amalgamations have meant that outlets can provide quality services with slightly fewer staff.
Across all service types, 172 (18.9%) had 0-2 FTE staff, 301 (33.1%) had 3-5 FTE staff, 271 (29.8%) had 6-10 FTE staff, and 164 (18.1%) had 11 or more full time staff. These numbers are similar to those reported in 2002-03.
Most staff hours were consumed by disability employment services, with 215,208 (5,663 FTE staff) hours being worked by these staff in 2003-04. Data on the remaining service types are provided in Table 1A. Further, more staff hours were reported across supported employment services (133,679 hours; 62.1%) than for either open or dual open/supported employment services. Refer to Table 2A for detailed data on staff hours across employment service types.
Table 3.5 provides the number (and per cent) of staff who worked in direct or indirect support roles. The Table shows that most staff worked in direct support roles, however, there were differences across all service types. For example, while all staff of information services worked in direct roles, only about two-thirds (68.3%) of those working in disability employment services worked directly with consumers. Therefore, over 30 per cent of disability employment service staff did not work directly with consumers, but worked indirectly through positions such as clerical work, training personnel, and belonging to boards/committees. These data are comparable to 2002-03. For more detailed information regarding direct and indirect staff hours please refer to Tables 1A and 2A.
|
Direct |
Indirect |
Total |
|
|---|---|---|---|
| Advocacy | 199 | 64 | 263 |
| (75.7) | (24.3) | ||
| Information | 172 | 0 | 172 |
| (100) | |||
| Print disability | 199 | 31 | 230 |
| (86.5) | (13.5) | ||
| Respite | 280 | 160 | 440 |
| (63.6) | (36.4) | ||
| Employment | 3,863 | 1,797 | 5,660 |
| (68.3) | (31.7) | ||
| Total | 4,713 | 2,052 | 6,765 |
| (69.7) | (30.3) |
4. Disability Employment Service Consumer Profile
- 4.1 Consumer Demographic Information
- 4.2 Consumers and Disability Employment Service Type
- 4.3 Primary Disability of Consumers Across Service Type
- 4.4 Need for Assistance
- 4.5 Residential Setting
- 4.6 Living Arrangement
- 4.7 Income
- 4.8 Employment Characteristics
Consumer profile data are collected and reported in two ways. The first provides data on all people who accessed disability employment services during the 2003-04 financial year. The second provides data only on people who were registered and receiving assistance from a disability employment service on 30 June 2004 - these data are referred to as consumers 'on the books'. This chapter provides details predominantly on the full financial year. Consumer on the books data are reported in sub-section 4.8 because full financial year data are not collected for items covered in that sub-section.
In total, 68,873 consumers accessed disability employment services in 2003-04. This is an increase on the 68,137 reported in 2002-03. Therefore, while the number of operational service outlets declined, the number of consumers using those services increased. The most likely explanation for this is that services amalgamated and in this way were able to more efficiently assist consumers.
Of the 68,873 consumers, 56,361 (81.8%) were on Block Grant Funding (BGF), and 12,512 (18.2%) were on Case Based Funding (CBF). Across employment service type, of the 45,717 open employment service consumers, 35,983 (78.7%) were on BGF and 9,734 (21.3%) were on CBF. Of the 19,690 supported employment service consumers, 17,737 (90.1%) were on BGF and 1,953 (9.9%) were on CBF. Finally, for the 3,466 dual open/supported employment service consumers, 2,641 (76.2%) were on BGF and 825 (23.8%) were on CBF.
4.1 Consumer Demographic Information
4.1.1 Gender
Of the 68,873 consumers who accessed disability employment services in 2003-04, 44,429 (64.5%) were male and 24,444 (35.5%) were female, which is similar to the gender breakdown reported in 2002-03.
4.1.2 Age
Table 4.1 provides a summary of consumers by age. This Table shows that a large number of consumers were aged between 20-24 years, and 30-49 years, and very few consumers were aged less than 16 years or greater than 65 years.
Closer inspection of Table 4.1 shows that there were differences in the use of employment service types across age. The use of open employment services decreased progressively with age. For example, of all disability employment services accessed by consumers under the age of 16 years, 94.3 per cent accessed open employment services, whereas this figure was 59.9 per cent for the 30-39 year aged group and only 35.1 per cent in the greater than 65 year age group.
The opposite relationship applied to supported employment services, where access to these services increased steadily with age. Of services used by consumers aged under 16 years, only 3.1 per cent were in supported employment services, 34.9 per cent in the 30-39 year age group, and 62.0 per cent in the greater than 65 year olds. While there was a small increase in the use of open employment services and a small decrease in the use of supported employment services for young consumers from 2002-03, the trends do not differ significantly to those reported last financial year.
|
|
<16 |
16-19 |
20-24 |
25-29 |
30-39 |
40-49 |
50-59 |
60-64 |
>65 |
TOTAL |
|---|---|---|---|---|---|---|---|---|---|---|
| Open | 216 | 6,413 | 9,325 | 6,311 | 9,873 | 8,041 | 4,705 | 725 | 108 | 45,717 |
| % | (94.3) | (76.4) | (85.2) | (69.6) | (59.9) | (57.6) | (60.0) | (58.4) | (35.1) | (66.4) |
| Supported | 7 | 775 | 2,168 | 2,257 | 5,743 | 5,280 | 2,800 | 469 | 191 | 19,690 |
| % | (3.1) | (10.3) | (17.8) | (24.9) | (34.9) | (37.8) | (35.7) | (37.8) | (62.0) | (28.6) |
| Dual | 6 | 343 | 718 | 500 | 861 | 649 | 333 | 47 | 9 | 3,466 |
| % | (2.6) | (4.6) | (5.9) | (5.5) | (5.2) | (4.6) | (4.2) | (3.8) | (2.9) | (5.0) |
| Total | 229 | 7,531 | 12,211 | 9,068 | 16,477 | 13,970 | 7,838 | 1,241 | 308 | 68,873 |
[ Return to Top Return to Section ]
4.1.3 Relationship Between Gender and Age
Table 4.2, which provides information on the number (and per cent) of males and females using disability employment services across the various age groups, shows that across all age ranges, males were significantly more likely than females to have accessed disability employment services. This gender discrepancy was most noticeable in the greater than 65 year age group (80.5% males), and was also considerable in the less than 16 years and 60-64 year age groups (75.5% and 72.7% males, respectively).
|
<16 |
16-19 |
20-24 |
25-29 |
30-39 |
40-49 |
50-59 |
60-64 |
65 |
TOTAL |
|
|---|---|---|---|---|---|---|---|---|---|---|
| Males | 173 | 5,130 | 7,884 | 5,823 | 10,738 | 8,604 | 4,927 | 902 | 248 | 44,429 |
| % | (75.5) | (68.1) | (64.6) | (64.2) | (65.2) | (61.6) | (62.9) | (72.7) | (80.5) | (64.5) |
| Females | 56 | 2,401 | 4,327 | 3,245 | 5,739 | 5,366 | 2,911 | 339 | 60 | 24,444 |
| % | (24.5) | (31.9) | (35.4) | (35.8) | (34.8) | (38.4) | (37.1) | (27.3) | (19.5) | (35.5) |
| Total | 229 | 7,531 | 12,211 | 9,068 | 16,477 | 13,970 | 7,838 | 1,241 | 308 | 68,873 |
[ Return to Top Return to Section ]
4.1.4 Indigenous Status
Of the 68,873 disability employment consumers, 1,280 (1.9%) identified as being of Aboriginal origin, 82 (0.1%) of Torres Strait Islander descent, and 184 (0.3%) of Aboriginal and Torres Strait Islander origin. See Table 3A for more information about the Indigenous Origin of consumers.
4.1.5 Country of Birth
The majority of consumers in 2003-04 were born in Australia (60,743; 88.2%), 1,814 (2.6%) were born in Other- English speaking countries, and 5,011 (7.3%) were born in Non- English speaking countries. Place of birth data was not available for 1,305 (1.9%) consumers. These figures are comparable to those reported in 2002-03. See Table 4A for more detailed information about country of birth.
4.1.6 Main Language Spoken
Table 4.3 provides information on the main language spoken at home by consumers. This Table shows that the majority of consumers in 2003-04 spoke English at home (93.8%). Italian was the most common language other than English spoken at home (330; 0.5%). See Table 5A for more detailed information about the main language spoken at home by consumers.
| Language |
Number |
Per cent |
|---|---|---|
| English | 64,592 | 93.8 |
| Italian | 330 | 0.5 |
| Vietnamese | 316 |
0.5 |
| Arabic/Lebanese | 296 | 0.4 |
| Greek | 203 | 0.3 |
| Chinese | 198 | 0.3 |
| Spanish | 127 | 0.2 |
| German | 23 | 0.0 |
| Other | 2,297 | 3.3 |
| Not known | 491 | 0.7 |
| TOTAL | 68,873 | 100.0 |
[ Return to Top Return to Section ]
4.1.7 Need for Interpreter
In 2003-04, interpreter services for a spoken language were required by 498 (0.7%) consumers, and a further 1,462 (2.1%) consumers required interpreter services for non-spoken communication. These proportions are very similar to those reported in 2002-03. See Table 6A for additional information on the need for interpreters by consumers.
4.2 Consumers and Disability Employment Service Type
Of the 68,873 disability employment service consumers in 2003-04, the majority were assisted by open employment services (45,717; 66.4%). Supported employment services assisted 19,690 (28.6%) consumers and dual open/ supported employment services assisted 3,466 (5.0%) consumers. See Table 7A for more detailed information.
On June 30 2004, there were 52,537 consumers on the books of disability employment services. Of these, 32,768 (62.4%) were in open employment services, 17,095 (32.5%) were in supported employment services, and 2,674 (5.1%) were in dual open/supported employment services. These percentages are similar to those reported on 30 June 2003 (62.5%, 32.1% and 5.4% respectively).
4.2.1 Gender and Service Use
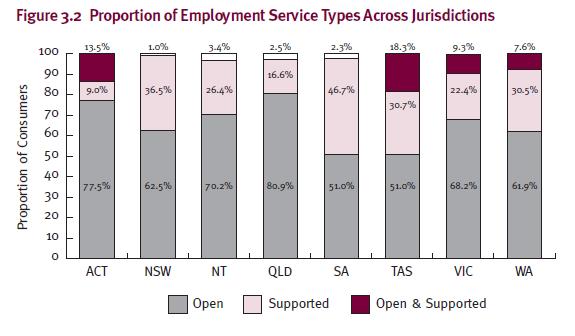
Figure 4.1 provides the per cent of male and female consumers across the three employment service types. This Figure shows that there were not significant gender differences in the proportion of men and women using the different service types. See Table 7A for further information.
4.2.2 Age and Service Use
There were differences in disability employment service type use by age (see Figure 4.2). The use of open employment services decreased progressively with age until the 30-39 year age group. For example, of all disability employment services accessed by consumers aged 16 to 19 years, 85.2 per cent had accessed open employment services, whereas the proportion decreased to 59.9 per cent for consumers aged 30-39 years. The proportion of consumers aged between 30-39 and 60-64 years who had accessed open employment services remained fairly steady, and then decreased markedly in the over 64 years age group. Refer to Figure 4.2 for relevant percentages.
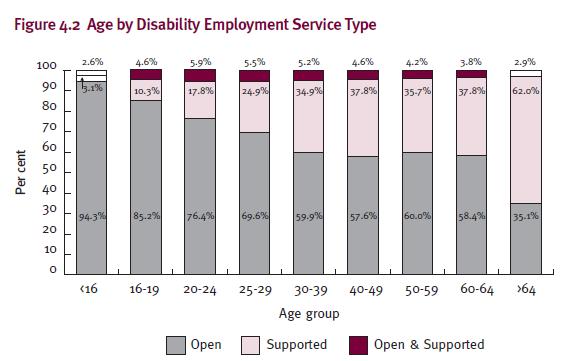
In contrast, older consumers tended to access supported employment services more often than did younger consumers. Of the disability employment services accessed by consumers aged 16-19 years, only 10.3 per cent were in supported employment services, whereas 62.0 per cent of services accessed by consumers aged over 64 years were supported employment services. The same pattern of stability across the 30-39 year age group through to the 60-64 year age group noted for open employment services was evident in supported employment services. These trends do not differ considerably to those reported for the 2002-03 financial year. Finally, Figure 4.2 shows that very low proportions across all ages accessed dual open/supported services.
[ Return to Top Return to Section ]
4.2.3 Jurisdictions and Service Use
There were differences in the pattern of disability employment service use across jurisdictions. Table 4.4 provides the number and per cent of consumers in 2003-04 by disability employment service type (open, supported, dual open/supported) and jurisdiction.
|
Open |
Supported |
Dual |
Total |
|
|---|---|---|---|---|
| ACT | 718 | 83 | 125 | 926 |
|
(77.5) |
(9.0) | (13.5) | ||
| NSW | 12,891 | 7,520 | 205 | 20,616 |
| (62.5) | (36.5) | (1.0) | ||
| NT | 314 | 118 | 15 | 447 |
| (70.2) | (26.4) | (3.4) | ||
| QLD | 10,192 | 2,093 | 321 | 12,606 |
| (80.9) | (16.6) | (2.5) | ||
| SA | 3,170 | 2,903 | 142 | 6,215 |
| (51.0) | (46.7) | (2.3) | ||
| TAS | 892 | 537 | 321 | 1,750 |
| (51.0) | (30.7) | (18.3) | ||
| VIC | 13,462 | 4,427 | 1,838 | 19,727 |
| (68.2) | (22.4) | (9.3) | ||
| WA | 4,078 | 2,009 | 499 | 6,586 |
| (61.9) | (30.5) | (7.6) | ||
| Total | 45,717 | 19,690 | 3,466 | 68,873 |
| (66.4) | (28.6) | (5.0) |
[ Return to Top Return to Section ]
Open Employment ServicesOpen employment services were the most commonly used service across all states and territories. QLD (80.9%) and ACT (77.5%) had the highest proportion of open employment service use, while SA and Tasmania (TAS) had the lowest (51%). Open employment services operate in the open labour market. Therefore, given that TAS and SA had the highest unemployment rates across the country in 2003-04 (6.9% and 6.4%, respectively; ABS, 2005), it makes sense that these states also had the lowest proportions of open employment service usage by people with a disability.
Except for NT, the proportion of open employment service use remained steady from 2002-03 to 2003-04; open employment service use was only 30.0 per cent in NT in 2002-03 and this jumped to 70.2 per cent in 2003-04. The reason for this increase is not clear.
Supported Employment ServicesThe proportion of consumers using supported employment services differed across jurisdictions (see Table 4.4). For example, 9.0 per cent of service use in ACT was with supported employment services, whereas, 46.7 per cent of SA's service use was with supported employment services. While both these proportions differ substantially from the national average (28.6%), they are comparable to the data reported in 2002-03.
The difference between supported employment service use in the ACT and SA may in part relate to different rates of severe/profound disability across jurisdictions. For example, according to the ABS (2005), the rate of severe/profound disability in ACT is 5.0 per cent and in SA it is 6.5 per cent.
Dual Open/Supported Employment ServicesThe use of dual open/supported employment services ranged from 1.0 per cent in NSW to 18.3 per cent in TAS, which is significantly different to the national average of 5.0 per cent (see Table 4.4). These data ranges are comparable to the 2002-03 data. However, NT showed a large decline in the proportion of dual open/supported service use between 2002-03 (46.3%) and 2003-04 (3.4%).
Overall, these data show that use of disability employment services differ significantly across jurisdictions (see Table 4.4 for more detail), and that service use in the NT has changed significantly over the past financial year.
[ Return to Top Return to Section ]
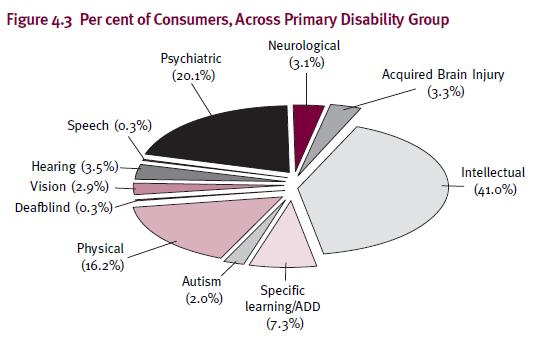
4.3 Primary Disability of Consumers Across Service Type
This section provides information about disability type reported for consumers of disability employment services during the 2003-04 financial year. Data are provided for all consumers (see Figure 4.3), and in separate tables for the three employment service types (see Tables 4.5 through 4.7).
Figure 4.3 provides information on the proportion of consumers of disability employment services by primary disability. This Figure shows that the most common primary disability reported for consumers was intellectual disability. The least common disabilities reported were speech and deaf/blind disabilities (see Figure 4.3).
4.3.1 Primary Disability Type for Open Employment Service Consumers
Table 4.5 provides the number and per cent of consumers of open employment services by primary disability. This Table shows that intellectual and psychiatric disabilities were the two most common primary disabilities reported among the 45,717 consumers of open employment services in 2003-04. Together, they constituted more than half of the open employment service consumer population (51.4%). Consumers with a physical disability made up the second largest group, while speech and deaf/blind disabilities were the least common primary disabilities among open employment service consumers (see Table 4.5).
| Primary Disability |
Number |
Per cent |
|---|---|---|
| Intellectual | 12,447 | 27.2 |
| Psychiatric | 11,077 | 24.2 |
| Physical | 9,250 | 20.2 |
| Specific Leaning/ADD | 4,551 | 10.0 |
| Hearing | 2,084 | 4.6 |
| Neurological | 1,719 | 3.8 |
| Vision | 1,657 | 3.6 |
| Acquired Brain Injury | 1,645 | 3.6 |
| Autism | 924 | 2.0 |
| Speech | 189 | 0.4 |
| Deaf/Blind | 174 | 0.4 |
| Total | 45,717 | 100.0 |
4.3.2 Primary Disability Type for Supported Employment Service Consumers
Information on primary disability for consumers of supported employment services is shown in Table 4.6. Of the 19,690 supported employment service consumers in 2003–04, 83.5 per cent had a primary intellectual or psychiatric disability. Physical disability was the next most common primary disability (6.3%). Finally, consumers of supported employment services were least likely to have a deaf/blind or speech disability as their primary disability (see Table 4.6).
| Primary Disability |
Number |
Per cent |
|---|---|---|
| Intellectual | 14,484 | 73.6 |
| Psychiatric | 1,959 | 9.9 |
| Physical | 1,250 | 6.3 |
| Acquired Brain Injury | 539 | 2.7 |
| Neurological | 329 | 1.7 |
| Autism | 310 | 1.6 |
| Vision | 286 | 1.5 |
| Specific Leaning/ADD | 228 | 1.2 |
| Hearing | 221 | 1.1 |
| Deaf/Blind | 56 | 0.3 |
| Speech | 28 | 0.1 |
| Total | 19,690 | 100.0 |
4.3.3 Primary Disability Type for Dual Open/Supported Employment Service Consumers
Table 4.7 shows that intellectual disability was the primary disability for 37.0 per cent of the 3,466 dual open/supported employment service consumers. Further, significant numbers of open/supported service consumers had a psychiatric or physical disability as their primary disability, and less than 20 consumers in total had a deaf/blind or speech disability as their primary disability (see Table 4.7).
| Primary Disability |
Number |
Per cent |
|---|---|---|
| Intellectual | 1,284 | 37.0 |
| Psychiatric | 780 | 22.5 |
| Physical | 644 | 18.6 |
| Specific Leaning/ADD | 251 | 7.2 |
| Autism | 172 | 5.0 |
| Neurological | 108 | 3.1 |
| Acquired Brain Injury | 94 | 2.7 |
| Hearing | 73 | 2.1 |
| Vision | 45 | 1.3 |
| Deaf/Blind | 8 | 0.2 |
| Speech | 7 | 0.2 |
| Total | 3,466 | 100.0 |
Overall, these data show that people with a physical disability used open employment services more often than supported employment services, and that people with an intellectual or psychiatric disability used open or supported services on a fairly even basis. Please refer to Table 8A for information on secondary disabilities across employment service type and primary disability group.
4.3.4 Comparison of Primary Disability Across Service Type
Intellectual disability was the most common primary disability across all employment service types. Psychiatric and physical disabilities were the next two most common primary disabilities. However, the proportion of consumers across these three disability groups differed across service types. For example, almost three-quarters of consumers of supported services had an intellectual disability as their primary disability, whereas a much lower proportion of consumers had a psychiatric (9.9%) or physical (6.3%) disability as their primary disability.
For both open and dual open/supported employment services, the proportions of consumers with an intellectual, psychiatric or physical disability were more similar. For example, the most common primary disability among open employment service consumers was intellectual disability (27.2%), followed by psychiatric disability (24.2%) and physical disability (20.2%). Finally, comparison of the data shown in Tables 4.5, 4.6 and 4.7 indicate that the majority of consumers of open or dual open/supported employment services had a psychiatric or physical disability as their primary disability. These trends are similar to those reported in 2002-03.
4.4 Need for Assistance
Table 4.8 provides the number (and per cent) of consumers by areas and levels of assistance required. The Table shows that the majority of consumers using disability employment services in 2003-04 did not require any assistance with self-care (58.8%) or mobility (57.6%). Assistance however, in the areas of working, learning, and interpersonal interactions, was required for a significant number of consumers. Further details are provided in Table 9A.
|
No help and no aids (%) |
No help, but uses aids (%) |
Sometimes needs help (%) |
Always needs help (%) |
Not Known (%) |
|
|---|---|---|---|---|---|
| Self-care | 40,483 | 2,695 | 18,098 | 3,101 | 4,496 |
| (58.8) | (3.9) | (26.3) | (4.5) | (6.5) | |
| Mobility | 39,638 | 3,582 | 17,667 | 4,751 | 3,235 |
| (57.6) | (5.2) | (25.7) | (6.9) | (4.7) | |
| Communication | 29,064 | 2,324 | 29,361 | 5,342 | 2,782 |
| (42.2) | (3.4) | (42.6) | (7.8) | (4.0) | |
| Interpersonal | 18,514 | 1,968 | 37,196 | 7,024 | 4,171 |
| (26.9) | (2.9) | (54.0) | (10.2) | (6.1) | |
| Learning | 13,665 | 2,141 | 40,418 | 8,976 | 3,673 |
| (19.8) | (3.1) | (58.7) | (13.0) | (5.3) | |
| Education | 15,370 | 2,221 | 33,475 | 11,120 | 6,687 |
| (22.3) | (3.2) | (48.6) | (16.1) | (9.7) | |
| Community | 23,000 | 2,270 | 26,922 | 7,832 | 8,849 |
| (33.4) | (3.3) | (39.1) | (11.4) | (12.8) | |
| Domestic | 26,271 | 2,474 | 24,001 | 6,724 | 9,403 |
| (38.1) | (3.6) | (34.8) | (9.8) | (13.7) | |
| Working | 5,753 | 2,111 | 46,688 | 10,789 | 3,532 |
| (8.4) | (3.1) | (67.8) | (15.7) | (5.1) |
* Percentages include consumers with not known responses
[ Return to Top Return to Section ]
Tables 4.9 and 4.10 show the number (and per cent) of consumers of open and supported employment services, respectively, by primary disability and areas of assistance required. Information is provided only for consumers who were unable to do, or required constant help/supervision in at least one assistance area. For example, the first cell in Table 4.9 shows that of all open employment service consumers with an intellectual disability, 239 (1.9%) were unable to do, or required constant help/supervision with self-care. Note, consumers who did not require assistance or who required only minimal assistance/aids are not tabulated. The interested reader can find these details in Table 10A.
Comparisons across Tables 4.9 and 4.10 show that generally, consumers of open services required assistance in different areas and to different degrees than consumers of supported employment services. In total, consumers of supported employment services were three times more likely than consumers of open employment services to be unable to perform, or required constant assistance/aids, to perform various tasks.
For most disabilities (intellectual, autism, physical, deaf/blind, vision, speech, neurological, acquired brain injury), higher percentages of supported employment service consumers required assistance across all nine areas than did open employment service consumers. However, there were some areas where the percentage difference was greater. For example, supported employment service consumers with a physical disability were at least three times more likely than their open employment service counterparts to require assistance in all nine areas. However, they were 10 times more likely than open employment service consumers to need assistance with learning, education, community, and domestic tasks (see Tables 4.9 and 4.10).
There were some similarities across employment service type in terms of need for assistance for the remaining three disabilities (specific learning/Attention Deficit Disorder [ADD], hearing, psychiatric). Consumers with a specific learning/ADD disability who used supported employment services tended to require constant assistance with interpersonal, learning, education, community, domestic, and working, to a greater extent than did those who accessed open employment services. However, the proportions of consumers requiring assistance were similar across open and supported employment service consumers for the remaining assistance areas (self care, mobility, communication). Further, only a small proportion (0.9%) of both supported and open employment service consumers with a hearing disability required full assistance/aids with self-care. Finally, mobility assistance was similarly required for consumers with a psychiatric disability regardless of the employment service type used.
|
|
Intellectual |
Specific learning/ADD |
Autism |
Physica |
Deaf / Blind |
Vision |
Hearing |
Speech |
Psychiatric |
Neurological |
ABI* |
|---|---|---|---|---|---|---|---|---|---|---|---|
| Self-care | 239 | 41 | 32 | 347 | 3 | 15 | 18 | 6 | 217 | 48 | 62 |
| (1.9) | (0.9) | (3.5) | (3.8) | (1.7) | (0.9) | (0.9) | (3.2) | (2.0) | (2.8) | (3.8) | |
| Mobility | 734 | 71 | 46 | 403 | 7 | 77 | 24 | 6 | 214 | 77 | 63 |
| (5.9) | (1.6) | (5.0) | (4.4) | (4.0) | (4.6) | (1.2) | (3.2) | (1.9) | (4.5) | (3.8) | |
| Communication | 913 | 78 | 62 | 151 | 17 | 11 | 343 | 22 | 301 | 44 | 46 |
| (7.3) | (1.7) | (6.7) | (1.6) | (9.8) | (0.7) | (16.5) | (11.6) | (2.7) | (2.6) | (2.8) | |
| Interpersonal | 1,209 | 156 | 123 | 142 | 6 | 18 | 74 | 10 | 549 | 57 | 81 |
| (9.7) | (3.4) | (13.3) | (1.5) | (3.4) | (1.1) | (3.6) | (5.3) | (5.0) | (3.3) | (4.9) | |
| Learning | 1,857 | 427 | 106 | 226 | 3 | 30 | 95 | 10 | 458 | 87 | 165 |
| (14.9) | (6.8) | (11.5) | (2.4) | (1.7) | (1.8) | (4.6) | (5.3) | (4.1) | (5.1) | (10.0) | |
| Education | 2,241 | 311 | 104 | 260 | 9 | 34 | 130 | 10 | 443 | 101 | 162 |
| (18.0) | (8.6) | (11.3) | (2.8) | (5.2) | (2.1) | (6.2) | (5.3) | (4.0) | (5.9) | (9.8) | |
| Community | 1,331 | 392 | 93 | 153 | 3 | 22 | 39 | 5 | 347 | 54 | 101 |
| (10.7) | (2.7) | (10.1) | (1.7) | (1.7) | (1.3) | (1.9) | (2.6) | (3.1) | (3.1) | (6.1) | |
| Domestic | 980 | 124 | 66 | 399 | 6 | 33 | 28 | 5 | 276 | 64 | 95 |
| (7.9) | (2.0) | (7.1) | (4.3) | (3.4) | (2.0) | (1.3) | (2.6) | (2.5) | (3.7) | (5.8) | |
| Working | 1,740 | 92 | 120 | 468 | 22 | 54 | 97 | 12 | 1,039 | 123 | 209 |
| (14.0) |
(7.1) |
(13.0) | (5.1) | (12.6) | (3.3) | (4.7) | (6.3) | (9.4) | (7.2) | (12.7) |
* ABI = Acquired Brain Injury
[ Return to Top Return to Section ]
|
|
Intellectual |
Specific learning/ADD |
Autism |
Physica |
Deaf / Blind |
Vision |
Hearing |
Speech |
Psychiatric |
Neurological |
ABI* |
|---|---|---|---|---|---|---|---|---|---|---|---|
| Self-care | 1,490 | 2 | 37 | 252 | 12 | 13 | 2 | 2 | 81 | 22 | 52 |
| (10.3) | (0.9) | (11.9) | (20.2) | (21.4) | (4.5) | (0.9) | (7.1) | (4.1) | (6.7) | (9.6) | |
| Mobility | 2,173 | 5 | 80 | 317 | 16 | 39 | 14 | 4 | 49 | 38 | 85 |
| (15.0) | (2.2) | (25.8) | (25.4) | (28.6) | (13.6) | (6.3) | (14.3) | (2.5) | (11.6) | (15.8) | |
| Communication | 2,520 | 6 | 95 | 144 | 25 | 10 | 89 | 11 | 111 | 20 | 61 |
| (17.4) | (2.6) | (30.6) | (11.5) | (44.6) | (3.5) | (40.3) |
(39.3) |
(5.7) | (6.1) | (11.3) | |
| Interpersonal | 3,404 | 24 | 121 | 203 | 14 | 13 | 37 | 9 | 270 | 34 | 94 |
| (23.5) | (10.5) | (39.0) | (16.2) | (25.0) | (4.5) | (16.7) | (32.1) | (13.8) | (10.3) | (17.4) | |
| Learning | 4,193 | 33 | 110 | 285 | 21 | 17 | 42 | 4 | 253 | 51 | 128 |
| (28.9) | (14.5) | (35.5) | (22.8) | (37.5) | (5.9) | (19.0) | (14.3) | (12.9) | (15.5) | (23.7) | |
| Education | 5,493 | 51 | 132 | 358 | 25 | 33 | 65 | 8 | 281 | 70 | 149 |
| (37.9) | (22.4) | (42.6) | (28.6) | (44.6) | (11.5) | (29.4) | (28.6) | (14.3) | (21.3) | (27.6) | |
| Community | 4,320 | 25 | 128 | 277 | 23 | 17 | 31 | 8 | 192 | 52 | 115 |
| (29.8) | (11.0) | (41.3) | (22.2) | (41.1) | (5.9) | (14.0) | (28.6) | (9.8) | (15.8) | (21.3) | |
| Domestic | 3,466 | 12 | 103 | 376 | 16 | 24 | 25 | 6 | 174 | 60 | 117 |
|
(23.9) |
(5.3) | (33.2) | (30.1) | (28.6) | (8.4) | (11.3) | (21.4) | (8.9) | (18.2) | (21.7) | |
| Working | 4,484 | 35 | 130 | 434 | 20 | 36 | 59 | 8 | 469 | 77 | 159 |
| (31.0) | (15.4) | (41.9) | (34.7) | (35.7) | (12.6) | (26.7) | (28.6) | (23.9) | (23.4) | (29.5) |
* ABI = Acquired Brain Injury
[ Return to Top Return to Section ]
4.5 Residential Setting
Table 4.11 shows that most consumers lived in a private residence. Among the remaining 12.1 per cent, a significant minority of consumers lived in either a domestic scale supported residence or supported accommodation (see Table 4.11 for numbers). These trends are similar to those reported in 2002-03.
Number| Residential Setting |
Number |
Per cent |
|---|---|---|
| Private | 60,539 | 87.9 |
| Domestic Scale Supported | 3,094 | 4.5 |
| Supported Accommodation | 2,718 | 3.9 |
| Boarding House/Private Hotel | 703 | 1.0 |
| Psychiatric Community Care | 218 | 0.3 |
| Short Term/Transitional | 177 | 0.3 |
| Residential Aged Care | 167 |
0.2 |
| Independent Unit-Retirement Village | 85 | 0.1 |
| Other | 1,172 | 1.7 |
| Total | 68,873 | 100.0 |
[ Return to Top Return to Section ]
4.6 Living Arrangement
Table 4.12 provides information on consumers' living arrangements. Living arrangements were not known for 2,123 consumers and not collected for a further 395 consumers. Therefore, the percentages provided in Table 4.12 refer only to the 66,355 consumers who had their living arrangements reported. This Table indicates that the majority of consumers lived with family, and that others lived alone or shared accommodation.
| Living Arrangement |
Number |
Per cent |
|---|---|---|
| Lives with Family | 43,677 | 65.8 |
| Lives Alone | 12,548 | 18.9 |
| Lives with Others | 10,130 | 15.3 |
4.7 Income
This section provides data on consumers' main sources of income, as well as specific information on the number of consumers in receipt of Disability Support Pension (DSP), Newstart/Youth Allowance (NSA/YA) and Mobility Allowance (MA).
4.7.1 Main Source of Income
Main source of income was known for 64,425 consumers. Figure 4.4 shows the breakdown of the four major sources of income for these consumers, and the number (and per cent) of consumers with nil income. The DSP was the main source of income for most disability employment service consumers (41,019; 63.7%), followed by paid employment, with 12,011 (18.6%) consumers receiving this as their main source of income. NSA/YA was the main source of income for 6,886 (10.7%) consumers, 3,303 (5.1%) consumers received another form of main income, that included MA, compensation income, pensions/benefits other than DSP and NSA/ YA, and income such as superannuation and investments.
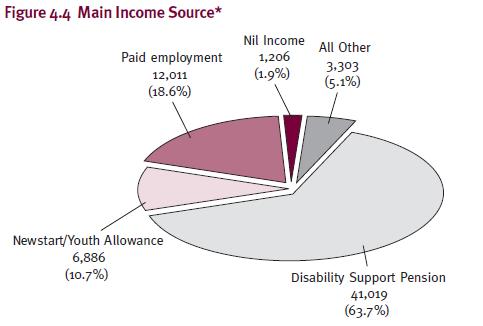
*Caution should be taken when comparing these data with those in earlier Census reports, as the percentages reported here exclude consumers (n=4,448) who did not have a known main source of income
4.7.2 Disability Support Pension (DSP)
In total, 47,154 consumers received the DSP, which means that 6,135 DSP recipients did not report this payment as their main source of income. The number of DSP recipients across employment service type is provided in Table 4.13. The Table also shows the number of DSP recipients who received MA in addition to DSP, and the number of consumers not on DSP.
|
Open |
Supported |
Dual |
|
|---|---|---|---|
| DSP | 25,638 | 19,012 | 2,504 |
|
1,983 | 6,670 | 409 |
| Not on DSP | 18,097 | 294 | 865 |
Table 4.13 shows that of the 47,154 employment service consumers on DSP, the majority (25,638; 54.4%) used open services. Of the 25,638 open service consumers on DSP, 1,983 (7.7%) were also in receipt of MA. There were 18,097 consumers of open services not receiving DSP. With regard to supported employment services, 19,012 consumers received DSP, and only 294 did not. Of those supported service consumers in receipt of DSP, 6,670 (35.1%) also received MA. Finally, there were 2,504 consumers of dual open/supported employment services on DSP. Of these, 409 (16.3%) were also in receipt of MA (see Table 4.13). Overall, these data show that while consumers of supported employment services are much more likely to be receiving DSP than not, the same pattern is not evident for open employment service consumers.
[ Return to Top Return to Section ]
4.7.3 Newstart (NSA)/Youth Allowance (YA)
There were 8,432 employment service consumers in receipt of NSA/YA, which means that 1,546 NSA/YA recipients did not report NSA/YA as their main source of income. The number of NSA/YA recipients across employment service type is provided in Table 4.14. The Table also shows the number of NSA/YA recipients who also received MA, and the number of consumers not receiving NSA/YA.
|
Open |
Supported |
Dual |
|
|---|---|---|---|
| NSA/YA | 7,864 | 125 | 443 |
|
39 | 2 | 0 |
| Not on NSA/YA | 35,404 | 17,996 | 2,677 |
Table 4.14 shows that of the 8,432 employment service consumers on NSA/YA, 7,864 used open services. Of these 7,864 consumers, 39 (0.5%) were also in receipt of MA. Further, there were 125 consumers of supported employment services on NSA/YA, and of these, 2 also received MA. Finally, there were 443 consumers of dual open/supported employment services on NSA/YA. None of these consumers received MA in addition to NSA/YA (see Table 4.14). Overall, these data show that the vast majority of employment service consumers did not receive NSA/YA.
[ Return to Top Return to Section ]
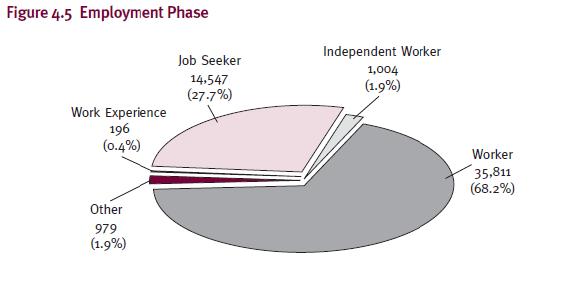
4.8 Employment Characteristics
Data on employment characteristics was collected for consumers who were working on the collection date, 30 June 2004. All data in this sub-section refer to 'on the books' consumers only.
There were 52,537 employment service consumers 'on the books' on 30 June 2004. Figure 4.5 provides information on the phase of employment for these consumers. Of 'on the books' consumers, 35,811 (68.2%) were recorded as being employed as workers, and a further 1,004 (1.9%) as independent workers. There were 14,547 (27.7%) 'on the books' consumers registered as job seekers, 196 (0.4%) undertaking work experience and 979 (1.9%) performing other employment activities, such as activity therapy, independent living training, and non-vocational or day care programs.
The number (and per cent) of employed consumers 'on the books' increased by 265 from 2002-03 to 2003-04. The per cent of job seekers declined across this time (29.5% in 2002-03; 27.7% in 2003-04), as did the per cent of consumers undertaking work experience (1.3% in 2002-03; 0.4% in 2003-04). However, the proportion of consumers undertaking other employment activities increased from 1.3 per cent (2002-03) to 1.9 per cent (2003-04).
4.8.1 Basis of Employment
Of the 36,815 workers and independent workers 'on the books' on 30 June 2004, the majority were employed on a permanent part-time basis. Basis of employment information was not reported for 23 consumers, so all data presented are reflective of the 36,792 employed consumers with known basis of employment information. Of these consumers, 15,700 (42.7%) worked less than 35 hours per week (i.e., permanent part-time). Further, 12,006 (32.6%) worked on a permanent full-time basis, and 5,721 (15.5%) worked as permanent casuals. The remaining 3,365 (9.1%) workers were employed in either seasonal or temporary positions.
Figure 4.6 shows the breakdown of basis of employment across service outlet type. The Figure indicates that for all service types, the majority of consumers were employed on a permanent part- time basis. For both open and supported services, permanent full-time employment was the next most common basis of employment, whereas, permanent casual employment was the second most common for employed consumers of dual open/supported services.
Of the 18,378 employed consumers of open services, 5,991 (32.6%) were employed on a permanent part- time basis, 4,764 (25.9%) on a permanent full-time basis, and 4,522 (24.6%) on a permanent casual basis. The remaining 3,101 (16.9%) employed open service consumers worked as either temporary employees or seasonal workers.
There were 16,694 employed consumers of supported services. Of these, 8,953 (53.6%) worked on a permanent part-time basis, 6,882 (41.2%) worked permanently full-time, and 785 (4.7%) on a permanent casual basis. The remaining 74 (0.4%) employed supported service consumers worked as temporary employees or seasonal workers.
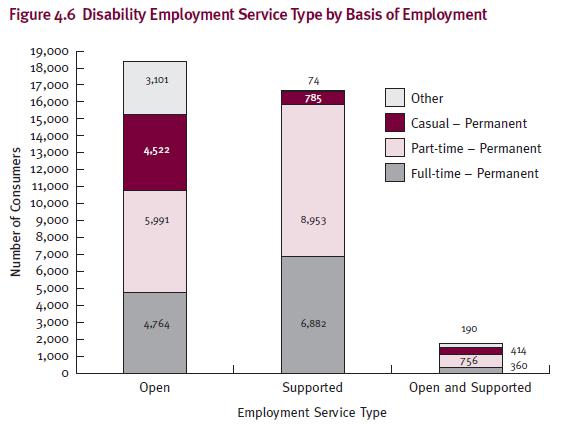
Of the 1,720 employed consumers of dual open/supported services, 756 (44.0%) worked permanently part-time, 414 (24.1%) worked on a permanent casual basis, and 360 (20.9%) worked permanently full-time. The remaining 190 (11.0%) employed dual open/supported service consumers worked as temporary employees or seasonal workers.
The proportion of open service consumers working permanently part-time on 30 June 2004 was comparable to that reported on 30 June 2003. There was however, a minimal increase in permanent part-time employment over this period for both supported and dual open/supported service consumers (i.e., less than 2.5%).
See Table 11A for more detailed information, and a breakdown of basis of employment across Australian jurisdictions. Finally, the proportions of consumers employed on a permanent full-time or casual basis did not differ substantially between 2002-03 and 2003-04 for any of the three employment service types.
[ Return to Top Return to Section ]
4.8.2 Hours of Employment
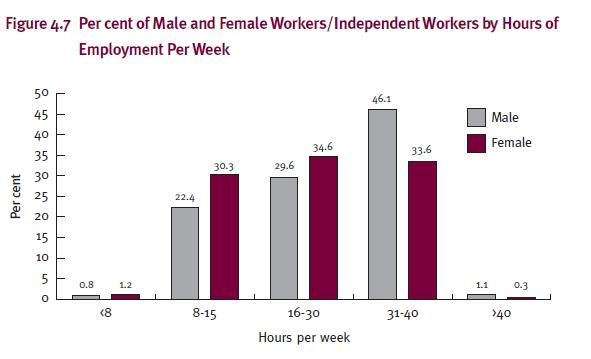
Data on hours of employment were not reported for 23 consumers, so all figures provided refer to the 36,792 employed consumers with known information. Of these consumers, 26,875 (73.0%) worked between 16 and 40 hours per week. A further 9,258 (25.2%) consumers worked between 8 and 15 hours per week. Very few consumers worked less than eight hours (355; 1.0%) or more than 40 hours per week (304; 0.8%). See Table 12A for more detailed information. These percentages are comparable to those reported in 2002-03.
Figure 4.7 provides information on the per cent of male and female workers/independent workers, across hours of employment per week. This Figure shows that males were more likely than females to work longer hours. For example, 46.1 per cent of males and 33.6 per cent of females worked between 31 and 40 hours. On the contrary, females were more likely than males to work: less than 8 hours; between 8 and 15 hours; and between 16 and 30 hours (see Figure 4.7 for percentages). These gender differences are expected given that on average, males are more likely than females to work full-time, and females are more likely than males to work part-time.
4.8.3 Wage Type
Table 4.15 provides details about the type of wage paid to workers/independent workers as at 30 June 2004. This information was not reported for 23 consumers, so the data presented in the Table are reflective of the 36,792 employed consumers with known wage type information. Almost one-third of employed consumers were a respondent to an award. A sizeable proportion of employed consumers were either paid wages not based on an award/agreement (20.5%) or were paid in accordance with a ratified enterprise/certified agreement (18.6%). A significant minority of employed consumers were paid in reference to an award or SWS productivity-based wage (see Table 4.15).
| Wage |
Number |
Per cent |
|---|---|---|
| Respondent to an Award | 10,213 | 27.8 |
| Wage Not Based on an Award/ Agreement | 7,542 | 20.5 |
| Ratified Enterprise/Certified Agreement | 6,856 | 18.6 |
| Australian Workplace Agreement | 5,815 | 15.8 |
| Payment is made in Reference to an Award | 3,488 | 9.5 |
| SWS Productivity-Based | 2,878 | 7.8 |
| Total | 36,792 | 100.0 |
[ Return to Top Return to Section ]
There were changes made to the item assessing wage type between the 2003 and 2004 census collections. For example, in 2003 the first response option was (Full) Award Wage and Conditions, whereas, this was amended to Respondent to an Award, in 2004. Further, in 2003 there was an option Other pro rata/productivity based wage under legal industrial agreement, but this was omitted in the 2004 collection. Therefore, given these differences, data from this report should not be compared to the data reported in the 2003 report.
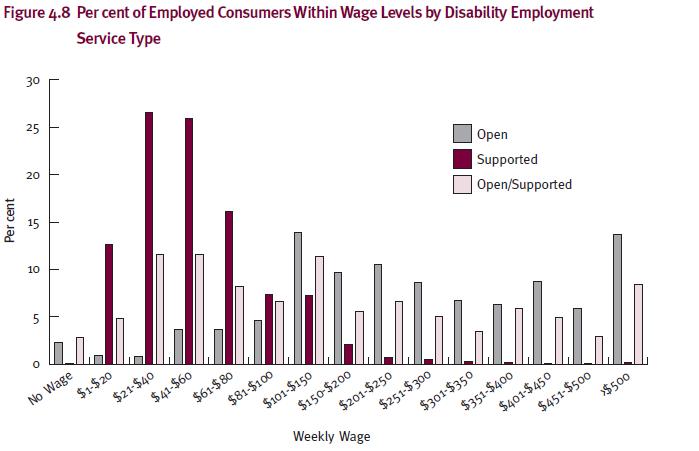
4.8.4 Wage Level
The wage level for employed consumers across employment service types are provided in Figure 4.8. This Figure shows that consumers of open services tended to earn higher wages on average, than did consumers assisted by either supported or dual open/supported services. More specifically, the majority of open supported service consumers earned $101- $150 or greater than $500, per week. Whereas, most supported service consumers earned between $21 and $60 per week. This trend is consistent with that reported in 2002-03. See Table 13A for more detailed information.
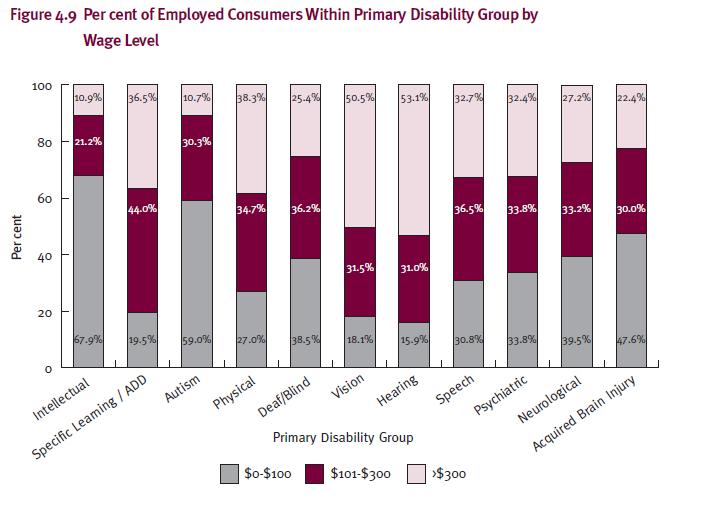
Wage level also differed across primary disability group, and this information is shown in Figure 4.9. The vast majority (67.9%) of employed consumers with a primary intellectual disability earned $100 or less per week, and very few (10.9%) earned more than $300 per week. This wage trend was similar for employed consumers with a primary disability of autism. On the contrary, over half of employed consumers with either a vision or a hearing primary disability earned more than $300 per week, and very few (vision 18.1%; hearing 15.9%) earned less than $100. Refer to Figure 4.9 for earning percentages of consumers with other primary disabilities.
5. Jurisdiction Specific Data
- 5.1 New South Wales
- 5.2 Victoria
- 5.3 Queensland
- 5.4 South Australia
- 5.5 Western Australia
- 5.6 Tasmania
- 5.7 Northern Territory
- 5.8 Australian Capital Territory
This section provides data for all jurisdictions, including information on service outlet and staff numbers, consumer demographics, and specific employment-related data.
5.1 New South Wales
Service Outlet and Staff Hours
310 (34.1%) of the 908 Australian Government funded disability service outlets were located in New South Wales (NSW). Of the service outlets in NSW:
- 87.4 per cent were employment services;
- 5.5 per cent were respite care services;
- 1.3 per cent were print disability services;
- 5.5 per cent were advocacy services; and
- 0.3 per cent were information services.
Across NSW employment services, staff worked a total of 68,246 hours, which equates to 31.7 per cent of national employment service staff hours.
Consumer Information
In NSW, there were 20,616 consumers of employment services in 2003-04. This represented 29.9 per cent of all consumers assisted in Australia during the period.
Of NSW consumers:
- 62.5 per cent used an open employment service;
- 36.5 per cent used a supported employment service;
- 1.0 per cent used a dual open/supported employment service;
- 91.5 per cent were born in Australia or other English speaking country; and
- 2.6 per cent were identified as being Indigenous.
Main Source of Income
The breakdown across main source of income for the 20,616 NSW employment service consumers was:
- 59.2 per cent received the DSP;
- 19.1 per cent received paid employment wages; and
- 9.5 per cent received Newstart/Youth Allowance.
Primary Disability
Of the 20,616 employment service consumers in NSW:
- 50.3 per cent had an intellectual disability;
- 18.4 per cent had a psychiatric disability;
- 12.0 per cent had a physical disability;
- 5.7 per cent had a sensory/speech disability;
- 8.4 per cent had a specific learning/ADD disability or autism; and
- 5.2 per cent had an acquired brain injury or neurological disability.
Employment Information
- 11,697 (73.7%) of the 15,876 consumers 'on the books' in NSW on 30 June 2004 were classified as employed (i.e., workers or independent workers).
- The most common wage range for employed consumers was $41-$60 per week, with 16.5 per cent of workers earning this.
- 20.9 per cent of consumers worked between 8 and 15 hours per week, 31.4 per cent worked 16 to 30 hours per week, and 46.3 per cent worked 31 to 40 hours per week.
[ Return to Top Return to Section ]
5.2 Victoria
Service Outlet and Staff Hours
210 (23.1%) of the 908 Australian Government funded disability service outlets were located in Victoria (VIC). Of the service outlets located in VIC:
- 83.8 per cent were employment services;
- 4.3 per cent were respite care services;
- 1.4 per cent were print disability services; and
- 10.5 per cent were advocacy services.
Across VIC employment services, staff worked a total of 45,818 hours, which equates to 21.3 per cent of national employment service staff hours.
Consumer Information
In VIC, there were 19,727 consumers of employment services in 2003-04. This represented 28.6 per cent of all consumers assisted in Australia during the period.
Of VIC consumers:
- 68.2 per cent used an open employment service;
- 22.4 per cent used a supported employment service;
- 9.3 per cent used a dual open/supported employment service;
- 86.3 per cent were born in Australia or other English speaking country; and
- 1.0 per cent were identified as being Indigenous.
Main Source of Income
With regard to main source of income for the 19,727 VIC employment service consumers:
- 54.1 per cent received the DSP;
- 16.2 per cent received paid employment wages; and
- 14.1 per cent received Newstart/Youth Allowance.
Primary Disability
Of the 19,727 employment service consumers in VIC:
- 28.8 per cent had an intellectual disability;
- 27.4 per cent had a psychiatric disability;
- 21.6 per cent had a physical disability;
- 7.5 per cent had a sensory/speech disability;
- 8.5 per cent had a specific learning/ADD disability or autism; and
- 6.3 per cent had an acquired brain injury or neurological disability.
Employment Information
- 9,333 (71.6%) of the 14,350 consumers 'on the books' in VIC on 30 June 2004 were classified as employed (i.e., workers or independent workers).
- The most common wage range for employed consumers was $41-$60 per week, with 13.2 per cent of workers earning this.
- 28.5 per cent of consumers worked between 8 and 15 hours per week, 30.3 per cent worked 16 to 30 hours per week, and 38.3 per cent worked 31 to 40 hours per week.
[ Return to Top Return to Section ]
5.3 Queensland
Service Outlet and Staff Hours
145 (16.0%) of the 908 Australian Government funded disability service outlets were located in Queensland (QLD). Of QLD service outlets:
- 84.8 per cent were employment services;
- 9.0 per cent were respite care services;
- 0.7 per cent were print disability services; and
- 5.5 per cent were advocacy services.
Across QLD employment services, staff worked a total of 32,140 hours, which equates to 14.9 per cent of national employment service staff hours.
Consumer Information
In QLD, there were 12,606 consumers of employment services in 2003-04. This represented 18.3 per cent of all consumers assisted in Australia during the period.
Of QLD consumers:
- 80.9 per cent used an open employment service;
- 16.6 per cent used a supported employment service;
- 2.5 per cent used a dual open/supported employment service;
- 94.4 per cent were born in Australia or other English speaking country; and
- 3.1 per cent were identified as being Indigenous.
Main Source of Income
With regard to main source of income for the 12,606 QLD employment service consumers:
- 60.3 per cent received the DSP;
- 17.8 per cent received paid employment wages; and
- 9.1 per cent received Newstart/Youth Allowance.
Primary Disability
Of the 12,606 employment service consumers in QLD:
- 38.2 per cent had an intellectual disability;
- 16.9 per cent had a psychiatric disability;
- 18.0 per cent had a physical disability;
- 8.1 per cent had a sensory/speech disability;
- 11.2 per cent had a specific learning/ADD disability or autism; and
- 7.5 per cent had an acquired brain injury or neurological disability.
Employment Information
- 6,136 (63.9%) of the 9,602 consumers 'on the books' in QLD on 30 June 2004 were classified as employed (i.e., workers or independent workers).
- The most common wage range for employed consumers was $21-$40 per week, with 13.4 per cent of workers earning this.
- 28.2 per cent of consumers worked between 8 and 15 hours per week, 31.3 per cent worked 16 to 30 hours per week, and 38.4 per cent worked 31 to 40 hours per week.
[ Return to Top Return to Section ]
5.4 South Australia
Service Outlet and Staff Hours
93 (10.2%) of the 908 Australian Government funded disability service outlets were located in South Australia (SA). Of these service outlets:
- 87.1 per cent were employment services;
- 4.3 per cent were respite care services;
- 1.1 per cent were print disability services; and
- 7.5 per cent were advocacy services.
Across SA employment services, staff worked a total of 27,538 hours, which equates to 12.8 per cent of national employment service staff hours.
Consumer Information
In SA, there were 6,215 consumers of employment services in 2003-04. This represented 9.0 per cent of all consumers assisted in Australia during the period.
Of these consumers:
- 51.0 per cent used an open employment service;
- 46.7 per cent used a supported employment service;
- 2.3 per cent used a dual open/supported employment service;
- 95.9 per cent were born in Australia or other English speaking country; and
- 1.5 per cent were identified as being Indigenous.
Main Source of Income
With regard to main source of income for the 6,215 SA employment service consumers:
- 70.4 per cent received the DSP;
- 14.6 per cent received paid employment wages; and
- 6.5 per cent received Newstart/Youth Allowance.
Primary Disability
Of the 6,215 employment service consumers in SA:
- 50.1 per cent had an intellectual disability;
- 13.8 per cent had a psychiatric disability;
- 12.2 per cent had a physical disability;
- 8.9 per cent had a sensory/speech disability;
- 8.2 per cent had a specific learning/ADD disability or autism; and
- 6.8 per cent had an acquired brain injury or neurological disability.
Employment Information
- 3,992 (71.6%) of the 5,069 consumers 'on the books' in SA on 30 June 2004 were classified as employed (i.e., workers or independent workers).
- The most common wage range for employed consumers was $21-$40 per week, with 20.3 per cent of workers earning this.
- 19.6 per cent of consumers worked between 8 and 15 hours per week, 31.6 per cent worked 16 to 30 hours per week, and 47.9 per cent worked 31 to 40 hours per week.
[ Return to Top Return to Section ]
5.5 Western Australia
Service Outlet and Staff Hours
76 (8.4%) of the 908 Australian Government funded disability service outlets were located in Western Australia (WA). Of these service outlets:
- 73.7 per cent were employment services;
- 11.8 per cent were respite care services;
- 2.6 per cent were print disability services; and
- 11.8 per cent were advocacy services.
Across WA employment services, staff worked a total of 28,527 hours, which equates to 13.3 per cent of national employment service staff hours.
Consumer Information
In WA, there were 6,586 consumers of employment services in 2003-04. This represented 9.6 per cent of all consumers assisted in Australia during the period.
Of these consumers:
- 61.9 per cent used an open employment service;
- 30.5 per cent used a supported employment service;
- 7.6 per cent used a dual open/supported employment service;
- 88.3 per cent were born in Australia or other English speaking country; and
- 2.6 per cent were identified as being Indigenous.
Main Source of Income
With regard to main source of income for the 6,586 WA employment service consumers:
- 63.0 per cent received the DSP;
- 18.6 per cent received paid employment wages; and
- 6.3 per cent received Newstart/Youth Allowance.
Primary Disability
Of the 6,586 employment service consumers in WA:
- 43.3 per cent had an intellectual disability;
- 16.7 per cent had a psychiatric disability;
- 14.0 per cent had a physical disability;
- 6.5 per cent had a sensory/speech disability;
- 11.5 per cent had a specific learning/ADD disability or autism; and
- 8.0 per cent had an acquired brain injury or neurological disability.
Employment Information
- 3,978 (76.3%) of the 5,215 consumers 'on the books' in WA on 30 June 2004 were classified as employed (i.e., workers or independent workers).
- The most common wage range for employed consumers was $21-$40 per week, with 16.4 per cent of workers earning this.
- 27.8 per cent of consumers worked between 8 and 15 hours per week, 32.8 per cent worked 16 to 30 hours per week, and 37.0 per cent worked 31 to 40 hours per week.
[ Return to Top Return to Section ]
5.6 Tasmania
Service Outlet and Staff Hours
39 (4.3%) per cent of the 908 Australian Government funded disability service outlets were located in Tasmania (TAS). Of these service outlets:
- 82.1 per cent were employment services;
- 7.7 per cent were respite care services;
- 2.6 per cent were print disability services; and
- 7.7 per cent were advocacy services.
Across TAS employment services, staff worked a total of 8,153 hours, which equates to 3.8 per cent of national employment service staff hours.
Consumer Information
In TAS, there were 1,750 consumers of employment services in 2003-04. This represented 2.5 per cent of all consumers assisted in Australia during the period.
Of these consumers:
- 51.0 per cent used an open employment service;
- 30.7 per cent used a supported employment service;
- 18.3 per cent used a dual open/supported employment service;
- 97.5 per cent were born in Australia or other English speaking country; and
- 3.9 per cent were identified as being Indigenous.
Main Source of Income
With regard to main source of income for the 1,750 TAS employment service consumers:
- 69.1 per cent received the DSP;
- 11.2 per cent received paid employment wages; and
- 9.1 per cent received Newstart/Youth Allowance.
Primary Disability
Of the 1,750 employment service consumers in TAS:
- 43.8 per cent had an intellectual disability;
- 14.5 per cent had a psychiatric disability;
- 18.2 per cent had a physical disability;
- 3.9 per cent had a sensory/speech disability;
- 12.1 per cent had a specific learning/ADD disability or autism; and
- 7.4 per cent had an acquired brain injury or neurological disability.
Employment Information
- 902 (68.2%) of the 1,322 consumers 'on the books' in TAS on 30 June 2004 were classified as employed (i.e., workers or independent workers).
- The most common wage range for employed consumers was $41-$60 per week, with 20.4 per cent of workers earning this.
- 26.9 per cent of consumers worked between 8 and 15 hours per week, 30.6 per cent worked 16 to 30 hours per week, and 41.6 per cent worked 31 to 40 hours per week.
5.7 Northern Territory
Service Outlet and Staff Hours
17 (1.9%) of the 908 Australian Government funded disability service outlets were located in Northern Territory (NT). Of these service outlets:
- 58.8 per cent were employment services;
- 23.5 per cent were respite care services; and
- 17.6 per cent were advocacy services.
Across NT employment services, staff worked a total of 1,963 hours, which equates to 0.9 per cent of national employment service staff hours.
Consumer Information
In NT, there were 447 consumers of employment services in 2003-04. This represented 0.6 per cent of all consumers assisted in Australia during the period.
Of these consumers:
- 70.2 per cent used an open employment service;
- 26.4 per cent used a supported employment service;
- 3.4 per cent used a dual open/supported employment service;
- 92.8 per cent were born in Australia or other English speaking country; and
- 19.5 per cent were identified as being Indigenous.
Main Source of Income
With regard to main source of income for the 447 NT employment service consumers:
- 52.8 per cent received the DSP;
- 21.9 per cent received paid employment wages; and
- 3.8 per cent received Newstart/Youth Allowance.
Primary Disability
Of the 447 employment service consumers in NT:
- 42.7 per cent had an intellectual disability;
- 20.1 per cent had a psychiatric disability;
- 9.4 per cent had a physical disability;
- 6.7 per cent had a sensory/speech disability;
- 12.5 per cent had a specific learning/ADD disability or autism; and
- 8.5 per cent had an acquired brain injury or neurological disability.
Employment Information
- 238 (64.2%) of the 371 consumers 'on the books' in NT on 30 June 2004 were classified as employed (i.e., workers or independent workers).
- The most common wage range for employed consumers was $101-$150 per week, with 12.6 per cent of workers earning this.
- 35.3 per cent of consumers worked between 8 and 15 hours per week, 30.7 per cent worked 16 to 30 hours per week, and 32.8 per cent worked 31 to 40 hours per week.
[ Return to Top Return to Section ]
5.8 Australian Capital Territory
Service Outlet and Staff Hours
18 (2.0%) of the 908 Australian Government funded disability service outlets were located in Australian Capital Territory (ACT). Of these service outlets:
- 61.1 per cent were employment services;
- 5.6 per cent were respite care services;
- 5.6 per cent were print disability services;
- 22.2 per cent were advocacy services; and
- 5.6 per cent were information services.
Across ACT employment services, staff worked a total of 2,823 hours, which equates to 1.3 per cent of national employment service staff hours.
Consumer Information
In ACT, there were 926 consumers of employment services in 2003-04. This represented 1.3 per cent of all consumers assisted in Australia during the period.
Of these consumers:
- 77.5 per cent used an open employment service;
- 9.0 per cent used a supported employment service;
- 13.5 per cent used a dual open/supported employment service;
- 93.0 per cent were born in Australia or other English speaking country; and
- 1.5 per cent were identified as being Indigenous.
Main Source of Income
With regard to main source of income for the 926 ACT employment service consumers:
- 61.1 per cent received the DSP;
- 23.9 per cent received paid employment wages; and
- 3.0 per cent received Newstart/Youth Allowance.
Primary Disability
Of the 926 employment service consumers in ACT:
- 45.7 per cent had an intellectual disability;
- 21.3 per cent had a psychiatric disability;
- 9.7 per cent had a physical disability;
- 7.7 per cent had a sensory/speech disability;
- 9.6 per cent had a specific learning/ADD disability or autism; and
- 6.0 per cent had an acquired brain injury or neurological disability.
Employment Information
- 539 (73.6%) of the 732 consumers 'on the books' in ACT on 30 June 2004 were classified as employed (i.e., workers or independent workers).
- The most common wage range for employed consumers was $101-$150 per week, with 17.8 per cent of workers earning this.
- 38.2 per cent of consumers worked between 8 and 15 hours per week, 36.9 per cent worked 16 to 30 hours per week, and 23.2 per cent worked 31 to 40 hours per week.
References
- Australian Bureau of Statistics (ABS) (2005). Australian economic indicators. Canberra, ACT: ABS.
- Australian Government Department of Family and Community Services (FaCS) (2005). Australian Government disability services census 2003. Canberra, ACT: Commonwealth of Australia.
- Australian Government Department of Family and Community Services (FaCS) (2004). Australian Government disability services census 2002. Canberra, ACT: Commonwealth of Australia.
- Commonwealth Department of Family and Community Services (FaCS) (2003). Commonwealth disability services census 2001. Canberra, ACT: Commonwealth of Australia.
- Commonwealth Department of Family and Community Services (FaCS) (2002). Disability services census 2000. Canberra, ACT: Commonwealth of Australia.
- Commonwealth Department of Family and Community Services (FaCS) (2000). Disability services census 1999. Canberra, ACT: Commonwealth of Australia.
- Commonwealth Department of Family and Community Services 1998 (FaCS) (1999). Disability services census 1998. Canberra, ACT: Commonwealth of Australia.
- Commonwealth Department of Family and Community Services (FaCS) (1998). Disability services census 1997. Canberra, ACT: Commonwealth of Australia.
- Commonwealth Department of Health and Family Services (DHFS) (1997). Disability services census report 1995. Canberra, ACT: Commonwealth of Australia.
- Commonwealth Department of Human Services and Health (DHSH) (1994). Service consumer profile report 1993. Canberra, ACT: Commonwealth of Australia.
- Department of Health, Housing and Community Services (DHHCS) (1991). 1991 Census of disability services North Sydney, NSW: AGB Research Australia.
Appendices
[ Return to Top Return to Section ]
Table 1A Disability Service Type by Jurisdiction and Type of Staff Hours
| Service Outlet Type | ||||||
|---|---|---|---|---|---|---|
| State/Territory |
Advocacy |
Information |
Print |
Respite |
Employment |
TOTAL |
| Direct | ||||||
| ACT | 141 | 100 | 25 | 130 | 1,943 | 2,339 |
| NSW | 2,116 | 6,425 | 1,320 | 1,802 | 47,083 | 58,746 |
| NT | 237 | 0 | 0 | 287 | 1,483 | 2,007 |
| QLD | 832 | 0 | 89 | 2,037 | 22,387 | 25,345 |
| SA | 1,159 | 0 | 153 | 2,212 | 17,788 | 21,312 |
| TAS | 348 | 0 | 0 | 456 | 4,798 | 5,602 |
| VIC | 1,506 | 0 | 5,868 | 2,866 | 33,099 | 43,339 |
| WA | 1,317 | 0 | 60 | 780 | 18,061 | 20,218 |
| Australia | 7,656 | 6,525 | 7,515 | 10,570 | 146,642 | 178,908 |
| Indirect | ||||||
| ACT | 110 | 0 | 13 | 0 | 880 | 1003 |
| NSW | 828 | 0 | 409 | 1923 | 21163 | 24323 |
| NT | 5 | 0 | 0 | 320 | 480 | 805 |
| QLD | 199 | 0 | 37 | 1310 | 9753 | 11299 |
| SA | 245 | 0 | 15 | 1318 | 9750 | 11328 |
| TAS | 107 | 0 | 230 | 254 | 3355 | 3946 |
| VIC | 765 | 0 | 40 | 651 | 12719 | 14175 |
| WA | 291 | 0 | 417 | 306 | 10466 | 11480 |
| Australia | 2,550 | 0 | 1,161 | 6,082 | 68,566 | 78,359 |
| Total | ||||||
| ACT | 251 | 100 | 38 | 130 | 2823 | 3,342 |
| NSW | 2944 | 6425 | 1729 | 3725 | 68246 | 83,069 |
| NT | 242 | 0 | 0 | 607 | 1963 | 2,812 |
| QLD | 1031 | 0 | 126 | 3347 | 32140 | 36,644 |
| SA | 1404 | 0 | 168 | 3530 | 27538 | 32,640 |
| TAS | 455 | 0 | 230 | 710 | 8153 | 9,548 |
| VIC | 2271 | 0 | 5908 | 3517 | 45818 | 57,514 |
| WA | 1608 | 0 | 477 | 1086 | 28527 | 31,698 |
| Australia | 10,206 | 6,525 | 8,676 | 16,652 | 215,208 | 257,267 |
[ Return to Top Return to Section ]
Table 2A
| Employment Service Outlet Type | ||||
|---|---|---|---|---|
| State/Territory |
Open |
Supported |
Open and Supported |
TOTAL |
| Direct | ||||
| ACT | 1,059 | 412 | 472 | 1,943 |
| NSW | 13,457 | 32,955 | 671 | 47,083 |
| NT | 440 | 901 | 142 | 1,483 |
| QLD | 11,318 | 9,973 | 1,096 | 22,387 |
| SA | 5,736 | 11,756 | 296 | 17,788 |
| TAS | 900 | 3,445 | 453 | 4,798 |
| VIC | 10,898 | 20,106 | 2,095 | 33,099 |
| WA | 6,329 | 9,999 | 1,733 | 18,061 |
| Australia | 50,137 | 89,547 | 6,958 | 146,642 |
| Indirect | ||||
| ACT | 594 | 129 | 157 | 880 |
| NSW | 5,446 | 15,487 | 230 | 21,163 |
| NT | 143 | 327 | 10 | 480 |
| QLD | 6,442 | 3,131 | 180 | 9,753 |
| SA | 1,694 | 7,953 | 103 | 9,750 |
| TAS | 598 | 2,560 | 197 | 3,355 |
| VIC | 3,775 | 7,704 | 1,240 | 12,719 |
| WA | 3,114 | 6,841 | 511 | 10,466 |
| Australia | 21,806 | 44,132 | 2,628 | 68,566 |
| Total | ||||
| ACT | 1,653 | 541 | 629 | 2,823 |
| NSW | 18,903 | 48,442 | 901 | 68,246 |
| NT | 583 | 1,228 | 152 | 1,963 |
| QLD | 17,760 | 13,104 | 1,276 | 32,140 |
| SA | 7,430 | 19,709 | 399 | 27,538 |
| TAS | 1,498 | 6,005 | 650 | 8,153 |
| VIC | 14,673 | 27,810 | 3,335 | 45,818 |
| WA | 9,443 | 16,840 | 2,244 | 28,527 |
| Australia | 71,943 | 133,679 | 9,586 | 215,208 |
[ Return to Top Return to Section ]
Table 3A
| Indigenous Origin | ||||||
|---|---|---|---|---|---|---|
| State/Territory |
Not Indigenous |
Aboriginal Origin |
Aboriginal and Torres Strait Islander Origin |
Torres Strait Islander Origin |
Not Known |
Total |
| Open Employment Service | ||||||
| ACT | 698 | 11 | 0 | 1 | 8 | 718 |
| NSW | 12,032 | 254 | 110 | 17 | 478 | 12,891 |
| NT | 268 | 44 | 0 | 0 | 2 | 314 |
| QLD | 9,398 | 271 | 14 | 43 | 466 | 10,192 |
| SA | 2,821 | 52 | 3 | 2 | 292 | 3,170 |
| TAS | 827 | 36 | 6 | 1 | 22 | 892 |
| VIC | 11,980 | 123 | 17 | 4 | 1,338 | 13,462 |
| WA | 3,824 | 114 | 9 | 1 | 130 | 4,078 |
| Australia | 41,848 | 905 | 159 | 69 | 2,736 | 45,717 |
| Supported Employment Service | ||||||
| ACT | 83 | 0 | 0 | 0 | 0 | 83 |
| NSW | 7,159 | 120 | 11 | 6 | 224 | 7,520 |
| NT | 90 | 28 | 0 | 0 | 0 | 118 |
| QLD | 2,020 | 49 | 8 | 5 | 11 | 2,093 |
| SA | 2,547 | 34 | 0 | 0 | 322 | 2,903 |
| TAS | 471 | 13 | 0 | 0 | 53 | 537 |
| VIC | 4,344 | 20 | 2 | 1 | 60 | 4,427 |
| WA | 1,943 | 40 | 0 | 0 | 26 | 2,009 |
| Australia | 18,657 | 304 | 21 | 12 | 696 | 19,690 |
| Open and Supported Employment Service | ||||||
| ACT | 123 | 2 | 0 | 0 | 0 | 125 |
| NSW | 177 | 9 | 1 | 0 | 18 | 205 |
| NT | 0 | 15 | 0 | 0 | 0 | 15 |
| QLD | 302 | 0 | 0 | 0 | 19 | 321 |
| SA | 140 | 2 | 0 | 0 | 0 | 142 |
| TAS | 255 | 13 | 0 | 0 | 53 | 321 |
| VIC | 1,583 | 21 | 3 | 1 | 230 | 1,838 |
| WA | 452 | 9 | 0 | 0 | 38 | 499 |
| Australia | 3,032 | 71 | 4 | 1 | 358 | 3,466 |
| Total | ||||||
| ACT | 904 | 13 | 0 | 1 | 8 | 926 |
| NSW | 19,368 | 383 | 122 | 23 | 720 | 20,616 |
| NT | 358 | 87 | 0 | 0 | 2 | 447 |
| QLD | 11,720 | 320 | 22 | 48 | 496 | 12,606 |
| SA | 5,508 | 88 | 3 | 2 | 614 | 6,215 |
| TAS | 1,553 | 62 | 6 | 1 | 128 | 1,750 |
| VIC | 17,907 | 164 | 22 | 6 | 1,628 | 19,727 |
| WA | 6,219 | 163 | 9 | 1 | 194 | 6,586 |
| Australia | 63,537 | 1,280 | 184 | 82 | 3,790 | 68,873 |
[ Return to Top Return to Section ]
Table 4A
| Country of Birth | |||||
|---|---|---|---|---|---|
| State/Territory |
Australia |
Other English Speaking |
Other Country |
Not Known |
Total |
| Open Employment Service | |||||
| ACT | 642 | 19 | 50 | 7 | 718 |
| NSW | 11,412 | 276 | 998 | 205 | 12,891 |
| NT | 274 | 17 | 19 | 4 | 314 |
| QLD | 9,182 | 369 | 529 | 112 | 10,192 |
| SA | 2,948 | 78 | 93 | 51 | 3,170 |
| TAS | 848 | 11 | 22 | 11 | 892 |
| VIC | 10,848 | 425 | 1,858 | 331 | 13,462 |
| WA | 3,399 | 152 | 368 | 159 | 4,078 |
| Australia | 39,553 | 1,347 | 3,937 | 880 | 45,717 |
| Supported Employment Service | |||||
| ACT | 82 | 0 | 1 | 0 | 83 |
| NSW | 6,839 | 139 | 412 | 130 | 7,520 |
| NT | 109 | 0 | 9 | 0 | 118 |
| QLD | 1,966 | 71 | 53 | 3 | 2,093 |
| SA | 2,726 | 77 | 82 | 18 | 2,903 |
| TAS | 536 | 0 | 1 | 0 | 537 |
| VIC | 4,078 | 44 | 150 | 155 | 4,427 |
| WA | 1,777 | 44 | 117 | 71 | 2,009 |
| Australia | 18,113 | 375 | 825 | 377 | 19,690 |
| Open and Supported Employment Service | |||||
| ACT | 117 | 1 | 7 | 0 | 125 |
| NSW | 195 | 3 | 7 | 0 | 205 |
| NT | 15 | 0 | 0 | 0 | 15 |
| QLD | 311 | 6 | 3 | 1 | 321 |
| SA | 119 | 10 | 13 | 0 | 142 |
| TAS | 312 | 0 | 8 | 1 | 321 |
| VIC | 1,591 | 47 | 172 | 28 | 1,838 |
| WA | 417 | 25 | 39 | 18 | 499 |
| Australia | 3,077 | 92 | 249 | 48 | 3,466 |
| Total | |||||
| ACT | 841 | 20 | 58 | 7 | 926 |
| NSW | 18,446 | 418 | 1,417 | 335 | 20,616 |
| NT | 398 | 17 | 28 | 4 | 447 |
| QLD | 11,459 | 446 | 585 | 116 | 12,606 |
| SA | 5,793 | 165 | 188 | 69 | 6,215 |
| TAS | 1,696 | 11 | 31 | 12 | 1,750 |
| VIC | 16,517 | 516 | 2,180 | 514 | 19,727 |
| WA | 5,593 | 221 | 524 | 248 | 6,586 |
| Australia | 60,743 | 1,814 | 5,011 | 1,305 | 68,873 |
[ Return to Top Return to Section ]
Table 5A
| Main Languages Spoken at Home | |||||||||||
|---|---|---|---|---|---|---|---|---|---|---|---|
| State/Territory |
English |
Italian |
Greek |
Vietnamese |
Chinese |
Arabic |
German |
Spanish |
Other Language |
Not Known |
Total |
| ACT | 882 | 7 | 2 | 3 | 1 | 0 | 1 | 1 | 25 | 4 | 926 |
| NSW | 19,075 | 99 | 87 | 92 | 93 | 219 | 7 | 61 | 751 | 132 | 20,616 |
| NT | 389 | 0 | 4 | 3 | 1 | 0 | 0 | 0 | 49 | 1 | 447 |
| QLD | 11,919 | 22 | 3 | 10 | 7 | 2 | 3 | 16 | 599 | 25 | 12,606 |
| SA | 6,012 | 36 | 23 | 8 | 8 | 0 | 0 | 3 | 88 | 35 | 6,215 |
| TAS | 1,714 | 0 | 2 | 0 | 0 | 1 | 1 | 0 | 31 | 1 | 1,750 |
| VIC | 18,304 | 133 | 79 | 187 | 62 | 70 | 10 | 37 | 586 | 259 | 19,727 |
| WA | 6,297 | 33 | 3 | 13 | 26 | 2 | 1 | 9 | 168 | 34 | 6,586 |
| Australia | 64,592 | 330 | 203 | 316 | 198 | 296 | 23 | 127 | 2,297 | 491 | 68,873 |
[ Return to Top Return to Section ]
Table 6A
| Interpreter Services Required | ||||
|---|---|---|---|---|
| State/Territory |
Spoken Language, |
Non-Spoken |
Not |
Total |
| Open Employment Service | ||||
| ACT | 2 | 19 | 697 | 718 |
| NSW | 78 | 111 | 12,702 | 12,891 |
| NT | 4 | 9 | 301 | 314 |
| QLD | 58 | 299 | 9,835 | 10,192 |
| SA | 11 | 50 | 3,109 | 3,170 |
| TAS | 2 | 13 | 877 | 892 |
| VIC | 159 | 213 | 13,090 | 13,462 |
| WA | 12 | 127 | 3,939 | 4,078 |
| Australia | 326 | 841 | 44,550 | 45,717 |
| Supported Employment Service | ||||
| ACT | 0 | 0 | 83 | 83 |
| NSW | 78 | 161 | 7,281 | 7,520 |
| NT | 13 | 4 | 101 | 118 |
| QLD | 6 | 93 | 1,994 | 2,093 |
| SA | 27 | 100 | 2,776 | 2,903 |
| TAS | 0 | 11 | 526 | 537 |
| VIC | 25 | 87 | 4,315 | 4,427 |
| WA | 6 | 101 | 1,902 | 2,009 |
| Australia | 155 | 557 | 18,978 | 19,690 |
| Open and Supported Employment Service | ||||
| ACT | 1 | 18 | 106 | 125 |
| NSW | 0 | 22 | 183 | 205 |
| NT | 2 | 0 | 13 | 15 |
| QLD | 0 | 4 | 317 | 321 |
| SA | 0 | 0 | 142 | 142 |
| TAS | 0 | 2 | 319 | 321 |
| VIC | 12 | 13 | 1,813 | 1,838 |
| WA | 2 | 5 | 492 | 499 |
| Australia | 17 | 64 | 3,385 | 3,466 |
| Total | ||||
| ACT | 3 | 37 | 886 | 926 |
| NSW | 156 | 294 | 20,166 | 20,606 |
| NT | 19 | 13 | 415 | 447 |
| QLD | 64 | 396 | 12,146 | 12,606 |
| SA | 38 | 150 | 6,027 | 6,215 |
| TAS | 2 | 26 | 1,722 | 1,750 |
| VIC | 196 | 313 | 19,218 | 19,727 |
| WA | 20 | 233 | 6,333 | 6,586 |
| Australia | 498 | 1,462 | 66,913 | 68,873 |
[ Return to Top Return to Section ]
Table 7A
| Employment Service Outlet Type | ||||
|---|---|---|---|---|
| State/Territory |
Open |
Supported |
Open and Supported |
Total |
| Male | ||||
| ACT | 441 | 38 | 80 | 559 |
| NSW | 8,326 | 4,825 | 138 | 13,289 |
| NT | 182 | 70 | 7 | 259 |
| QLD | 6,736 | 1,345 | 212 | 8,293 |
| SA | 2,018 | 1,928 | 96 | 4,042 |
| TAS | 612 | 353 | 209 | 1,174 |
| VIC | 8,564 | 2,822 | 1,245 | 12,631 |
| WA | 2,630 | 1,239 | 313 | 4,182 |
| Australia | 29,509 | 12,620 | 2,300 | 44,429 |
| Female | ||||
| ACT | 277 | 45 | 45 | 367 |
| NSW | 4,565 | 2,695 | 67 | 7.327 |
| NT | 132 | 48 | 8 | 188 |
| QLD | 3,456 | 748 | 109 | 4,313 |
| SA | 1,152 | 975 | 46 | 2,173 |
| TAS | 280 | 184 | 112 | 576 |
| VIC | 4,898 | 1,605 | 593 | 7,096 |
| WA | 1,448 | 770 | 186 | 2,404 |
| Australia | 16,208 | 7,070 | 1,166 | 24,444 |
| Total | ||||
| ACT | 718 | 83 | 125 | 926 |
| NSW | 12,891 | 7,520 | 205 | 20,616 |
| NT | 314 | 118 | 15 | 447 |
| QLD | 10,192 | 2,093 | 321 | 12,606 |
| SA | 3,170 | 2,903 | 142 | 6,215 |
| TAS | 892 | 537 | 321 | 1,750 |
| VIC | 13,462 | 4,427 | 1,838 | 19,727 |
| WA | 4,078 | 2,009 | 499 | 6,586 |
| Australia | 45,717 | 19,690 | 3,466 | 68,873 |
[ Return to Top Return to Section ]
Table 8A
| Secondary Disability | ||||||||||||
|---|---|---|---|---|---|---|---|---|---|---|---|---|
| Primary Disability |
Intellectual |
Specific |
Autism |
Physical |
Deaf/Blind |
Vision |
Hearing |
Speech |
Psychiatric |
Neurological |
Acquired Brain Injury |
TOTAL |
| Open Employment | ||||||||||||
| Intellectual | 0 | 436 | 77 | 717 | 8 | 177 | 217 | 274 | 322 | 325 | 40 | 2,593 |
| Specific Learning/ADD | 121 | 0 | 20 | 245 | 3 | 39 | 51 | 56 | 170 | 103 | 3 | 811 |
| Autism | 70 | 77 | 0 | 27 | 0 | 11 | 7 | 16 | 47 | 23 | 2 | 280 |
| Physical | 310 | 233 | 5 | 0 | 19 | 141 | 173 | 119 | 545 | 222 | 54 | 1,821 |
| Deaf/Blind | 3 | 2 | 1 | 12 | 0 | 0 | 0 | 5 | 5 | 3 | 3 | 34 |
| Vision | 35 | 30 | 3 | 81 | 0 | 0 | 43 | 6 | 30 | 24 | 11 | 263 |
| Hearing | 90 | 46 | 3 | 141 | 0 | 55 | 0 | 57 | 31 | 25 | 7 | 455 |
| Speech | 27 | 16 | 0 | 14 | 1 | 2 | 6 | 0 | 5 | 1 | 1 | 73 |
| Psychiatric | 272 | 158 | 7 | 660 | 7 | 38 | 62 | 14 | 0 | 117 | 38 | 1,373 |
| Neurological | 108 | 101 | 4 | 199 | 4 | 30 | 29 | 28 | 86 | 0 | 25 | 614 |
| Acquired Brain Injury | 69 | 69 | 3 | 279 | 4 | 71 | 39 | 47 | 105 | 110 | 0 | 796 |
| Total | 1,105 | 1,168 | 123 | 2,375 | 46 | 564 | 627 | 622 | 1,346 | 953 | 184 | 9,113 |
| Supported Employment | ||||||||||||
| Intellectual | 0 | 821 | 238 | 1,458 | 59 | 714 | 553 | 1,414 | 787 | 741 | 67 | 6,852 |
| Specific Learning/ADD | 17 | 0 | 0 | 9 | 0 | 2 | 5 | 6 | 14 | 7 | 1 | 61 |
| Autism | 104 | 23 | 0 | 8 | 2 | 9 | 6 | 40 | 16 | 10 | 3 | 221 |
| Physical | 383 | 68 | 0 | 0 | 11 | 68 | 77 | 133 | 51 | 66 | 19 | 876 |
| Deaf/Blind | 22 | 4 | 0 | 4 | 0 | 0 | 0 | 10 | 5 | 3 | 1 | 49 |
| Vision | 57 | 4 | 3 | 30 | 0 | 0 | 16 | 5 | 6 | 7 | 1 | 129 |
| Hearing | 58 | 23 | 0 | 25 | 0 | 8 | 0 | 38 | 16 | 6 | 2 | 176 |
| Speech | 10 | 3 | 0 | 4 | 0 | 2 | 1 | 0 | 1 | 1 | 0 | 22 |
| Psychiatric | 225 | 23 | 8 | 95 | 1 | 15 | 17 | 22 | 0 | 32 | 8 | 446 |
| Neurological | 95 | 11 | 2 | 62 | 1 | 17 | 6 | 10 | 20 | 0 | 10 | 234 |
| Acquired Brain Injury | 83 | 18 | 3 | 163 | 1 | 39 | 14 | 44 | 35 | 67 | 0 | 467 |
| Total | 1,054 | 998 | 254 | 1,858 | 75 | 874 | 695 | 1,722 | 951 | 940 | 112 | 9,533 |
| Open and Supported Employment | ||||||||||||
| Intellectual | 0 | 50 | 19 | 93 | 0 | 26 | 35 | 52 | 51 | 34 | 3 | 363 |
| Specific Learning/ADD | 4 | 0 | 1 | 15 | 0 | 2 | 5 | 5 | 12 | 4 | 2 | 50 |
| Autism | 36 | 10 | 0 | 2 | 0 | 0 | 0 | 8 | 8 | 2 | 0 | 66 |
| Physical | 21 | 10 | 1 | 0 | 1 | 8 | 8 | 9 | 36 | 12 | 2 | 108 |
| Deaf/Blind | 1 | 0 | 1 | 1 | 0 | 0 | 0 | 1 | 0 | 0 | 0 | 4 |
| Vision | 3 | 3 | 0 | 6 | 0 | 0 | 0 | 2 | 0 | 2 | 0 | 16 |
| Hearing | 4 | 2 | 0 | 6 | 0 | 1 | 0 | 2 | 3 | 0 | 0 | 18 |
| Speech | 0 | 0 | 0 | 1 | 0 | 0 | 0 | 0 | 1 | 0 | 0 | 2 |
| Psychiatric | 25 | 3 | 2 | 47 | 1 | 1 | 6 | 2 | 0 | 7 | 3 | 97 |
| Neurological | 11 | 9 | 0 | 13 | 0 | 1 | 1 | 6 | 3 | 0 | 0 | 44 |
| Acquired Brain Injury | 9 | 1 | 0 | 19 | 0 | 5 | 2 | 5 | 6 | 7 | 0 | 54 |
| Total | 114 | 88 | 24 | 203 | 2 | 44 | 57 | 92 | 120 | 68 | 10 | 822 |
| Total | ||||||||||||
| Intellectual | 0 | 1,307 | 334 | 2,268 | 67 | 917 | 805 | 1,740 | 1,160 | 1,100 | 110 | 9,808 |
| Specific Learning/ADD | 142 | 0 | 21 | 269 | 3 | 43 | 61 | 67 | 196 | 114 | 6 | 922 |
| Autism | 210 | 110 | 0 | 37 | 2 | 20 | 13 | 64 | 71 | 35 | 5 | 567 |
| Physical | 714 | 311 | 6 | 0 | 31 | 217 | 258 | 216 | 632 | 300 | 75 | 2,805 |
| Deaf/Blind | 26 | 6 | 2 | 17 | 0 | 0 | 0 | 16 | 10 | 6 | 4 | 87 |
| Vision | 95 | 37 | 6 | 117 | 0 | 0 | 59 | 13 | 36 | 33 | 12 | 408 |
| Hearing | 152 | 71 | 3 | 172 | 0 | 64 | 0 | 97 | 50 | 31 | 9 | 649 |
| Speech | 37 | 19 | 0 | 19 | 1 | 4 | 7 | 0 | 7 | 2 | 1 | 97 |
| Psychiatric | 522 | 184 | 17 | 802 | 9 | 54 | 85 | 38 | 0 | 156 | 49 | 1.916 |
| Neurological | 214 | 121 | 6 | 274 | 5 | 48 | 36 | 44 | 109 | 0 | 35 | 892 |
| Acquired Brain Injury | 161 | 88 | 6 | 461 | 5 | 115 | 55 | 96 | 146 | 184 | 0 | 1,317 |
| Total | 2,273 | 2,254 | 401 | 4,436 | 123 | 1,482 | 1,379 | 2,436 | 2,417 | 1,961 | 306 | 19,468 |
[ Return to Top Return to Section ]
Table 9A
| Support / Assistance Needed | |||||||||
|---|---|---|---|---|---|---|---|---|---|
| Primary Disability |
Self Care |
Mobility |
Communication |
Interpersonal |
Learning |
Education |
Community |
Domestic |
Working |
| No Help Does Not Use Aids | |||||||||
| Intellectual | 13,378 | 14,516 | 8,495 | 4,358 | 1,406 | 1,591 | 5,103 | 6,537 | 1,141 |
| Specific Learning/ADD | 3,838 | 3,567 | 2,280 | 1,529 | 464 | 598 | 2,042 | 2,701 | 424 |
| Autism | 720 | 735 | 330 | 104 | 96 | 144 | 251 | 339 | 54 |
| Physical | 7,209 | 5,669 | 7,348 | 6,056 | 5,284 | 5,516 | 6,320 | 5,809 | 1,815 |
| Deaf/Blind | 132 | 94 | 64 | 73 | 55 | 60 | 83 | 95 | 18 |
| Vision | 1,159 | 587 | 1,344 | 1,109 | 691 | 708 | 967 | 788 | 208 |
| Hearing | 1,846 | 1,821 | 215 | 782 | 598 | 557 | 1,004 | 1,401 | 267 |
| Speech | 146 | 142 | 23 | 47 | 42 | 44 | 75 | 99 | 20 |
| Psychiatric | 1,352 | 9,986 | 6,836 | 3,064 | 4,219 | 5,098 | 5,433 | 6,646 | 1,378 |
| Neurological | 9,304 | 1,216 | 1,108 | 766 | 532 | 631 | 933 | 949 | 246 |
| Acquired Brain Injury | 1,399 | 1,305 | 1,021 | 626 | 278 | 423 | 789 | 907 | 182 |
| Total | 40,483 | 39,638 | 29,064 | 18,514 | 13,665 | 15,370 | 23,000 | 26,271 | 5,753 |
| No Help Does Use Aids | |||||||||
| Intellectual | 768 | 998 | 743 | 648 | 530 | 454 | 560 | 625 | 472 |
| Specific Learning/ADD | 161 | 189 | 168 | 150 | 118 | 130 | 189 | 179 | 127 |
| Autism | 47 | 55 | 33 | 22 | 22 | 28 | 37 | 40 | 23 |
| Physical | 682 | 1,005 | 372 | 392 | 476 | 496 | 511 | 553 | 482 |
| Deaf/Blind | 23 | 35 | 29 | 21 | 23 | 35 | 34 | 30 | 22 |
| Vision | 240 | 452 | 129 | 67 | 213 | 249 | 182 | 227 | 445 |
| Hearing | 106 | 93 | 313 | 196 | 222 | 233 | 195 | 165 | 178 |
| Speech | 8 | 9 | 4 | 7 | 7 | 6 | 8 | 6 | 4 |
| Psychiatric | 101 | 470 | 394 | 340 | 388 | 441 | 406 | 461 | 232 |
| Neurological | 452 | 126 | 67 | 60 | 69 | 71 | 63 | 88 | 66 |
| Acquired Brain Injury | 107 | 150 | 72 | 65 | 73 | 78 | 85 | 100 | 60 |
| Total | 2,695 | 3,582 | 2,324 | 1,968 | 2,141 | 2,221 | 2,270 | 2474 | 2,111 |
| Sometimes Requires Help | |||||||||
| Intellectual | 10,667 | 8,590 | 14,568 | 17,063 | 18,995 | 15,605 | 13,253 | 12,636 | 19,022 |
| Specific Learning/ADD | 685 | 950 | 2,281 | 2,846 | 3,855 | 3,511 | 1,987 | 1,380 | 3,826 |
| Autism | 444 | 366 | 778 | 898 | 902 | 771 | 609 | 559 | 890 |
| Physical | 2,010 | 3,232 | 2,644 | 3,667 | 4,243 | 3,572 | 2,741 | 2,834 | 7,313 |
| Deaf/Blind | 56 | 73 | 90 | 108 | 123 | 98 | 76 | 67 | 144 |
| Vision | 275 | 721 | 388 | 512 | 799 | 661 | 451 | 485 | 1,122 |
| Hearing | 188 | 229 | 1,237 | 1,055 | 1,215 | 1,113 | 705 | 403 | 1,590 |
| Speech | 35 | 40 | 142 | 127 | 140 | 127 | 84 | 70 | 157 |
| Psychiatric | 477 | 2,306 | 5,433 | 8,552 | 7,353 | 5,738 | 5,311 | 4,072 | 9,581 |
| Neurological | 2,722 | 575 | 804 | 1,087 | 1,272 | 1,060 | 781 | 703 | 1,489 |
| Acquired Brain Injury | 539 | 585 | 996 | 1,281 | 1,521 | 1,219 | 924 | 792 | 1,554 |
| Total | 18,098 | 17,667 | 29,361 | 37,196 | 40,418 | 33,475 | 26,922 | 24,001 | 46,688 |
| Unable To Do/Always Needs Help | |||||||||
| Intellectual | 1,789 | 1,101 | 3,557 | 4,826 | 6,349 | 8,082 | 5,879 | 4,630 | 6,559 |
| Specific Learning/ADD | 45 | 242 | 91 | 189 | 365 | 471 | 154 | 106 | 377 |
| Autism | 82 | 86 | 206 | 311 | 277 | 300 | 283 | 223 | 325 |
| Physical | 608 | 497 | 306 | 354 | 531 | 646 | 443 | 791 | 946 |
| Deaf/Blind | 16 | 9 | 45 | 20 | 26 | 34 | 27 | 23 | 45 |
| Vision | 29 | 105 | 21 | 32 | 50 | 72 | 41 | 59 | 98 |
| Hearing | 20 | 197 | 443 | 113 | 139 | 199 | 72 | 53 | 159 |
| Speech | 8 | 23 | 33 | 19 | 14 | 18 | 13 | 11 | 20 |
| Psychiatric | 74 | 777 | 458 | 879 | 765 | 784 | 578 | 477 | 1,654 |
| Neurological | 314 | 114 | 70 | 98 | 157 | 188 | 117 | 133 | 223 |
| Acquired Brain Injury | 116 | 84 | 112 | 183 | 303 | 326 | 225 | 218 | 383 |
| Total | 3,101 | 3,235 | 5,342 | 7,024 | 8,976 | 11,120 | 7,832 | 6,724 | 10,789 |
| Not Known | |||||||||
| Intellectual | 1,613 | 3,010 | 852 | 1,320 | 935 | 2,483 | 3,420 | 3,787 | 1,021 |
| Specific Learning/ADD | 301 | 82 | 210 | 316 | 228 | 320 | 658 | 664 | 276 |
| Autism | 113 | 164 | 59 | 71 | 109 | 163 | 226 | 245 | 114 |
| Physical | 635 | 741 | 474 | 675 | 610 | 914 | 1,129 | 1,157 | 588 |
| Deaf/Blind | 11 | 27 | 10 | 16 | 11 | 11 | 18 | 23 | 9 |
| Vision | 285 | 123 | 106 | 268 | 235 | 298 | 347 | 429 | 115 |
| Hearing | 218 | 38 | 170 | 232 | 204 | 276 | 402 | 356 | 184 |
| Speech | 27 | 10 | 22 | 24 | 21 | 29 | 44 | 38 | 23 |
| Psychiatric | 152 | 277 | 695 | 981 | 1,091 | 1,755 | 2,088 | 2,160 | 971 |
| Neurological | 1,024 | 125 | 107 | 145 | 126 | 206 | 262 | 283 | 132 |
| Acquired Brain Injury | 117 | 154 | 77 | 123 | 103 | 232 | 255 | 261 | 99 |
| Total | 4,496 | 4,751 | 2,782 | 4,171 | 3,673 | 6,687 | 8,849 | 9,403 | 3,532 |
[ Return to Top Return to Section ]
Table 10A
| Support / Assistance Needed | |||||||||
|---|---|---|---|---|---|---|---|---|---|
| Employment Service Outlet Type |
Self Care |
Mobility |
Communication |
Interpersonal |
Learning |
Education |
Community |
Domestic |
Working |
| No Help Does Not Use Aids | |||||||||
| Open | 30,611 | 28,923 | 21,643 | 15,200 | 11,930 | 13,512 | 19,187 | 22,153 | 4,892 |
| Supported | 7,846 | 8,854 | 6,016 | 2,505 | 1,168 | 1,225 | 2,770 | 2,875 | 625 |
| Open and Supported | 2,026 | 1,861 | 1,405 | 809 | 567 | 633 | 1,043 | 1,243 | 236 |
| Total | 40,483 | 39,638 | 29,064 | 18,514 | 13,665 | 15,370 | 23,000 | 26,271 | 5,753 |
| No Help Does Use Aids | |||||||||
| Open | 1,973 | 2,605 | 1,757 | 1,508 | 1,703 | 1,855 | 1,860 | 2,012 | 1,810 |
| Supported | 556 | 809 | 467 | 387 | 345 | 276 | 287 | 315 | 264 |
| Open and Supported | 166 | 168 | 100 | 73 | 93 | 90 | 123 | 147 | 37 |
| Total | 2,695 | 3,582 | 2,324 | 1,968 | 2,141 | 2,221 | 2,270 | 2,474 | 2,111 |
| Sometimes Requires Help | |||||||||
| Open | 8,727 | 9,821 | 17,928 | 23,088 | 25,528 | 21,945 | 16,112 | 13,201 | 31,684 |
| Supported | 8,508 | 6,810 | 9,887 | 12,129 | 12,772 | 9,737 | 9,397 | 9,623 | 12,680 |
| Open and Supported | 863 | 1,036 | 1,546 | 1,979 | 2,118 | 1,793 | 1,413 | 1,177 | 2,324 |
| Total | 18,098 | 17,667 | 29,361 | 37,196 | 40,418 | 33,475 | 26,922 | 24,001 | 46,688 |
| Unable To Do/Always Needs Help | |||||||||
| Open | 1,028 | 1,722 | 1,988 | 2,425 | 3,348 | 3,886 | 2,272 | 2,044 | 4,205 |
| Supported | 1,965 | 2,820 | 3,092 | 4,223 | 5,137 | 6,665 | 5,188 | 4,379 | 5,911 |
| Open and Supported | 108 | 209 | 262 | 376 | 491 | 569 | 372 | 301 | 673 |
| Total | 3,101 | 4,751 | 5,342 | 7,024 | 8,976 | 11,120 | 7,832 | 6,724 | 10,789 |
| Not Known | |||||||||
| Open | 3,378 | 2,646 | 2,401 | 3,496 | 3,208 | 4,519 | 6,286 | 6,307 | 3,126 |
| Supported | 815 | 397 | 228 | 446 | 268 | 1,787 | 2,048 | 2,498 | 210 |
| Open and Supported | 303 | 192 | 153 | 229 | 197 | 381 | 515 | 598 | 196 |
| Total | 4,496 | 3,235 | 2,782 | 4,171 | 3,673 | 6,687 | 8,849 | 9,403 | 3,532 |
[ Return to Top Return to Section ]
Table 11A
| Basis of Employment |
ACT |
NSW |
NT |
QLD |
SA |
TAS |
VIC |
WA |
Aust. |
|---|---|---|---|---|---|---|---|---|---|
| Open Employment Service | |||||||||
| Full-time – Permanent | 87 | 1,609 | 37 | 929 | 307 | 77 | 1,264 | 454 | 4,764 |
| Part-time – Permanent | 148 | 1,686 | 60 | 1,088 | 378 | 107 | 1,819 | 705 | 5,991 |
| Casual – Permanent | 84 | 1,177 | 29 | 1,413 | 378 | 63 | 913 | 465 | 4,522 |
| Seasonal – Permanent | 1 | 8 | 0 | 28 | 5 | 2 | 10 | 10 | 64 |
| Full-time – Temporary | 10 | 98 | 2 | 88 | 58 | 5 | 194 | 37 | 492 |
| Part-time – Temporary | 13 | 109 | 10 | 88 | 83 | 7 | 222 | 52 | 584 |
| Casual – Temporary | 35 | 477 | 7 | 522 | 217 | 41 | 410 | 188 | 1,897 |
| Seasonal – Temporary | 1 | 9 | 0 | 12 | 19 | 1 | 13 | 9 | 64 |
| Total | 379 | 5,173 | 145 | 4,168 | 1,445 | 303 | 4,845 | 1,920 | 18,378 |
| Supported Employment Service | |||||||||
| Full-time – Permanent | 3 | 2,708 | 26 | 907 | 1,275 | 233 | 1,274 | 456 | 6,882 |
| Part-time – Permanent | 70 | 3,418 | 54 | 702 | 1,024 | 233 | 2,177 | 1,275 | 8,953 |
| Casual – Permanent | 0 | 223 | 0 | 146 | 170 | 6 | 234 | 6 | 785 |
| Seasonal – Permanent | 0 | 3 | 3 | 0 | 0 | 0 | 0 | 0 | 6 |
| Full-time – Temporary | 0 | 0 | 0 | 0 | 1 | 0 | 9 | 1 | 11 |
| Part-time – Temporary | 0 | 15 | 1 | 0 | 12 | 0 | 11 | 0 | 39 |
| Casual – Temporary | 0 | 9 | 0 | 0 | 5 | 1 | 2 | 0 | 17 |
| Seasonal – Temporary | 0 | 1 | 0 | 0 | 0 | 0 | 0 | 0 | 1 |
| Total | 73 | 6,377 | 84 | 1,755 | 2,487 | 473 | 3,707 | 1,738 | 16,694 |
| Open and Supported Employment Service | |||||||||
| Full-time – Permanent | 5 | 16 | 0 | 103 | 4 | 17 | 206 | 9 | 360 |
| Part-time – Permanent | 63 | 73 | 9 | 98 | 37 | 72 | 306 | 98 | 756 |
| Casual – Permanent | 19 | 37 | 0 | 11 | 16 | 4 | 142 | 185 | 414 |
| Seasonal – Permanent | 0 | 0 | 0 | 1 | 1 | 0 | 1 | 1 | 4 |
| Full-time – Temporary | 0 | 0 | 0 | 0 | 0 | 0 | 29 | 0 | 29 |
| Part-time – Temporary | 0 | 6 | 0 | 0 | 0 | 19 | 52 | 10 | 87 |
| Casual – Temporary | 0 | 14 | 0 | 0 | 2 | 14 | 21 | 17 | 68 |
| Seasonal – Temporary | 0 | 1 | 0 | 0 | 0 | 0 | 1 | 0 | 2 |
| Total | 87 | 147 | 9 | 213 | 60 | 126 | 758 | 320 | 1,720 |
| Total | |||||||||
| Full-time – Permanent | 95 | 4,333 | 63 | 1,939 | 1,586 | 327 | 2,744 | 919 | 12,006 |
| Part-time – Permanent | 281 | 5,177 | 123 | 1,888 | 1,439 | 412 | 4,302 | 2,078 | 15,700 |
| Casual – Permanent | 103 | 1,437 | 29 | 1,570 | 564 | 73 | 1,289 | 656 | 5,721 |
| Seasonal – Permanent | 1 | 11 | 3 | 29 | 6 | 2 | 11 | 11 | 74 |
| Full-time – Temporary | 10 | 98 | 2 | 88 | 59 | 5 | 232 | 38 | 532 |
| Part-time – Temporary | 13 | 130 | 11 | 88 | 95 | 26 | 285 | 62 | 710 |
| Casual – Temporary | 35 | 500 | 7 | 522 | 224 | 56 | 433 | 205 | 1,982 |
| Seasonal – Temporary | 1 | 11 | 0 | 12 | 19 | 1 | 14 | 9 | 67 |
| Total | 539 | 11,697 | 238 | 6,136 | 3,992 | 902 | 9,310 | 3,978 | 36,792 |
Note: Data exclude 23 Victorian consumers who were in supported employment services but whose basis of employment were not collected
[ Return to Top Return to Section ]
Table 12A
| Weekly Hours | ||||||
|---|---|---|---|---|---|---|
| Weekly Wage |
<8 |
8-15 |
16-30 |
31-40 |
>40 |
Total |
| Supported Employment Setting | ||||||
| No Wage | 1 | 22 | 18 | 6 | 0 | 47 |
| $1–$20 | 72 | 963 | 759 | 362 | 0 | 2,156 |
| $21–$40 | 27 | 867 | 1,812 | 1,841 | 1 | 4,548 |
| $41–$60 | 11 | 421 | 1,531 | 2,483 | 1 | 4,447 |
| $61–$80 | 5 | 225 | 636 | 1,900 | 0 | 2,766 |
| $81–$100 | 10 | 142 | 349 | 831 | 0 | 1,332 |
| $101–$150 | 4 | 185 | 330 | 837 | 0 | 1,356 |
| $151–$200 | 0 | 60 | 121 | 254 | 0 | 435 |
| $201–$250 | 0 | 39 | 43 | 101 | 0 | 183 |
| $251–$300 | 0 | 14 | 42 | 71 | 0 | 127 |
| $301–$350 | 0 | 9 | 23 | 41 | 1 | 74 |
| $351–$400 | 1 | 2 | 21 | 31 | 3 | 58 |
| $401–$450 | 0 | 2 | 19 | 70 | 0 | 91 |
| $451–$500 | 0 | 3 | 6 | 18 | 2 | 29 |
| >$500 | 0 | 0 | 11 | 58 | 2 | 71 |
| Total | 131 | 2,954 | 5,721 | 8,904 | 10 | 17,720 |
| Open Labour Market | ||||||
| No Wage | 4 | 155 | 116 | 136 | 4 | 415 |
| $1–$20 | 15 | 71 | 48 | 20 | 0 | 154 |
| $21–$40 | 37 | 57 | 14 | 6 | 0 | 114 |
| $41–$60 | 50 | 537 | 72 | 14 | 0 | 673 |
| $61–$80 | 28 | 572 | 73 | 12 | 2 | 687 |
| $81–$100 | 30 | 675 | 102 | 11 | 1 | 819 |
| $101–$150 | 23 | 2,012 | 460 | 44 | 0 | 2,539 |
| $151–$200 | 3 | 975 | 623 | 142 | 6 | 1,749 |
| $201–$250 | 8 | 562 | 916 | 436 | 5 | 1,927 |
| $251–$300 | 2 | 192 | 986 | 386 | 11 | 1,577 |
| $301–$350 | 0 | 83 | 754 | 405 | 9 | 1,251 |
| $351–$400 | 1 | 49 | 576 | 557 | 22 | 1,205 |
| $401–$450 | 0 | 40 | 415 | 1,094 | 48 | 1,597 |
| $451–$500 | 4 | 17 | 191 | 866 | 28 | 1,106 |
| >$500 | 0 | 33 | 281 | 2,139 | 155 | 2,608 |
| Total | 205 | 6,030 | 5,627 | 6,268 | 291 | 18,421 |
| Other Setting | ||||||
| No Wage | 0 | 8 | 8 | 5 | 2 | 23 |
| $1–$20 | 1 | 27 | 8 | 4 | 0 | 40 |
| $21–$40 | 4 | 96 | 19 | 7 | 0 | 126 |
| $41–$60 | 4 | 24 | 17 | 40 | 0 | 85 |
| $61–$80 | 2 | 27 | 21 | 10 | 0 | 60 |
| $81–$100 | 5 | 18 | 6 | 8 | 0 | 37 |
| $101–$150 | 2 | 41 | 23 | 3 | 0 | 69 |
| $151–$200 | 1 | 15 | 23 | 9 | 0 | 48 |
| $201–$250 | 0 | 8 | 8 | 25 | 0 | 41 |
| $251–$300 | 0 | 7 | 21 | 8 | 0 | 36 |
| $301–$350 | 0 | 3 | 4 | 9 | 0 | 16 |
| $351–$400 | 0 | 0 | 7 | 20 | 0 | 27 |
| $401–$450 | 0 | 0 | 3 | 4 | 1 | 8 |
| $451–$500 | 0 | 0 | 5 | 15 | 0 | 20 |
| >$500 | 0 | 0 | 0 | 15 | 0 | 15 |
| Total | 19 | 274 | 173 | 182 | 3 | 651 |
| TOTAL | 355 | 9,258 | 11,521 | 15,354 | 304 | 36,792 |
Note: Data exclude 23 Victorian consumers who were in supported employment services but whose employment settings were not collected
[ Return to Top Return to Section ]
Table 13A
| Employment Service Outlet Type | ||||
|---|---|---|---|---|
| Weekly Wage |
Open Employment |
Supported Employment |
Open and Supported Employment |
Total |
| 2004 | ||||
| No Wage | 422 | 14 | 49 | 485 |
| $1–$20 | 164 | 2,103 | 83 | 2,350 |
| $21–$40 | 147 | 4,444 | 200 | 4,791 |
| $41–$60 | 677 | 4,331 | 199 | 5,207 |
| $61–$80 | 680 | 2,693 | 141 | 3,514 |
| $81–$100 | 846 | 1,229 | 114 | 2,189 |
| $101–$150 | 2,552 | 1,222 | 196 | 3,970 |
| $151–$200 | 1,785 | 353 | 97 | 2,235 |
| $201–$250 | 1,922 | 120 | 113 | 2,155 |
| $251–$300 | 1,572 | 83 | 87 | 1,742 |
| $301–$350 | 1,238 | 42 | 61 | 1,341 |
| $351–$400 | 1,162 | 28 | 101 | 1,291 |
| $401–$450 | 1,599 | 12 | 85 | 1,696 |
| $451–$500 | 1,091 | 14 | 50 | 1,155 |
| >$500 | 2,521 | 29 | 144 | 2,694 |
| Total | 18,378 | 16,717 | 1,720 | 36,815 |
| 2003 | ||||
| No Wage | 335 | 79 | 17 | 431 |
| $1–$20 | 187 | 2,216 | 147 | 2,550 |
| $21–$40 | 214 | 4,253 | 168 | 4,635 |
| $41–$60 | 746 | 4,526 | 218 | 5,490 |
| $61–$80 | 637 | 2,587 | 130 | 3,354 |
| $81–$100 | 958 | 1,092 | 117 | 2,167 |
| $101–$150 | 2,505 | 1,058 | 186 | 3,749 |
| $151–$200 | 1,793 | 272 | 145 | 2,210 |
| $201–$250 | 1,927 | 116 | 125 | 2,168 |
| $251–$300 | 1,608 | 68 | 94 | 1,770 |
| $301–$350 | 1,144 | 35 | 73 | 1,252 |
| $351–$400 | 1,181 | 16 | 62 | 1,259 |
| $401–$450 | 1,716 | 13 | 50 | 1,779 |
| $451–$500 | 937 | 17 | 52 | 1,006 |
| >$500 | 2,033 | 16 | 113 | 2,162 |
| Total | 17,921 | 16,364 | 1,697 | 35,982 |
| 2002 | ||||
| No Wage | 147 | 116 | 23 | 286 |
| $1–$20 | 121 | 2,137 | 451 | 2,709 |
| $21–$40 | 229 | 3,831 | 611 | 4,671 |
| $41–$60 | 814 | 4,420 | 310 | 5,544 |
| $61–$80 | 590 | 2,404 | 159 | 3,153 |
| $81–$100 | 995 | 981 | 108 | 2,084 |
| $101–$150 | 2,344 | 882 | 289 | 3,515 |
| $151–$200 | 1,755 | 229 | 190 | 2,174 |
| $201–$250 | 1,780 | 99 | 132 | 2,011 |
| $251–$300 | 1,432 | 57 | 93 | 1,582 |
| $301–$350 | 1,051 | 34 | 78 | 1,163 |
| $351–$400 | 1,213 | 27 | 90 | 1,330 |
| >$400 | 4,133 | 39 | 204 | 4,376 |
| Total | 16,604 | 15,256 | 2,738 | 34,598 |
| 2001 | ||||
| No Wage | 24 | 130 | 10 | 164 |
| $1–$20 | 89 | 2,215 | 460 | 2,764 |
| $21–$40 | 204 | 3,663 | 638 | 4,505 |
| $41–$60 | 704 | 4,657 | 288 | 5,649 |
| $61–$80 | 594 | 2,033 | 183 | 2,810 |
| $81–$100 | 955 | 866 | 143 | 1,964 |
| $101–$150 | 2,116 | 864 | 321 | 3,301 |
| $151–$200 | 1,853 | 233 | 220 | 2,306 |
| $201–$250 | 1,751 | 88 | 168 | 2,007 |
| $251–$300 | 1,358 | 51 | 130 | 1,539 |
| $301–$350 | 1,065 | 25 | 108 | 1,198 |
| $351–$400 | 1,245 | 16 | 83 | 1,344 |
| >$400 | 3,488 | 31 | 227 | 3,746 |
| Total | 15,446 | 14,872 | 2,979 | 33,297 |
[ Return to Top Return to Section ]
-
- Table 1A Disability Service Type by Jurisdiction and Type of Staff Hours
- Table 2A Employment Service Outlet Type by Jurisdiction and Type of Staff Hours
- Table 3A All Consumers: Indigenous Origin by Jurisdiction and Employment Service Outlet Type
- Table 4A All Consumers: Country of Birth by Jurisdiction and Employment Service Outlet Type
- Table 5A All Consumers: Main Language Spoken at Home by Jurisdiction
- Table 6A All Consumers: Need for Interpreter by Jurisdiction and Employment Service Outlet Type
- Table 7A All Consumers: Employment Service Outlet Type Across Gender and Jurisdiction
- Table 8A All Consumers: Secondary Disability by Primary Disability Across Employment Service Outlet Type
- Table 9A All Consumers: Need for Support/Assistance by Primary Disability and Area of Need
- Table 10A All Consumers: Need for Support/Assistance by Employment Service Outlet Type and Area of Need
- Table 11A Employed Consumers: Basis of Employment by Employment Service Outlet Type and Jurisdiction
- Table 12A Employed Consumers: Weekly Wage by Weekly Hours Across Employment Setting
- Table 13A Employed Consumers: Weekly Wage by Employment Service Outlet Type Across Census Years (2004, 2003, 2002, 2001)
Glossary
A
- Aboriginal origin
- - a person who self-identifies, or is identified as, being of Aboriginal heritage.
- Aboriginal and Torres Strait Islander origin
- - a person who self-identifies, or is identified as, being of Aboriginal and Torres Strait Islander heritage.
- ABS
- - Australian Bureau of Statistics.
- Accepted and commenced
- - consumers who, between 1 July 2003 and 30 June 2004, were referred to a service and who were accepted, and commenced receiving assistance from that service during that time
- Acquired brain injury (ABI)
- - damage to the brain acquired after birth.
- ADD
- - Attention Deficit Disorder; a behaviour disorder usually diagnosed in childhood. The disorder is also commonly called ADHD (Attention-Deficit/ Hyperactivity Disorder).
- Advocacy services
- - services specialising in the representation of people with a disability, their views and interests.
- All people assisted
- - the number of consumers who received active employment assistance support during the 2003-04 financial year.
- Alzheimer's Disease
- -a type of dementia classified as a neurological disability.
- Apprenticeship
- -a form of paid employment where an individual works for another for a specific amount of time in return for instruction in a trade, art, or business.
- ARIA
- - Accessibility/Remoteness Index of Australia. It is a measure of remoteness calculated from road distance between service outlets and populated localities within Australia.
- Auslan
- - Australian sign language.
- Autism
- - a pervasive developmental disorder characterised by restricted, repetitive and stereotyped patterns of behaviour, and impairment in communication skills and social interactions.
- Average standard hours
- - the standard number of hours worked by a consumer. If standard hours vary, this is an estimate of the average.
- Awards/agreements
- - a written document between an employer and employee about the terms and conditions of employment. Examples of such documents are a Certied Agreement, an Australian Workplace Agreement, and an SWS Productivity Based Wage.
- Award wage
- - the minimum legal rate of pay set in the relevant award for a particular occupation.
B
- Basis of employment
- - the basis on which a consumer is employed (e.g., full-time, part-time, casual).
- Benefits
- - monetary payments provided by the Government to a consumer (e.g., Disability Support Pension, Newstart/Youth Allowance).
- Block Grant Funding
- - monies paid to an organisation for the purposes of provision of employment assistance to eligible job seekers and workers.
- Brain injury/damage
- - injury to the brain which may have been caused by one or more of the following conditions; head trauma, inadequate oxygen supply, or infection.
- Business service
- - another term used to refer to supported employment services.
[ Return to Top Return to Section ]
C
- Carer
- - someone who provides care and assistance on a regular and sustained basis to a consumer. Workers or volunteers of formal services should not be classified as carers.
- Carer number
- - total number of carers assisted by FaCS-funded respite services during the 2003-04 financial year.
- Carer allowance (child)
- - a form of financial assistance paid by the Australian Government to a parent or guardian of a disabled young person aged less than 16 years.
- Carer relationship
- - the relationship of the carer and the care receiver.
- Case Based Funding (CBF)
- - a funding model which links individual needs to employment outcomes. Financial payments are made to an employment service in accordance with the amount of money deemed necessary to assist a particular individual. CBF includes funding provided through Phase One or Two of the CBF Trial or 2002-03 Growth Funding.
- Casual employment
- - paid employment often characterised by irregular hours and higher hourly rates of pay compared to part- and full-time employment. Casual employment can be either temporary or permanent, and employees are not usually entitled to holiday or sick leave.
- Certified agreement
- - a specifically negotiated workplace agreement.
- Cessation reason
- - the reason a consumer reportedly left a service.
- Communication
- - making oneself understood by others, and understanding others.
- Community (civic) and economic life
- - participating in community life, recreation, human rights and economic life, such as handling money.
- Community support
- - a form of service provided to people with a disability that includes advocacy, information, and print disability.
- Consumers 'on the books'
- - the total number of consumers on 30 June 2004 registered as receiving support from a disability employment service.
- Consumer referrals
- - consumers referred to a service during 2003-04 by Centrelink or another source.
- CSTDA
- - Commonwealth State/Territory Disability Agreement.
D
- Days of operation
- - the days of the week that a service usually operates. If days of operation during the collection week (28 June-2 July 2004) are not typical for the service, typical hours should be recorded as well.
- Deaf/Blind
- - having sensory impairment to both hearing and sight.
- Direct support staff
- - staff that have direct contact with consumers in a support role.
- Disability support pension (DSP)
- - a form of financial assistance paid by the Australian Government to persons with a specified degree of disability.
- Does not need Assistance, uses aids
- - the consumer does not need help or supervision to perform the task, but uses aids and/or equipment.
- Does not need Assistance, Does Not Use Aids
- - the consumer does not need help or supervision to perform the task, and does not use aids and/or equipment.
- Domestic life
- - home and living skills such as shopping, housekeeping, cooking and home maintenance.
- Domestic-scale supported living
- - a community living setting where staff or volunteers provide domestic support to people with a disability (e.g., congregate care, community residential units, and group homes). These services may or may not provide 24 hour supervision and care.
- Duration of employment
- - the length of time an employment service consumer has been employed during the financial year. This is recorded as the number of months and weeks.
[ Return to Top Return to Section ]
E
- Effective communication
- - the ability to express more than basic needs to unfamiliar people (e.g., the exchange of thoughts, messages, or information) via speech, signals, writing, and/or behaviour.
- Eligible job seekers
- - consumers who have not worked during the reporting period.
- Employed (fy)
- - identifies whether the consumer has had a period of employment during a particular financial year.
- Employment service type
- - the type of employment service an outlet provides. The service may be open, supported or a combination of open and supported (i.e., dual)
- Exit date
- - the date on which an outlet stopped proving service/support to a consumer. This is recorded as ddmmyyyy.
F
- FaCS
- - (Australian Government) Department of Family and Community Services.
- FaCS funded respite care
- - a program funded by FaCS aimed at increasing the provision of immediate and short-term respite to carers of people with severe/ profound disabilities.
- Financial year
- - the year dated 1 July to 30 June. The financial year for this report is 1 July 2003 to 30 June 2004.
- Full award wage
- - the income set in the relevant award for a particular occupation.
- Full-time employment
- - employment of at least 35 hours per week.
G
[ Return to Top Return to Section ]
H
- Hearing
- - a disability grouping encompassing deafness, hearing impairment and hearing loss.
- Hours
- - the average number of hours per week worked by a staff member in a disability-related service.
I
- Income
- - any monies given to a consumer by an agency, department, or business, in exchange for labour or services (i.e., work).
- Independent worker
- - an individual who a service assisted to obtain employment in the previous financial year (i.e., 2002-03) and who continues to work, but who received no employment assistance from the service in this financial year (i.e., 2003-04).
- Indigenous origin
- - a person who is identified as being of Aboriginal and/or Torres Strait Islander origin in response to a verbal or written question.
- Indirect support staff
- - staff that have no, or only a minimal, direct supporting role.
- Individualised funding
- - money paid to a disability employment service on the basis of the needs of an individual consumer. Examples of such funding are case based funding and futures for young adults.
- Individual workplace agreement
- - a written agreement between an employer and employee about the terms and conditions of employment.
- Information/referral services
- - services that provide accessible information to people with disabilities, their carers, families and relevant professionals.
- Intellectual disability
- - a type of disability that involves a deficit in cognitive ability (i.e., the brain is not working to its full age-appropriate capacity). The severity of an intellectual disability can range from minor to profound, and may be caused by genetic or environmental factors.
- Interpersonal interactions and relationships
- - forming and maintaining friendships, coping with feelings and behaving within socially accepted boundaries.
- Interpreter service
- - a service that interprets the communication between a consumer and an employment service. Spoken languages other than English and non-spoken communication (e.g., sign language) are interpreted via these services.
J
- Job seeker
- - a consumer who receives support from an employment service to prepare him/her for employment.
K
[ Return to Top Return to Section ]
L
- Language spoken at home
- - the language spoken by a consumer in their current home.
- Last received support
- - the date when support was last received by the consumer. This is recorded as ddmmyyyy.
- Learning disability
- - a disability grouping used to define persons with significant difficulty in the acquisition and use of listening, speaking, reading, writing, and/or mathematical skills.
- Linkage key
- - a statistical tool that enables client data to be matched across different data collections. This tool is often called the Statistical Linkage Key (SLK). It comprises the 2nd, 3rd and 5th letters of the consumer's surname, 2nd and 3rd letters of the consumer's first name, their date of birth and sex.
- Lives alone
- - consumer lives alone in private or public housing.
- Lives with family
- - consumer lives with family members, foster family or partner.
- Lives with others
- - consumer shares with friends or a carer who is not a family member.
- Living arrangements
- - whom the consumer resides with (i.e., alone or with related or unrelated persons).
M
- Main language spoken
- - the language used most often by the consumer to communicate with other residents or visitors in their current home.
- Main source of income
- - of all sources of income, this is the source of the greatest amount received from an individual agency, department, or business.
- Method of communication
- - the most effective and common way by which the consumer communicates.
- Mobility
- - ability to move around the home or other environment, including the use of public transport and/or driving a vehicle.
- Mobility allowance
- - a form of financial assistance paid by the Australian Government to persons with a significant degree of difficulty with mobility.
N
- Neurological disability
- - a disability grouping used to define persons with impairment of the nervous system occurring after birth. Conditions included under this category are epilepsy, dementia, multiple sclerosis, and Parkinson's Disease.
- New job seeker
- - an eligible job seeker who did not receive employment assistance from a service outlet during the previous financial year (i.e., 2002-03).
- Newstart/Youth allowance
- - a form of financial assistance paid by the Australian Government to young Australians who are studying, undertaking training, looking for work or temporarily incapacitated.
- New worker
- - a worker who reached the worker target in 2003-04, but who worked for less than three months in 2002-03.
- Non-spoken communication
- - effective ways of communicating that do not include verbal cues, such as speaking or murmurs. Examples include the use of sign language, Canon Communicator, and Compic.
- Non-vocational program
- - a program that is not designed for vocational training (e.g., study, work experience, work), but rather for recreational purposes (e.g., social outings, sporting activities).
- Not known
- - the consumers' situation in respect to a particular question was not known.
- No wage
- - the consumer did not receive payment for work undertaken.
- Number of consumers
- - the total number of persons who received employment assistance during the 2003-04 financial year.
- Number of consumers 'on the books'
- - the number of active consumers listed with a service on 30 June 2004.
- Number of hours
- - the average number of hours a consumer worked per week during the 2003-04 financial year.
- Number of months
- - the number of months a consumer worked during the 2003-04 financial year.
- Number of workers meeting worker target
- - the total number of consumers who worked in paid employment for at least eight hours per week for three months or more during the 2003-04 financial year.
- Number of workers not meeting worker target
- - the total number of consumers who did not work in paid employment for at least eight hours per week for three months or more during the 2003-04 financial year.
[ Return to Top Return to Section ]
O
- 'On the books'
- - a consumer who, on 30 June 2004, was registered as receiving support from a disability service.
- Open employment service outlets
- - services that provide employment assistance to people with a disability in obtaining and/or retaining paid employment in the open labour market.
- Open and supported employment service outlets
- - employment services that provided both open and supported employment assistance to people with a disability.
- Other income
- - money received by a consumer by an agency, department, or business in exchange for labour or services (i.e., work) which is in addition to the consumer's main source of income. Examples include superannuation and dividends/interest from investments.
- Other pension/benefit
- - financial assistance paid by the Australian Government other than the DSP, Newstart/Youth Allowance or Mobility Allowance. Such payments might include monies paid to Veterans and their families through the Department of Veterans' Affairs. Superannuation is not included in this category.
- Other referral source
- - an agency or business other than Centrelink, who refers potential consumers to disability employment services. For example, schools, a workplace, or another service provider.
- Other setting of employment
- - a place of employment that is neither an open nor supported employment setting. For example, self-employed positions or contract work.
- Other significant disability group
- - a disability group that is secondary to the main (or primary) disability registered for a consumer.
P
- Paid employment
- - employment for which a consumer receives an income.
- Paid staff
- - staff that receive an income for being employed at a disability employment service.
- Part-time employment
- - employment of less than 35 hours per week.
- Pension/benefit
- - financial assistance paid by the Australian Government to persons in certain circumstances. An individual's circumstances will determine which pension/benefit they receive. Examples include DSP, Newstart/Youth Allowance and Mobility Allowance.
- Period of employment
- - the number of months and/or weeks a consumer worked in the financial year.
- Permanent employment
- - employment on a continuing basis with leave entitlements.
- Phase
- - the employment status of a consumer on 30 June 2004. Examples include worker, job seeker, and work experience.
- Physical disability
- - a type of disability that involves conditions attributable to a physical cause, that impact on one's ability to perform physical activities. It includes the effects of paraplegia, quadraplegia, cerebral palsy, and spina bifida.
- Pre-employment training
- - support given to a consumer to prepare them for employment and/or to help place them in employment.
- Primary disability group
- - the category of disability that causes the most difficulty to the consumer.
- Print disability services
- - services that provide alternative formats of communication for people who, by reason of disability, are unable to access printed information.
- Private residence
- - a home that the consumer lives in. It may be a house, flat, unit, caravan, or mobile home.
- Pro rata
- - a reduced wage based on the proportion of hours worked out of an equivalent full-time working week.
- Productivity based wage
- - a reduced wage based on a person's productive capacity, and paid under a legal industrial agreement.
- Psychiatric disability
- - a type of disability involving mental health conditions which have recognisable symptoms and behaviour patterns that impair personal and/or occupational/educational functioning. Examples include schizophrenia, depression and anxiety-related disorders.
Q
R
- Referrals
- - those consumers referred to a service by Centrelink or another source.
- Residential setting
- - the type of physical accommodation the consumer usually resides in (usually being 4 or more days per week).
- Respite care
- - immediate and/or short term care provided to enable some relief to a carer of a person with a with severe or profound disability.
[ Return to Top Return to Section ]
S
- Seasonal employment
- - work in a position or industry that experiences a dramatic employment increase for a defined period of time each year (e.g., fruit picking).
- Self-care
- - undertaking tasks involved in looking after one's self (e.g., eating, bathing, dressing, and going to the toilet).
- Sensory disability
- - a type of disability related to one of the senses (e.g., hearing, sight, and speech).
- Service form
- - the document used to collect information on a particular service.
- Service ID
- - the unique number assigned to a service by FaCS. In previous collections, this number was referred to as the TARDIS ID.
- Sign language
- - a form of communication involving hand movements and signals. Examples include Auslan and Makaton.
- Specific learning disorder/ADD
- - a group of disabilities characterised with difficulty in the acquisition and use of listening, speaking, reading, writing, reasoning and/or mathematical skills.
- Speech disability
- - a disability group encompassing loss of speech, impairment and/or difficulty in being understood.
- Staff hours
- - total number of hours worked by staff including volunteers and contract staff during the snapshot week.
- Support commencement date
- - the date a consumer received their first episode of support from a service. This is recorded as ddmmyyyy.
- Supported accommodation facility
- - accommodation which provides board or lodging for a number of people and which has support services provided by rostered care workers, usually on a 24 hour basis.
- Supported employment service outlets
- - services that directly provide support and employment to people with a disability.
- Support needs
- - the degree of a consumer's requirements for help and/or supervision in various areas.
- SWS productivity based wage
- - a productivity based wage determined in accordance with the Supported Wage System.
T
- Temporary employment
- - fixed (usually short) term employment, which includes entitlements to paid holiday and sick leave.
- Torres Strait Islander Origin
- - a person who self-identifies, or is identified as, being of Torres Strait Islander heritage.
U
- Unpaid staff
- - unpaid hours worked by staff or volunteers.
V
- Visual disability
- - a disability grouping, which encompasses blindness and vision impairment which is not corrected by prescription glasses or contact lenses.
- Vocational program
- - a program, which prepares a consumer for employment or helps to place them in employment.
- Volunteer work
- - employment that is unpaid.
W
- Wage level and conditions
- - the current relationship of the consumer's wage and conditions to an award/agreement wage.
- Weeks of operation
- - the number of weeks during the 2003-04 financial year that a service operated.
- Work experience
- - a consumer who is undertaking paid or unpaid work experience or a work trial.
- Worker
- - a consumer who is undertaking paid employment.
- Worker meeting worker target
- - a consumer who has worked in paid employment of eight hours per week or more, for at least three months.
- Worker not meeting worker target
- - a consumer who has worked in paid employment for less than three months and/or who worked less than eight hours per week.
- Working
- - currently employed.
- Working (Support needs indicator)
- - undertaking actions, behaviours and tasks needed to obtain and retain paid employment.
- Workplace agreement
- - a written agreement between an employer and employee about the employee's terms and conditions of employment.
X
Y
- Youth Allowance
- - a type of benefit paid by the Australian Government to persons meeting the payment criteria.
Last updated: