Australian Government Disability Services Census Report 2006
1. Executive summary
- 1.1 Machinery of government changes
- 1.2 Commonwealth State Territory Disability Agreement
- 1.3 Summary of the Disability Services Census
- 1.4 Major findings
1.1 Machinery of government changes
In October 2004, a number of machinery of government (MoG) changes were made to the structure and responsibilities of Australian Government departments. These changes, which became effective on 1 December 2004, included the transfer of responsibility of open employment services to the Department of Employment and Workplace Relations. Responsibility for supported employment services remained with the Department of Family and Community Services, and dual open/supported employment services ceased to exist. Then the department's name was changed on 27 January 2006 from the Department of Family and Community Services (FaCS) to the Department of Families, Community Services and Indigenous Affairs (FaCSIA) with the move of the Office of Indigenous Policy Coordination (OIPC) to the portfolio. From 1 July 2006, open employment services were renamed the Disability Employment Network.
[ Return to Top Return to Section ]
1.2 Commonwealth State Territory Disability Agreement
The Commonwealth State Territory Disability Agreement (CSTDA) provides the national framework for providing government services for people with disability. There have been three agreements to date (the first in 1991) and, under the agreement, the Australian Government is responsible for specialist disability employment services. State and territory governments are responsible for accommodation support, community support, community access and respite services. Responsibility for advocacy, information and print disability services is shared between the Australian, state and territory governments.
Under the CSTDA, only the Australian Government provides funding for specialist disability employment services. This funding provides people with disability access to vocational programs and employment, thereby promoting economic and social participation and choice for people with disability.
The current CSTDA (through the National Minimum Data Set) requires the Australian and state/territory governments to collect disability program, service and consumer data annually. The Australian Government fulfils its obligations by collecting data through its annual Disability Services Census. This report details the findings from the 2005–06 census collection.
This report provides national data on Australian Government funded specialist services for people with disability provided under the CSTDA. It includes data on open employment services for which, as mentioned in Section 1.1, policy responsibilities lie with the Department of Employment and Workplace Relations. Data are provided on people with disability (consumers) who used specialist disability employment services during 2005–06. In addition to the comprehensive information on specialist disability employment services and their consumers, the report also provides information on other Australian Government funded disability services: respite, advocacy, information and print disability.
The purpose of this report is to provide detailed information on Australian Government funded specialist disability services and their consumers for government agencies, disability ministers, policy makers, the disability sector and the public.
[ Return to Top Return to Section ]
1.3 Summary of the Disability Services Census
This report has been written in five separate but related chapters. The first, the executive summary, provides a brief outline of the layout and major findings of the current report. The second chapter provides a brief history of the Disability Services Census collection, while the third gives detailed information on disability service outlets and their staff including the number of outlets and the services provided, as well as staff numbers, hours worked and other information.
The largest component of the report, the fourth chapter, provides information on consumers of Australian Government funded specialist disability employment services. Demographic data, including gender, age, Indigenous status, country of birth, main language spoken at home, need for interpreter and transport requirements, are provided. The relationship between some of these data and service outlet type are also detailed. Information about consumers' primary disability, need for assistance, residential setting, living arrangements and income are also included. Employment characteristics make up the last section of this chapter.
Chapter five provides a breakdown of data across Australian jurisdictions. Information is provided for each jurisdiction and covers service outlet and staff numbers, consumer demographics and specific employment–related data. The report also includes a reference list, glossary of terms and appendices. Tables appearing in the appendices are labelled with an A (e.g. Table 1A).
[ Return to Top Return to Section ]
1.4 Major findings
There were 868 Australian Government funded disability service outlets operational during 2005–06, an increase of 14 outlets compared with 2004–05. Disability employment service outlets accounted for the majority (84.2%; 731 out of 868) of all service outlets.
Staff in Australian Government funded disability services in 2005–06 worked a total of 288,093 hours a week. This represents an increase of 10,597 (3.9%) hours from the 277,496 hours reported in 2004–05. With regard to full-time equivalent (FTE) hours, approximately 7,581 FTE staff worked in disability services in 2005–06, an increase of 278 FTE staff compared with 2004–05.
Employment service staff accounted for the majority of staff hours (90.3%). Total weekly hours worked by employment service staff increased from 233,677 in 2004–05 to 259,944 in 2005–06.
There were 56,942 consumers receiving support from a disability employment service outlet on 30 June 2006, an increase of 8.1% (4,249) compared with 30 June 2005.
In total, there were 77,313 consumers assisted by Australian Government funded disability employment services in 2005–06, which is an increase of 13.1% on the 68,370 reported in 2004–05. Of these, 48,817 (63.1%) were male and 28,448 (36.8%) were female. Most spoke English as their main language. Across the two employment service types, 56,064 consumers accessed open employment services and 21,249 accessed supported employment services.
Most other data are similar across 2004–05 and 2005–06. For example, the proportion of consumers born overseas and the proportion whose main language is not English has remained stable over time. Similarly, the proportion of Indigenous consumers has remained steady, as has the income earned by working employment service consumers.
2. History of the Disability Services Census
The Australian Government Disability Services Census was developed to provide comprehensive information on Australian Government funded specialist disability employment services and their consumers.
In March 1991, a survey was conducted to assess all Australian Government funded disability services. This survey was funded through the then Department of Health, Housing and Community Services. The final report summarised data collected on disability employment services between January and June 1991 (Department of Health, Housing and Community Services, 1991).
A decision at the April 1993 meeting of the Working Party to the Review of Funding Arrangements for the Disability Services Program instigated a review of the 1991 census. As a result of this review, pilot testing was conducted in July 1993 to improve the census collection. The resultant report was more comprehensive than its predecessor (Department of Human Services and Health, 1994).
The 1995 report provided data for the period 1 October 1994 to 30 September 1995. This report signified the first instance of reporting on data other than those related to disability employment services. Specifically, data on print disability, advocacy, information and disability employment services were included in the 1995 report (Department of Health and Family Services, 1997).
While the 1997 report remained relatively unchanged compared to its immediate predecessor, it signified the first year that (i) the Department of Family and Community Services became responsible for the census collection and report, and (ii) the report became an annual publication (Department of Family and Community Services, 1998). Since that time, the department has continued to have responsibility for collecting and reporting census data.
In 1998, the Accessibility/Remoteness Index of Australia (ARIA) was included in the census collection to provide updated information on service accessibility. For the 1998 report, data were collected for the period 20 October 1997 to 19 October 1998 (Department of Family and Community Services, 1999). There were no changes made to the 1999 census collection, where data were collected for the period 25 May 1998 to 26 May 1999 (Department of Family and Community Services, 2000).
The 2000 report included two major data additions. Full financial year data was published for the first time, as was information on respite services (Department of Family and Community Services, 2002). These data have been reported in subsequent reports. Between 1995 and 2001, the report was titled Commonwealth Disability Services Census. In 2002, the title changed to reflect a name change from Commonwealth to Australian Government and has since been referred to as the Australian Government Disability Services Census.
Very few amendments were made to the report between 1998 and 2003. While the 2003 report provided some attempt at cross year comparison (Department of Family and Community Services, 2005a), the 2004 report presented more in-depth analysis than previous reports (Department of Family and Community Services, 2005b).
The machinery of government (MoG) changes, which came into effect on 1 December 2004, have led to changes in the way data were analysed and presented in the 2005 report. For example, after 1 December 2004 data did not exist for dual open/supported employment services (Department of Families, Community Services and Indigenous Affairs 2006).
The 2006 Disability Services Census collection reflects a significant departure from previous years with the Department of Employment and Workplace Relations taking responsibility for the collection of open employment services data in line with the 2004 MoG changes, and an attempt to reduce the workload of service providers through the use of administrative data from both the Department of Employment and Workplace Relations and the now Department of Families, Community Services and Indigenous Affairs (FaCSIA). This report further reflects 2004 MoG changes with the absence of dual open/supported employment service data, which are now funded separately as open employment services and supported employment services.
This report is written in a similar manner to the 2004 and 2005 reports and with the aim of continuing to provide meaningful information to disability ministers, policy makers, researchers, the disability sector and the public.
3. Disability service outlets and staff profiles
This chapter provides information on all types of Australian Government funded disability services, as well as the distribution of these service types within each jurisdiction. Specific information is provided on specialist disability employment services, including the number and per cent of service outlets operational during 2005– 06. The final section provides data on disability employment service staff, including the hours they worked and their role in service provision.
[ Return to Top Return to Section ]
3.1 Disability service outlet profiles
3.1.1 Number of disability service outlets
There were 868 Australian Government funded disability service outlets operational in 2005–06, an increase of 14 outlets from 2004–05 (FaCSIA 2006a).
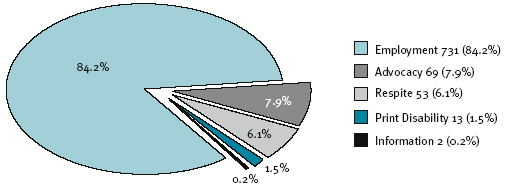
Figure 3.1 shows the number and frequency distribution of outlets by service type for the 868 outlets. Of all service outlets, the vast majority (731; 84.2%) were disability employment services. The remaining 137 service outlets comprise advocacy (69; 7.9%), respite (53; 6.1%), print disability (13; 1.5%) and information (2; 0.2%) services.
Figure 3.1: Number (and per cent ) of disability service outlets by type of service, 2005–06
Information about disability service outlets across Australian jurisdictions is shown in Table 3.1. New South Wales (290) had the greatest number of service outlets, followed by Victoria (192) then Queensland (136).
Across all jurisdictions the majority of disability service outlets were for employment services. Respite services accounted for over 10% of disability services in Western Australia, the Australian Capital Territory and Northern Territory, which is higher than the proportion reported for other jurisdictions. Similarly, Victoria, the Australian Capital Territory and Northern Territory had higher proportions of advocacy services than other jurisdictions. New South Wales and the Australian Capital Territory provided a nationwide disability information service. The 13 state-wide print disability services were provided by all jurisdictions except the Northern Territory.
| Jurisdiction | Employment | Respite | Print Disability | Advocacy | Information | Total |
|---|---|---|---|---|---|---|
| NSW | 250 | 17 | 4 | 18 | 1 | 290 |
| 86.2% | 5.9% | 1.4% | 6.2% | 0.3% | 100.0% | |
| Vic | 163 | 5 | 3 | 21 | - | 192 |
| 84.9% | 2.6% | 1.6% | 10.9% | 100.o% | ||
| Qld | 117 | 10 | 1 | 8 | - | 136 |
| 86.0% | 7.4% | 0.7% | 5.9% | 100.o% | ||
| WA | 63 | 9 | 2 | 8 | - | 82 |
| 76.8% | 11.0% | 2.4% | 9.8% | 100.0% | ||
| SA | 82 | 4 | 1 | 6 | - | 93 |
| 88.2% | 4.3% | 1.1% | 6.5% | 100.0% | ||
| Tas | 31 | 3 | 1 | 3 | - | 38 |
| 81.6% | 7.9% | 2.6% | 7.9% | 100.0% | ||
| ACT | 14 | 2 | 1 | 2 | 1 | 20 |
| 70.0% | 10.0% | 5.0% | 10.0% | 5.0% | 100.0% | |
| NT | 11 | 3 | - | 3 | - | 17 |
| 64.7% | 17.6% | 17.6% | 100.0% | |||
| Total | 731 | 53 | 13 | 69 | 2 | 868 |
| 84.2% | 6.1% | 1.5% | 7.9% | 0.2% | 100.0% |
3.1.2 Location of disability service outlets
The Australian Bureau of Statistics Australian Standard Geographical Classification Remoteness Areas (RA) was used to assess the location of disability service outlets. The postcode of each service outlet location was coded into one of five RA categories: major city of Australia, inner regional Australia, outer regional Australia, remote Australia and very remote Australia.
Of the 868 disability service outlets throughout Australia, over half (491; 56.6%) were located in major cities (Table 3.2). Inner and outer regional areas accounted for approximately 40% of all outlets (348; 40.0%), while remote and very remote areas represented the smallest proportion (3.4%) with 29 disability service outlets.
With the exception of respite services, all other service types had over half of their service outlets located in major cities. The two information service outlets were located in major cities, and the 13 state-wide print disability services were located in major cities and inner regional areas. Employment and respite services appeared to be well represented across all location types, in relative terms.
| Service type | Major city | Inner regional |
Outer regional |
Remote | Very remote |
Total |
||
|---|---|---|---|---|---|---|---|---|
| No. | % | |||||||
| Employment | 55.5% | 27.6% | 13.8% | 2.3% | 0.7% | 731 | 100.0% | |
| Respite | 45.3% | 28.3% | 18.9% | 5.7% | 1.9% | 53 | 100.0% | |
| Print disability | 92.3% | 7.7% | 0.0% | 0.0% | 0.0% | 13 | 100.0% | |
| Advocacy | 68.1% | 21.7% | 5.8% | 4.3% | 0.0% | 69 | 100.0% | |
| Information | 100.0% | 0.0% | 0.0% | 0.0% | 0.0% | 2 | 100.0% | |
| Total | No. | 491 | 233 | 115 | 23 | 6 | 868 | |
| % | 56.6% | 26.8% | 13.2% | 2.6% | 0.7% | 100.0% | ||
3.1.3 Number of disability employment service outlets
Box 1.1 Disability employment service types
Before the machinery of government changes on 1 December 2004, disability employment services were separated into three service types: open employment services, supported employment services and open/supported employment services. Open/supported employment services ceased to exist from 1 December 2004 and commenced operation as either an open or supported employment outlet.
In addition, as a part of the Security, Quality Services and Choices for People with Disabilities Package announced in April 2004, some supported employment services also provide Targeted Support. Targeted Support provides people with disability who have been assessed as having very low work productivity and have chosen to leave employment with structured training and support to work towards social and community participation, or opportunities to develop skills or retrain for paid employment. Data on Targeted Support are reported under the supported employment service type in this report.
- Open employment services – services that assist people with a disability to work in the open labour market. They can also assist people with a disability in transferring from special education or employment in a supported work setting, to paid employment in the open labour market.
- Supported employment services (or business services) – services that directly provide employment and support to people with a significant disability.
There were 334 open employment service outlets and 397 supported employment services outlets in 2005–06 (Table 3.3), compared with 297 open employment and 378 supported service outlets in 2004–05 (FaCSIA 2006). New South Wales had the most outlets for each employment service type. The second highest number of employment service outlets was found in Victoria (163), followed by Queensland (117) and Western Australia (63). The Northern Territory (11) and Australian Capital Territory (14) had the lowest and second lowest number of open and supported employment service outlets. These data are reflective of population size differences across jurisdictions.
| Jurisdiction | Open | Supported | Total |
|---|---|---|---|
| NSW | 102 | 148 | 250 |
| 40.8% | 59.2% | 100.0% | |
| Vic | 65 | 98 | 163 |
| 39.9% | 60.1% | 100.0% | |
| Qld | 70 | 47 | 117 |
| 59.8% | 40.2% | 100.0% | |
| WA | 33 | 30 | 63 |
| 52.4% | 47.6% | 100.0% | |
| SA | 37 | 45 | 82 |
| 45.1% | 54.9% | 100.0% | |
| Tas | 15 | 16 | 31 |
| 48.4% | 51.6% | 100.0% | |
| ACT | 6 | 8 | 14 |
| 42.9% | 57.1% | 100.0% | |
| NT | 6 | 5 | 11 |
| 54.5% | 45.5% | 100.0% | |
| Total | 334 | 397 | 731 |
| 45.7% | 54.3% | 100.0% |
3.1.4 Location of disability employment service outlets
Table 3.4 provides the percentage distribution of open and supported employment service outlets for each location. The number of outlets was highest in major cities for each employment service type. More specifically, near equal proportions of open employment service outlets (186 or 55.7%) and supported employment service outlets (220 or 55.4%) were located in major cities.
| Service type | Major city | Inner regional |
Outer regional |
Remote | Very remote |
Total |
||
|---|---|---|---|---|---|---|---|---|
| No. | % | |||||||
| Open | 55.7% | 26.9% | 13.5% | 3.3% | 0.6% | 334 | 100.0% | |
| Supported | 55.4% | 28.5% | 13.9% | 1.5% | 0.8% | 397 | 100.0% | |
| Total | No. | 406 | 202 | 101 | 17 | 5 | 731 | |
| % | 55.5% | 27.6% | 13.8% | 2.3% | 0.7% | 100.0% | ||
The next most common location across both employment service types was inner regional areas with 202 employment service outlets (27.6%). A significant proportion (13.8%; 101) of employment service outlets was located in outer regional areas and a small proportion (3.0%; 22) of employment service outlets was located in remote areas and very remote areas.
Table 3.5 provides the proportion of open and supported employment service outlets located within the five location categories. Of all the employment service outlets located in major cities, over half (54.2%) were supported employment outlets and 45.8% were open employment outlets. Similarly, there was a higher proportion of supported employment outlets across inner regional, outer regional and very remote areas than open employment service outlets. In remote areas, there were more open employment service outlets than supported employment service outlets.
| Service type | Major city | Inner regional | Outer regional | Remote | Very remote | |
|---|---|---|---|---|---|---|
| Open | 45.8% | 44.6% | 44.6% | 64.7% | 40.0% | |
| Supported | 54.2% | 55.9% | 54.5% | 35.3% | 60.0% | |
| Total | No. | 406 | 202 | 101 | 17 | 5 |
| % | 100.0% | 100.0% | 100.0% | 100.0% | 100.0% | |
[ Return to Top Return to Section ]
3.2 Hours and weeks of outlet operation
This section of the report provides details about the average number of hours a week and the average numbers of weeks a year that outlets had operated during 2005–06.
3.2.1 Average outlet hours of operation per day
Table 3.6 provides information on the average number of hours disability service outlets were operational per day in 2005–06. Of the 829 disability service outlets that provided information relating to operating hours, 793 outlets (95.7%) were operating for more than seven hours a day.
For all disability service types except information services, the most commonly reported number of hours provided was between seven to eight hours a day. A further 99 disability service outlets (12%) reported operating between eight to 24 hours a day with the majority of these being employment services. Respite services was the only disability service type to report operating 24 hours a day.
| Service type | Less than 7 hours |
7 to 8 hours | More than 8, but less than 24 hours |
24 hours | Not stated | Total |
|---|---|---|---|---|---|---|
| Respite | 1 | 30 | 8 | 12 | 2 | 53 |
| Employment | 32 | 581 | 82 | 0 | 36 | 731 |
| Advocacy | 0 | 64 | 5 | 0 | 0 | 69 |
| Information | 0 | 1 | 1 | 0 | 0 | 2 |
| Print disability | 3 | 6 | 3 | 0 | 1 | 13 |
| Total | 36 | 682 | 99 | 12 | 39 | 868 |
3.2.2 Average days of operation per week
Table 3.7 shows that of the 830 outlets that provided information on days of operation per week in 2005–06, 763 outlets (91.9%) reported opening five days a week and 37 outlets (4.5%) reported opening seven days a week. Proportionally, over a quarter (27.5%) of respite services and 3% of employment services reported operating seven days a week. The proportion of disability service outlets which reported operating five days a week ranged between 70.6% (respite services) and 100% (information services) within each service type.
| Service type | 1 day | 2 days | 3 days | 4 days | 5 days | 6 days | 7 days | Not stated | Total |
|---|---|---|---|---|---|---|---|---|---|
| Respite | 0 | 1 | 0 | 0 | 36 | 0 | 14 | 2 | 53 |
| Employment | 0 | 1 | 4 | 6 | 652 | 11 | 22 | 35 | 731 |
| Advocacy | 1 | 0 | 0 | 5 | 62 | 0 | 1 | 0 | 69 |
| Information | 0 | 0 | 0 | 0 | 2 | 0 | 0 | 0 | 2 |
| Print disability | 0 | 0 | 1 | 0 | 11 | 0 | 0 | 1 | 13 |
| Total | 1 | 2 | 5 | 11 | 763 | 11 | 37 | 38 | 868 |
3.2.3 Average number of weeks of operation a year
Of the 830 outlets which provided information on weeks of operation in the 2005–06 year, the vast majority (98.5% or 817 out of 830) reported operating for at least 48 weeks in the year, with 60.2% (499) reported remaining open for the full 52 weeks. While employment, respite and information services were most likely to report operating for 52 weeks in the year, print disability and advocacy services were most likely to report operating between 48 and 51 weeks in the year.
| Service type | 1 to 39 weeks | 40 to 47 weeks | 48 to 51 weeks | 52 weeks | Not stated | Total |
|---|---|---|---|---|---|---|
| Respite | 1 | 0 | 2 | 48 | 2 | 53 |
| Employment | 3 | 7 | 269 | 417 | 35 | 731 |
| Advocacy | 0 | 1 | 37 | 31 | 0 | 69 |
| Information | 0 | 0 | 0 | 2 | 0 | 2 |
| Print disability | 1 | 0 | 10 | 1 | 1 | 13 |
| Total | 5 | 8 | 318 | 499 | 38 | 868 |
[ Return to Top Return to Section ]
3.3 Staff profile
Staff in all Australian Government funded disability services in 2005–06 worked a total of 288,093 hours a week. This represents an increase of 10,597 (3.9%) hours from the 277,496 hours reported in 2004–05. These weekly staff hours equate to approximately 7,581 full–time equivalent (FTE) staff across Australia, which is 278 more FTE staff nationally in 2005–06 than 2004–05.
Most staff hours were consumed by disability employment services, with 259,944 (6,762 FTE staff ) hours a week being worked by staff in employment service outlets in 2005–06. Data on staff hours in the other service types are provided in Table 1A.
Across all disability service types, direct staff hours accounted for the majority of total staff hours. For supported employment services, 69.7% of total staff hours were direct service provision in 2005–06, compared with 72.5% in 2004–05. For open employment services, the proportion of direct staff hours increased slightly from 66.6% in 2004–05 to 71.8% in 2005–06. See Table 2A for more detailed data on direct, indirect and total staff hours in 2005–06.
In 2005–06, 214 outlets (24.7%) had one to two FTE staff, 264 (30.5%) had three to five FTE staff, 220 (25.4%) had six to 10 FTE staff, and 170 (19.6%) had 11 or more FTE staff. These numbers are similar to those reported in 2004–05.
Table 3.9 provides the number and per cent of staff who worked in direct or indirect support roles in 2005–06. In each service type, the majority of staff worked in direct support roles, with over 70% of all staff working directly with people with disability. Print disability services had the highest proportion of staff working in direct roles, and the proportion of staff working in direct service provision ranged from 70.0 to 81.1% for the other four disability service types.
Table 3.9 also shows that, across disability service type, approximately 30% of staff did not work directly with people with disability, but worked in positions such as clerical work, training personnel, and belonging to boards/committees. These data are generally comparable to those reported for 2004–05.
| Service type | Direct | Indirect | Total |
|---|---|---|---|
| Employment | 4,777 | 1,984 | 6,762 |
| 70.7% | 29.3% | 100.0% | |
| Respite | 202 | 84 | 286 |
| 70.7% | 29.3% | 100.0% | |
| Print disability | 243 | 29 | 272 |
| 89.5% | 10.5% | 100.0% | |
| Advocacy | 177 | 76 | 253 |
| 70.0% | 30.0% | 100.0% | |
| Information | 8 | 2 | 9 |
| 81.1% | 18.9% | 100.0% | |
| Total | 5,407 | 2,174 | 7,581 |
| 71.3% | 28.7% | 100.0% |
4. Disability employment service consumer profile
- 4.1 Consumer demographic information
- 4.2 Consumers and disability employment service types
- 4.3 Primary disability of consumers across service types
- 4.4 Need for assistance
- 4.5 Residential setting
- 4.6 Living arrangements
- 4.7 Income
- 4.8 Employment characteristics
Consumer profile data are collected and reported in two ways. The first provides data only on people with disability who were registered and receiving assistance from a specialist disability employment service outlet on 30 June 2006. These data are referred to as consumers 'on the books'. The second provides data on all people with disability who accessed disability employment services during 2005–06.
This chapter of the report provides details predominantly on the full financial year data for 2005–06. Consumer 'on the books' data are reported in sub-section 4.8, because full financial year data are not collected for items covered in that sub-section. Further information regarding consumers 'on the books' can be accessed on the Department of Families, Community Services and Indigenous Affairs (FaCSIA) website at http://www.facsia.gov.au/dscensus.
There were 56,942 consumers 'on the books' in disability employment services on 30 June 2006, which is an increase of 4,249 (8.1%) compared with the year before. A further 20,389 consumers accessed disability employment services sometime during 2005–06, bringing the total number of consumers assisted to 77,313. This is an increase of 8,943 consumers on the 68,370 reported for 2004–05.
[ Return to Top Return to Section ]
4.1 Consumer demographic information
4.1.1 Gender
Consistent with previous years, in 2005–06, there were many more male consumers than female consumers accessing disability employment services, 48,817 (63.1%) and 28,448 (36.8%) respectively.
| <16 | 16-19 | 20-24 | 25-29 | 30-39 | 40-49 | 50-59 | 60-64 | 65+ | Not stated | Total | |
|---|---|---|---|---|---|---|---|---|---|---|---|
| Male | 219 | 5,416 | 8,232 | 6,106 | 11,142 | 9,321 | 5,625 | 1,165 | 338 | 1,253 | 48,817 |
| 78.5% | 68.1% | 63.3% | 63.5% | 64.1% | 59.8% | 59.7% | 69.6% | 79.7% | 63.2% | 63.1% | |
| Female | 60 | 2,533 | 4,761 | 3,512 | 6,241 | 6,252 | 3,803 | 508 | 86 | 692 | 28,448 |
| 21.5% | 31.9% | 36.6% | 36.5% | 35.9% | 40.1% | 40.3% | 30.4% | 20.3% | 34.9% | 36.8% | |
| Not stated | 0 | 0 | 5 | 0 | 3 | 2 | 0 | 0 | 0 | 38 | 48 |
| 0.0% | 0.0% | 0.0% | 0.0% | 0.0% | 0.0% | 0.0% | 0.0% | 0.0% | 1.9% | 0.1% | |
| Total | 279 | 7,949 | 12,998 | 9,618 | 17,386 | 15,575 | 9,428 | 1,673 | 424 | 1,983 | 77,313 |
4.1.2 Age
In 2005–06, a large number of consumers accessing disability employment services were aged between 20 to 24 years (12,998), and 30 to 49 years (32,961), and a much lower number of consumers were less than 16 years of age (279) and greater than 65 years of age or older (424). The distribution of consumers across age groups does not differ significantly to that reported in 2004–05.
4.1.3 Relationship between gender and age
As in previous years, in 2005–06, there were more males than females accessing disability employment services in all age groups. This gender difference was most noticeable in the youngest age group (less than 16 years of age), where males accounted for 78.5% of all consumers.
4.1.4 Indigenous status
Of the 77,313 consumers assisted by disability employment services in 2005–06, 1,735 (2.3%) were identified as being of Aboriginal origin, 23 (0.1%) of Torres Strait Islander descent, and 18 (0.1%) of Aboriginal and Torres Strait Islander origin. See Table 3A for more information about the Indigenous origin of consumers.
4.1.5 Country of birth
Country of birth data were mapped to the Australian Bureau of Statistics' Standard Australian Classification of Countries (SACC). Countries were then classified into four broad categories based on their English speaking status: Australia, other English-speaking countries, non-English speaking countries, and not known. The group of other English-speaking countries includes Canada, Ireland, New Zealand, South Africa, the United Kingdom and United States of America.
In 2005–06, the majority of consumers accessing disability employment services were born in Australia (64,846; 83.9%). An additional 1,708 (2.2%) consumers were born in other English-speaking countries and 7,839 (10.1%) were born in non–English speaking countries. Country of birth data were not available for 2,920 (3.8%) consumers. See Table 4A for more information about the country of birth of consumers.
4.1.6 Main language spoken
Table 4.2 provides information on the main language spoken at home by consumers accessing disability employment services. This table shows that the majority of consumers in 2005–06 spoke English at home (96.3%). Italian was the most common language other than English spoken at home (206; 0.3%). These data are comparable to that reported in 2004–05. See Table 5A for more detailed information about the main language spoken at home by consumers.
| Language | No. | % |
|---|---|---|
| English | 74,451 | 96.3 |
| Italian | 206 | 0.3 |
| Greek | 131 | 0.2 |
| Vietnamese | 156 | 0.2 |
| Chinese | 96 | 0.1 |
| Arabic/Lebanese | 70 | 0.1 |
| German | 6 | 0.0 |
| Spanish | 59 | 0.1 |
| Other language | 1,411 | 1.8 |
| Not known | 727 | 0.9 |
| Total | 77,313 | 100.0 |
4.1.7 Need for interpreter
In 2005–06, a small number of consumers overall accessing disability employment services needed interpreter service assistance, with 191 (0.3%) needing interpreter service assistance for a spoken language other than English and 802 (1.0%) needed such assistance for non-spoken communication. Need for interpreter service data were not available for 743 (1.0%) consumers. See Table 6A for additional information on the need for interpreters by consumers.
[ Return to Top Return to Section ]
4.2 Consumers and disability employment service types
Of the 77,313 consumers accessing disability employment service in 2005–06, the majority were assisted by open employment services (56,064; 72.5%). Supported employment services assisted 21,249 (27.5%) consumers. This breakdown is comparable to that reported in 2004–05. See Table 7A for more detailed information.
On 30 June 2006, there were 56,942 consumers 'on the books' in disability employment services. Of these, 39,381 (69.2%) were in open employment services and 17,561 (30.8%) were in supported employment services.
4.2.1 Gender and service use
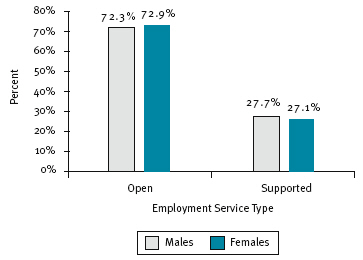
Figure 4.1 provides the per cent of male and female consumers across the two disability employment service types for 2005–06. This figure shows that there were no significant gender differences in the proportion of men and women using the different service types. See Table 7A for further information.
Figure 4.1: Per cent of males and females across disability employment service type, 2005–06
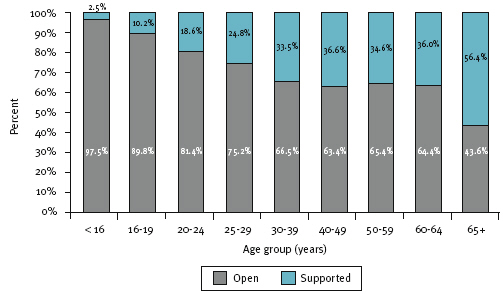
4.2.2 Age and service use
In 2005–06, there were differences in disability employment service type use by age (see Figure 4.2). The use of open employment services decreased progressively with age until the 40 to 49 year age group. For example, of all consumers aged 16 to 19 years, 89.8% accessed open employment services, whereas the proportion decreased to 63.4% for consumers aged 40 to 49 years. The proportion of consumers aged between 40 to 49 and 60 to 64 years who accessed open employment services remained fairly steady, and then decreased markedly in the over 64 years of age group. See Figure 4.2 for relevant percentages.
| <16 | 16-19 | 20-24 | 25-29 | 30-39 | 40-49 | 50-59 | 60-64 | 65+ | Not stated | Total | |
|---|---|---|---|---|---|---|---|---|---|---|---|
| Open | 272 | 7,135 | 10,575 | 7,235 | 11,569 | 9,871 | 6,168 | 1,070 | 185 | 1,984 | 56,064 |
| 97.5% | 89.8% | 81.4% | 75.2% | 66.5% | 63.4% | 65.4% | 64.0% | 43.6% | 100.0% | 72.5% | |
| Supported | 7 | 813 | 2,422 | 2,384 | 5,817 | 5,704 | 3,260 | 603 | 239 | 0 | 21,249 |
| 2.5% | 10.2% | 18.6% | 24.8% | 33.5% | 36.6% | 34.6% | 36.0% | 56.4% | 0.0% | 27.5% | |
| Total | 279 | 7,948 | 12,997 | 9,619 | 17,386 | 15,575 | 9,428 | 1,673 | 424 | 1,984 | 77,313 |
In contrast, older consumers tended to access supported employment services more often than younger consumers. Of the disability employment services accessed by consumers aged 16 to 19 years, only 2.5% were in supported employment services, whereas 56.4% of services accessed by consumers aged over 64 years were supported employment services. The same pattern of stability across the 40 to 49 year age group through to the 60 to 64 year age group noted for open employment services was evident in supported employment services. These trends do not differ considerably to those reported for 2004–05.
Figure 4.2: Per cent of consumers by disability employment service type and age group, 2005–06
4.2.3 Jurisdictions and service use
There were differences across jurisdictions in the pattern of disability employment service use and in the numbers of consumers in 2005–06. The total number of consumers in each jurisdiction was generally related to total population of the jurisdictions. New South Wales had the highest number of consumers (23,396; 30.3% of national consumers), followed by Victoria (20,883; 27.0%), then Queensland (14,930; 19.3%) and Western Australia (7,542; 9.8%) (Table 4.4).
Consistent with previous years, in 2005–06 open employment services provided services to more consumers than did supported employment services across all states and territories. The proportion of consumers of open employment services ranged from 56.9% in South Australia, to 84.5% in Queensland.
| Open | Supported | Total | |
|---|---|---|---|
| NSW | 15,384 | 8,012 | 23,396 |
| 65.8% | 34.2% | 100.0% | |
| Vic | 16,144 | 4,738 | 20,882 |
| 77.3% | 22.7% | 100.0% | |
| Qld | 12,620 | 2,310 | 14,930 |
| 84.5% | 15.5% | 100.0% | |
| WA | 5,281 | 2,261 | 7,542 |
| 70.0% | 30.0% | 100.0% | |
| SA | 3,939 | 2,977 | 6,916 |
| 57.0% | 43.0% | 100.0% | |
| Tas | 1,593 | 612 | 2,205 |
| 72.2% | 27.8% | 100.0% | |
| ACT | 763 | 219 | 982 |
| 77.7% | 22.3% | 100.0% | |
| NT | 320 | 120 | 440 |
| 72.7% | 27.3% | 100.0% | |
| Not known | 20 | 0 | 20 |
| 100.0% | 0.0% | 100.0% | |
| Total | 56,064 | 21,249 | 77,313 |
| 72.5% | 27.5% | 100.0% |
[ Return to Top Return to Section ]
4.3 Primary disability of consumers across service types
This section of the report provides information about disability type reported for consumers of disability employment services during 2005–06. Data are provided for all consumers (see Figure 4.3), and in separate tables for the two employment service types (see Tables 4.5 through 4.7).
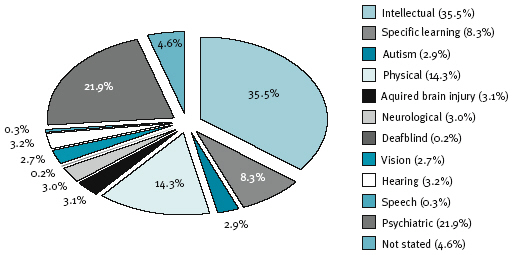
Figure 4.3 provides information on the proportion of consumers of disability employment services by primary disability. This figure shows that the most common primary disability reported for consumers was intellectual disability. The least commonly reported were speech and deafblind disabilities. These trends are the same as those reported in 2004–05.
Figure 4.3 Per cent of consumers across primary disability groups, 2005–06
4.3.1 Primary disability of open employment service consumers
Table 4.5 provides the number and per cent of consumers of open employment services by primary disability. This table shows that intellectual and psychiatric disabilities were the two most commonly reported primary disabilities among consumers of open employment services in 2005–06. Together, they constituted nearly half (47.9%) of the open employment service consumer population. Consumers with physical disability made up the third largest group, while speech and deafblind disabilities were the least common primary disabilities among open employment service consumers.
| Primary disability | No. | % |
|---|---|---|
| Psychiatric | 14,546 | 25.9 |
| Intellectual | 12,357 | 22.0 |
| Physical | 9,652 | 17.2 |
| Specific learning | 6,145 | 11.0 |
| Hearing | 2,238 | 4.0 |
| Neurological | 1,919 | 3.4 |
| Aquired brain injury | 1,798 | 3.2 |
| Autism | 1,780 | 3.2 |
| Vision | 1,759 | 3.1 |
| Speech | 225 | 0.4 |
| Deafblind | 99 | 0.2 |
| Not stated | 3,546 | 6.3 |
| Total | 56,064 | 100.0 |
4.3.2 Primary disability of supported employment service consumers
Table 4.6 shows that during 2005–06, intellectual disability (71.2%) was the most commonly reported primary disability group for supported employment service consumers, followed by psychiatric disability (11.3%) and physical disability (6.6%). Speech and deafblind disabilities were the least common primary disabilities among supported employment service consumers.
| Primary disability | No. | % |
|---|---|---|
| Intellectual | 15,124 | 71.2 |
| Psychiatric | 2,397 | 11.3 |
| Physical | 1,402 | 6.6 |
| Acquired brain injury | 597 | 2.8 |
| Neurological | 418 | 2.0 |
| Autism | 456 | 2.1 |
| Vision | 295 | 1.4 |
| Specific learning | 273 | 1.3 |
| Hearing | 202 | 1.0 |
| Deafblind | 47 | 0.2 |
| Speech | 38 | 0.2 |
| Total | 21,249 | 100.0 |
4.3.3 Comparison of primary disability across service types
Reported primary disability groups varied somewhat between service types in 2005–06. The most frequently reported primary disability for open employment consumers was psychiatric disability, followed by intellectual disability. In contrast the most common disability for consumers of supported employment was intellectual disability, followed by psychiatric disability. For consumers of both services, physical disability was the third most common primary disability group.
The distribution of consumers across disability groups differed between open and supported services. The proportion of supported employment service consumers (71.2%) reporting intellectual disability as their primary disability was much higher than that of open employment service consumers (22.0%). The proportions of consumers with psychiatric disability as their primary disability were higher in open employment services (25.9%) than in supported employment services (11.3%). Supported employment services had a much lower proportion of consumers (6.6%) reporting physical disability as their primary disability, compared to open employment services (17.2%).
See Table 8A for information on secondary disabilities across employment service type and primary disability group.
[ Return to Top Return to Section ]
4.4 Need for assistance
Data on consumers' need for assistance in nine main life areas are presented in Table 4.7. The table shows that the majority of consumers accessing disability employment services in 2005–06 did not require any assistance with self-care (57.7%). Assistance in the areas of working, learning and interpersonal interactions however, was required for a large number of consumers. Further details are provided in Table 9A.
| Life areas |
Frequency of support or assistance |
Total | ||||
|---|---|---|---|---|---|---|
| Always needs help |
Sometimes needs help |
No help, but uses aids |
No help and no aids |
Not known |
||
| Self-care | 2,977 | 18,427 | 2,277 | 44,573 | 9,059 | 77,313 |
| 3.9% | 23.8% | 2.9% | 57.7% | 11.7% | 100.0% | |
| Mobility | 4,937 | 16,774 | 3,765 | 37,123 | 14,714 | 77,313 |
| 6.4% | 21.7% | 4.9% | 48.0% | 19.0% | 100.0% | |
| Communication | 5,394 | 30,627 | 1,378 | 25,699 | 14,215 | 77,313 |
| 7.0% | 39.6% | 1.8% | 33.2% | 18.4% | 100.0% | |
| Interpersonal interactions and relationships |
7,177 | 37,212 | 1,029 | 17,181 | 14,714 | 77,313 |
| 9.3% | 48.1% | 1.3% | 22.2% | 19.0% | 100.0% | |
| Learning | 9,467 | 39,459 | 1,094 | 13,008 | 14,285 | 77,313 |
| 12.2% | 51.0% | 1.4% | 16.8% | 18.5% | 100.0% | |
| Education | 11,687 | 32,017 | 1,378 | 14,483 | 17,748 | 77,313 |
| 15.1% | 41.4% | 1.8% | 18.7% | 23.0% | 100.0% | |
| Community (civic) and economic life |
19,612 | 8,114 | 26,098 | 1,366 | 22,123 | 77,313 |
| 25.4% | 10.5% | 33.8% | 1.8% | 28.6% | 100.0% | |
| Domestic life | 20,310 | 6,941 | 22,191 | 1,515 | 26,356 | 77,313 |
| 26.3% | 9.0% | 28.7% | 2.0% | 34.1% | 100.0% | |
| Working | 12,390 | 45,570 | 903 | 4,728 | 13,722 | 77,313 |
| 16.0% | 58.9% | 1.2% | 6.1% | 17.7% | 100.0% | |
Tables 4.8 and 4.9 show the number and per cent of consumers accessing disability employment services who always needed assistance or constant supervision by areas of assistance and primary disability for open and supported employment services, respectively. Note that consumers who did not require assistance or who required only occasional assistance/aids are not tabulated. These details can be found in Table 10A.
Comparisons across Tables 4.8 and 4.9 show that generally, consumers of open employment services needed assistance in different areas and to different degrees than consumers of supported employment services. Consumers of supported employment services were more likely than consumers of open employment services to be unable to perform, or needed constant assistance/aids to perform various tasks.
For most primary disability groups (intellectual, autism, physical, deaf/blind, vision, neurological, acquired brain injury), higher percentages of supported employment service consumers needed assistance across all nine areas than did open employment service consumers. However, there were some areas where the percentage difference was greater. For example, supported employment service consumers with a physical disability were at least twice as likely as their open employment service counterparts to need assistance in all nine areas. Further, they were more likely than open employment service consumers to need assistance with activities or participation in interpersonal interactions, learning, education and community life (see Tables 4.8 and 4.9).
| Psychiatric | Intellectual | Physical | Specific learning /ADD * |
Hearing | Neurological | Acquired brain injury |
Autism | Vision | Speech | Deafblind | Not stated | Total | |
|---|---|---|---|---|---|---|---|---|---|---|---|---|---|
| Self-care | 202 | 176 | 157 | 83 | 24 | 23 | 45 | 20 | 45 | 6 | 1 | 37 | 819 |
| 1.4% | 1.4% | 1.6% | 1.4% | 1.1% | 1.2% | 2.5% | 1.1% | 2.6% | 2.7% | 1.0% | 1.0% | 1.5% | |
| Mobility | 342 | 439 | 282 | 201 | 77 | 52 | 59 | 51 | 52 | 12 | 5 | 68 | 1,640 |
| 2.4% | 3.6% | 2.9% | 3.3% | 3.4% | 2.7% | 3.3% | 2.9% | 3.0% | 5.3% | 5.1% | 1.9% | 2.9% | |
| Communication | 388 | 481 | 309 | 240 | 90 | 61 | 67 | 53 | 54 | 10 | 4 | 73 | 1,830 |
| 2.7% | 3.9% | 3.2% | 3.9% | 4.0% | 3.2% | 3.7% | 3.0% | 3.1% | 4.4% | 4.0% | 2.1% | 3.3% | |
| Interpersonal interactions and relationships |
626 | 579 | 351 | 277 | 96 | 70 | 78 | 78 | 58 | 12 | 4 | 97 | 2,326 |
| 4.3% | 4.7% | 3.6% | 4.5% | 4.3% | 3.6% | 4.3% | 4.4% | 3.3% | 5.3% | 4.0% | 2.7% | 4.1% | |
| Learning | 777 | 793 | 531 | 379 | 126 | 106 | 127 | 103 | 71 | 18 | 5 | 156 | 3,192 |
| 5.3% | 6.4% | 5.5% | 6.2% | 5.6% | 5.5% | 7.1% | 5.8% | 4.0% | 8.0% | 5.1% | 4.4% | 5.7% | |
| Education | 908 | 957 | 626 | 446 | 157 | 129 | 145 | 126 | 90 | 19 | 6 | 213 | 3,822 |
| 6.2% | 7.7% | 6.5% | 7.3% | 7.0% | 6.7% | 8.1% | 7.1% | 5.1% | 8.4% | 6.1% | 6.0% | 6.8% | |
| Community (civic) and economic life |
522 | 602 | 384 | 267 | 95 | 73 | 105 | 69 | 54 | 14 | 3 | 91 | 2,279 |
| 3.6% | 4.9% | 4.0% | 4.3% | 4.2% | 3.8% | 5.8% | 3.9% | 3.1% | 6.2% | 3.0% | 2.6% | 4.1% | |
| Domestic life | 413 | 498 | 291 | 225 | 74 | 68 | 88 | 58 | 52 | 10 | 3 | 84 | 1,864 |
| 2.8% | 4.0% | 3.0% | 3.7% | 3.3% | 3.5% | 4.9% | 3.3% | 3.0% | 4.4% | 3.0% | 2.4% | 3.3% | |
| Working | 1,199 | 1,101 | 730 | 506 | 193 | 175 | 179 | 159 | 100 | 20 | 6 | 244 | 4,612 |
| 8.2% | 8.9% | 7.6% | 8.2% | 8.6% | 9.1% | 10.0% | 8.9% | 5.7% | 8.9% | 6.1% | 6.9% | 8.2% | |
| Total** | 14,546 | 12,357 | 9,652 | 6,145 | 2,238 | 1,919 | 1,798 | 1,780 | 1,759 | 225 | 99 | 3,546 | 56,064 |
| Psychiatric | Intellectual | Physical | Specific learning /ADD * |
Hearing | Neurological | Acquired brain injury |
Autism | Vision | Speech | Deafblind | Total | |
|---|---|---|---|---|---|---|---|---|---|---|---|---|
| Self-care | 1,599 | 81 | 295 | 53 | 58 | 31 | 21 | 5 | 5 | 8 | 2 | 2,158 |
| 10.6% | 3.4% | 21.0% | 8.9% | 12.7% | 7.4% | 7.1% | 1.8% | 2.5% | 17.0% | 5.3% | 10.2% | |
| Mobility | 2,503 | 67 | 367 | 99 | 106 | 54 | 53 | 11 | 18 | 15 | 4 | 3,297 |
| 16.5% | 2.8% | 26.2% | 16.6% | 23.2% | 12.9% | 18.0% | 4.0% | 8.9% | 31.9% | 10.5% | 15.5% | |
| Communication | 2,839 | 149 | 198 | 74 | 139 | 39 | 11 | 15 | 74 | 15 | 11 | 3,564 |
| 18.8% | 6.2% | 14.1% | 12.4% | 30.5% | 9.3% | 3.7% | 5.5% | 36.6% | 31.9% | 28.9% | 16.8% | |
| Interpersonal interactions and relationships |
3,827 | 300 | 238 | 112 | 190 | 69 | 18 | 35 | 40 | 11 | 11 | 4,851 |
| 25.3% | 12.5% | 17.0% | 18.8% | 41.7% | 16.5% | 6.1% | 12.8% | 19.8% | 23.4% | 28.9% | 22.8% | |
| Learning | 4,975 | 351 | 356 | 159 | 182 | 97 | 36 | 53 | 46 | 15 | 5 | 6,275 |
| 32.9% | 14.6% | 25.4% | 26.6% | 39.9% | 23.2% | 12.2% | 19.4% | 22.8% | 31.9% | 13.2% | 29.5% | |
| Education | 6,371 | 374 | 413 | 184 | 217 | 117 | 47 | 56 | 56 | 20 | 10 | 7,865 |
| 42.1% | 15.6% | 29.5% | 30.8% | 47.6% | 28.0% | 15.9% | 20.5% | 27.7% | 42.6% | 26.3% | 37.0% | |
| Community (civic) and economic life |
4,705 | 219 | 345 | 144 | 219 | 72 | 33 | 30 | 38 | 20 | 10 | 5,835 |
| 31.1% | 9.1% | 24.6% | 24.1% | 48.0% | 17.2% | 11.2% | 11.0% | 18.8% | 42.6% | 26.3% | 27.5% | |
| Domestic life | 3,909 | 208 | 424 | 139 | 193 | 82 | 42 | 22 | 32 | 16 | 10 | 5,077 |
| 25.8% | 8.7% | 30.2% | 23.3% | 42.3% | 19.6% | 14.2% | 8.1% | 15.8% | 34.0% | 26.3% | 23.9% | |
| Working | 5,730 | 769 | 509 | 197 | 228 | 131 | 59 | 71 | 55 | 21 | 8 | 7,778 |
| 37.9% | 32.1% | 36.3% | 33.0% | 50.0% | 31.3% | 20.0% | 26.0% | 27.2% | 44.7% | 21.1% | 36.6% | |
| Total ** | 15,124 | 2,397 | 1,402 | 597 | 456 | 418 | 295 | 273 | 202 | 47 | 38 | 21,249 |
[ Return to Top Return to Section ]
4.5 Residential setting
Table 4.10 shows that the vast majority of consumers (82.8%) accessing disability employment services lived in a private residence in 2005–06. Among the remaining 17.2%, most lived in either a domestic scale supported residence or supported accommodation. These trends are similar to those reported in 2004–05. Table 4.10 Consumer residential setting, 2005–06
| Residential Setting | No. | % |
|---|---|---|
| Private residence | 63,998 | 82.8 |
| Domestic-scale supported | 3,162 | 4.1 |
| Supported accommodation facility | 2,131 | 2.8 |
| Boarding house/private hotel | 696 | 0.9 |
| Independent unit retirement village | 101 | 0.1 |
| Residential aged care | 141 | 0.2 |
| Psychiatric community care | 239 | 0.3 |
| Short term crisis accommodation | 182 | 0.2 |
| Other | 697 | 0.9 |
| Not known | 5,966 | 7.7 |
| Total | 77,313 | 100.0 |
[ Return to Top Return to Section ]
4.6 Living arrangements
Table 4.11 provides information on consumers' living arrangements. Of the 77,313 consumers accessing disability employment services, living arrangements were not known for 8,001 (10.3%) consumers. Around three in every five consumers with a known living arrangement lived with family. Other consumers lived alone or in shared accommodation, 17.3% and 13.9% respectively.
| Living Arrangement | No. | % |
|---|---|---|
| Lives alone | 13,396 | 17.3 |
| Lives with family | 45,177 | 58.4 |
| Lives with others | 10,739 | 13.9 |
| Not known | 8,001 | 10.3 |
| Total | 77,313 | 100.0 |
[ Return to Top Return to Section ]
4.7 Income
This section of the report provides data on the main source of income for consumers accessing disability employment services in 2005–06, as well as specific information on the number of consumers in receipt of Disability Support Pension, Newstart/Youth Allowance and Mobility Allowance.
4.7.1 Main source of income
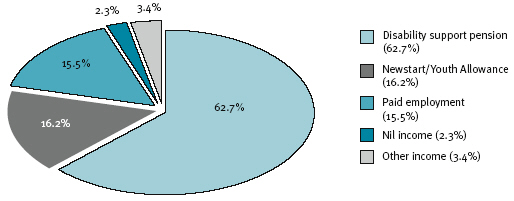
Main source of income was known for 74,584 (96.5%) consumers accessing disability employment services in 2005–06. Figure 4.4 shows the breakdown of the four major sources of income for these consumers, and the number (and per cent) of consumers with nil income. The Disability Support Pension was the main source of income for most disability employment service consumers (46,729; 62.7%), followed by Newstart/Youth Allowance and then paid employment, with 12,118 (16.2.%) and 11,533 (15.5%) consumers receiving these as their main source of income respectively. A further 2,500 (3.4%) consumers received another form of income, that included Mobility Allowance, compensation income, pensions/benefits other than Disability Support Pension and Newstart/Youth Allowance, and income such as superannuation and investments.
Figure 4.4: Main income source, 2005–06
4.7.2 Disability Support Pension
Consumers of supported employment services were proportionally more likely to receive Disability Support Pension than consumers of open employment services in 2005–06 (Table 4.12). That is, of the 21,249 consumers of supported employment services, 90.6% (19,253) received Disability Support Pension, compared to 56.1% (31,457) for open employment services consumers.
| Open | Supported | Total | |
|---|---|---|---|
| DSP | 31,457 | 19,253 | 50,710 |
| DSP + MA | 1,999 | 6,792 | 8,791 |
| Not on DSP | 24,409 | 325 | 24,734 |
| Unknown | 198 | 1,671 | 1,869 |
| Total | 56,064 | 21,249 | 77,313 |
In total, 50,710 consumers received Disability Support Pension in 2005–06, which means that 3,981 Disability Support Pension recipients did not report this payment as their main source of income.
Of the 31,457 open employment service consumers on Disability Support Pension in 2005–06, 1,999 (6.4%) were also in receipt of Mobility Allowance. There were 24,409 consumers of open employment services not receiving Disability Support Pension. With regard to supported employment services, 19,253 consumers received Disability Support Pension, and only 325 did not. Of those supported service consumers in receipt of Disability Support Pension, 6,792 (35.3%) also received Mobility Allowance.
There were 1,869 consumers whose Disability Support Pension status was not known for 2005–06.
4.7.3 Newstart/Youth Allowance
Consumers of open employment services were proportionally more likely to receive Newstart/Youth Allowance than consumers of supported employment services in 2005–06. Among all open employment service consumers, 26.1% received Newstart/Youth Allowance, compared to 0.9% of supported employment service consumers (Table 4.13).
A total of 14,839 employment service consumers received Newstart/Youth Allowance in 2005–06, which means that 2,721 Newstart/Youth Allowance recipients did not report Newstart/Youth Allowance as their main source of income.
The number of Newstart/Youth Allowance recipients across employment service type is provided in Table 4.13. The table also shows the number of Newstart/Youth Allowance recipients who also received Mobility Allowance, and the number of consumers not receiving Newstart/Youth Allowance. Newstart/Youth Allowance status was unknown for 2,969 consumers for 2005–06.
| Open | Supported | Total | |
|---|---|---|---|
| NSA/YA | 14,646 | 193 | 14,839 |
| NSA/YA + MA | 198 | 14 | 212 |
| Not on NSA/YA | 41,191 | 18,314 | 59,505 |
| Unknown | 227 | 2,742 | 2,969 |
| Total | 56,064 | 21,249 | 77,313 |
Open employment service consumers (14,646; 98.7%) accounted for the vast majority of the 14,839 employment service consumers on Newstart/Youth Allowance in 2005–06. Of these 14,646 open employment service consumers, 198 (1.4%) were also in receipt of Mobility Allowance. There were 198 consumers of supported employment services on Newstart/Youth Allowance, and of these, 14 also received Mobility Allowance.
[ Return to Top Return to Section ]
4.8 Employment characteristics
Data on employment characteristics was collected for consumers who were working on the collection date, 30 June 2006. All data in this sub-section refer to 'on the books' consumers only.
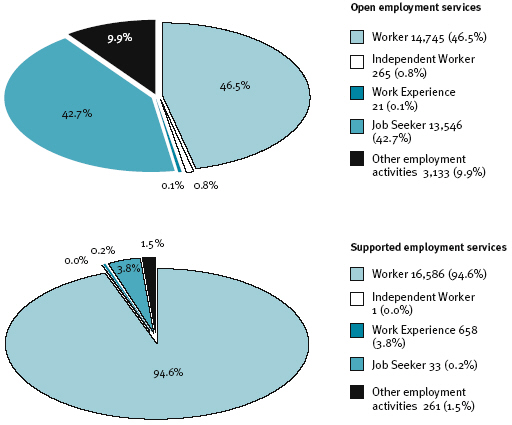
In supported employment services, of the 17,539 consumers 'on the books' on 30 June 2006 whose employment phase was known, the majority were recorded as being employed as workers (16,586; 94.6%), and one person as independent worker. There were 33 (0.2%) consumers registered as job seekers, 658 (3.8%) undertaking work experience (i.e., unpaid or voluntary work) and 261 (1.5%) performing other employment activities, such as activity therapy, independent living training, and non-vocational or day care programs. Employment phase data were not available for 22 supported employment consumers 'on the books' on census day.
Of the 39,381 consumers 'on the books' in open employment services, employment phase data were available for 31,710 (81.5%) consumers. Amongst these consumers, 14,745 (46.5%) were recorded as being employed as workers, and a further 265 (0.8%) as independent workers. This represents a decrease of 17.1% from the number of employed consumers (i.e., workers and independent workers) 'on the books' reported for the previous year (18,104 on 30 June 2005; 15,010 on 30 June 2006). The drop in the number of workers at the end of the 2005–06 financial year was driven by the move to full Case Based Funding (CBF). This saw the exit of a large number of effectively inactive clients, immediately following the transition from Block Grant Funding (BGF) to CBF on 1 July 2005. Filling of these newly vacant places was part of the reason for the unusually high intake in 2005–06.
Figure 4.5: Employment phase of employed consumers 'on the books', by service type, 30 June 2006
4.8.1 Basis of employment
Of the 31,597 employed consumers 'on the books' on 30 June 2006, basis of employment were known for 27,916 (88.4%) consumers. For those consumers whose basis of employment was known, the majority (17,283; 61.9%) were employed on a permanent part-time basis. An additional 8,894 (31.9%) worked on a permanent full-time basis, and 1,232 (4.4%) worked as permanent casuals. The remaining 507 (1.8%) workers were employed in either seasonal or temporary positions.
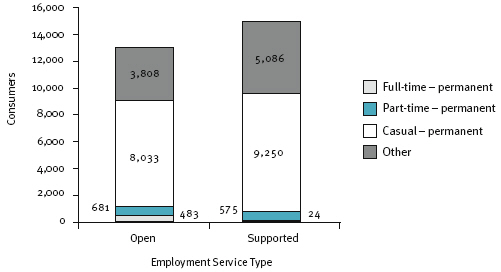
Figure 4.6 shows the breakdown of basis of employment by employment service type on 30 June 2006. The figure indicates that for both service types, the majority of consumers were employed on a permanent part–time basis, with permanent full-time employment as the next most common basis of employment. This finding differs from 2004–05, which showed that permanent casual employment was the second most common basis of employment for employed consumers of open employment services.
Of the employed consumers of open employment services with a known basis of employment, 8,033 (61.8%) were employed on a permanent part–time basis, 3,808 (29.3%) on a permanent full-time basis, and 681 (5.2%) on a permanent casual basis. A further 483 (3.7%) employed consumers of open employment services worked as either temporary employees or seasonal workers.
There were 14,911 employed consumers of supported employment services whose basis of employment was known. Of these, around three in every five consumers (9,250; 62.0%) worked on a permanent part-time basis, just over a third (5,086; 34.1%) were employed on a permanent full-time basis, and less than 5% (551; 3.7%) worked on a permanent casual basis or as temporary employees or seasonal workers (24; 0.2%).
Figure 4.6: Disability employment service type by basis of employment, 30 June 2006
4.8.2 Hours of employment
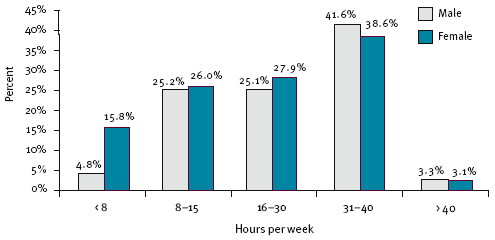
Data on hours worked were reported for 28,989 employed consumers of disability employment services as of 30 June 2006. Of these, nearly two-thirds (19,320; 66.7%) worked between 16 and 40 hours a week. A further 7,386 (25.5%) consumers worked between eight and 15 hours a week. Very few consumers worked less than eight hours (1,360; 4.7%) or more than 40 hours a week (923; 3.2%). See Table 12A for more detailed information. These percentages are comparable to those reported in 2004–05.
Figure 4.7 provides information on the per cent of male and female workers/independent workers, across hours of employment per week. This figure shows that males were more likely than females to work longer hours. For example, 41.6% of males and 38.6% of females worked between 31 to 40 hours. Females were slightly more likely than males to work less than 30 hours.
Figure 4.7: Per cent of male and female workers/independent workers by hours of employment per week, 30 June 2006
4.8.3 Wage type
Table 4.14 provides details about the type of wage paid to workers/independent workers as at 30 June 2006. Approximately a quarter of employed consumers were respondent to an award. A sizeable proportion of employed consumers were either paid wages in accordance with a ratified enterprise/certified agreement (23.1%) or in reference to an award/agreement (22.6%). A very small number of employed consumers received a wage not based on an award or agreement or were paid in reference to an award or Supported Wage System productivity–based wage.
| No. | % | |
|---|---|---|
| Ratified enterprise/certified agreement | 7,313 | 23.1 |
| Australian Workplace Agreement | 1,177 | 3.7 |
| Payment is made in reference to an award | 6,117 | 19.4 |
| Supported Wage System productivity-based | 2,845 | 9.0 |
| Wage not based on an award/agreement | 643 | 2.0 |
| Respondent to an award | 7,133 | 22.6 |
| Not known | 6,369 | 20.2 |
| Total | 31,597 | 100.0 |
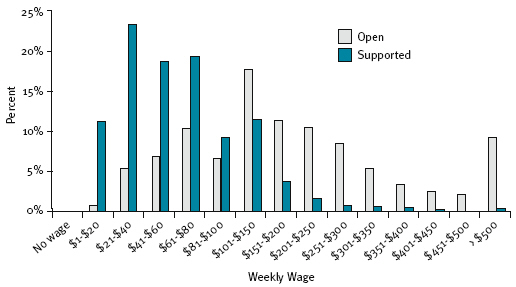
4.8.4 Wage level
The wage levels for employed consumers across employment service types on 30 June 2006 are provided in Figure 4.8. This figure shows that consumers of open employment services earned higher wages on average than consumers of supported employment services. More specifically, the majority of open employment service consumers (70.1%) earned more than $100 a week, whereas over 80% of supported employment service consumers earned $100 or less a week. This trend is consistent with that reported in 2004–05. See Table 12A for more detailed information.
Figure 4.8: Per cent of employed consumers by wage level and disability employment service type, 30 June 2006
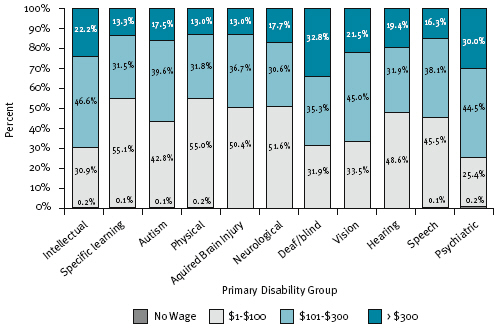
Wage level also differed across primary disability groups, as shown in Figure 4.9. The vast majority (87.0%) of employed consumers with a primary physical disability earned $300 or less a week, and very few (13.3%) earned more than $300 a week. This wage trend was similar for employed consumers with specific learning disability, acquired brain injury or neurological disability reported as their primary disability. In contrast, over one third of employed consumers with deafblind or psychiatric primary disability earned more than $300 a week. See Figure 4.9 for earning percentages of consumers with other primary disabilities.
Figure 4.9: Per cent of employed consumers by primary disability group and wage level, 30 June 2006
5. Jurisdiction specific data
- 5.1 New South Wales
- 5.2 Victoria
- 5.3 Queensland
- 5.4 Western Australia
- 5.5 South Australia
- 5.6 Tasmania
- 5.7 Australian Capital Territory
- 5.8 Northern Territory
This section provides data for all jurisdictions, including information on service outlet and staff numbers, consumer demographics and specific employment-related data.
5.1 New South Wales
5.1.1 Service outlets and staff hours
Two hundred and ninety (33.4%) of the 868 Australian Government funded disability service outlets were located in New South Wales. Of these service outlets:
- 86.2% were employment services
- 5.9% were respite care services
- 1.4% were print disability services
- 6.2% were advocacy services
- 0.3% were information services.
Across New South Wales employment services, staff worked a total of 78,106 hours, which equates to 30.3% of national employment service staff hours.
5.1.2 Consumer information
Service type and consumer demographic information
In New South Wales, there were 23,396 consumers of employment services in 2005–06. This represented 30.3% of all consumers assisted in Australia during the period.
Of New South Wales consumers:
- 65.8% used an open employment service
- 34.2% used a supported employment service
- 88.6% were born in Australia or another English speaking country
- 2.6% were identified as being Indigenous.
Primary disability
Of the 23,396 employment service consumers in New South Wales:
- 43.3% had an intellectual disability
- 20.1% had a psychiatric disability
- 10.9% had a physical disability
- 4.9% had a sensory/speech disability
- 10.9% had a specific learning disability/ADD or autism
- 5.3% had an acquired brain injury or neurological disability.
Main source of income
The main source of income for the 23,396 New South Wales employment service consumers was:
- Disability Support Pension 63.7%
- paid employment wages 13.3%
- Newstart/Youth Allowance 13.5%.
5.1.3 Employment specific information
- 59.8% (10,359) of the 17,318 consumers 'on the books' in New South Wales on 30 June 2006 were classified as employed (i.e. workers or independent workers) compared with the national average of 48.9%.
- The most common wage range for employed consumers was $61 to $80 a week, with 16.0% of workers earning this, compared with the most common national average range of $61 to $80 (13.4%).
- 20.9% of consumers worked between eight and 15 hours a week, 23.2% worked 16 to 30 hours a week and 40.5% worked 31 to 40 hours a week.
[ Return to Top Return to Section ]
5.2 Victoria
5.2.1 Service outlets and staff hours
One hundred and ninety-two (22.1%) of the 868 Australian Government funded disability service outlets were located in Victoria. Of the service outlets located in Victoria:
- 84.9% were employment services
- 2.6% were respite care services
- 1.6% were print disability services
- 10.9% were advocacy services.
Across Victorian employment services, staff worked a total of 42,700 hours, which equates to 16.6% of national employment service staff hours.
5.2.2 Consumer information
Service type and consumer demographic information
In Victoria, there were 20,882 consumers of employment services in 2005–06. This represented 27.0% of all consumers assisted in Australia during the period.
Of Victorian consumers:
- 77.3% used an open employment service
- 22.7% used a supported employment service
- 80.3% were born in Australia or another English speaking country
- 0.8% were identified as being Indigenous.
Primary disability
Of the 20,882 employment service consumers in Victoria:
- 25.2% had an intellectual disability
- 29.0% had a psychiatric disability
- 19.6% had a physical disability
- 6.9% had a sensory/speech disability
- 9.4% had a specific learning disability/ADD or autism
- 6.1% had an acquired brain injury or neurological disability.
Main source of income
The main source of income for the 20,882 Victorian employment service consumers was:
- Disability Support Pension 57.1%
- paid employment wages 15.5%
- Newstart/Youth Allowance 18.6%.
5.2.3 Employment specific information
- 48.2% (7,332) of the 15,212 consumers 'on the books' in Victoria on 30 June 2006 were classified as employed (i.e. workers or independent workers) compared with the national average of 48.9%.
- The most common wage range for employed consumers was $101 to $150 a week, with 13.5% of workers earning this, compared with the most common national average range of $61 to $80 with 13.4%.
- 26.8% of consumers worked between eight and 15 hours a week, 24.1% worked 16 to 30 hours a week, and 33.8% worked 31 to 40 hours a week.
[ Return to Top Return to Section ]
5.3 Queensland
5.3.1 Service outlets and staff hours
One hundred and thirty six (15.7%) of the 868 Australian Government funded disability service outlets were located in Queensland. Of Queensland service outlets:
- 86.0% were employment services
- 7.4% were respite care services
- 0.7% were print disability services
- 5.9% were advocacy services.
Across Queensland employment services, staff worked a total of 56,748 hours, which equates to 22.1% of national employment service staff hours.
5.3.2 Consumer information
Service type and consumer demographic information
In Queensland, there were 14,930 consumers of employment services in 2005–06. This represented 19.3% of all consumers assisted in Australia during the period.
Of Queensland consumers:
- 84.5% used an open employment service
- 15.5% used a supported employment service
- 90.6% were born in Australia or another English speaking country
- 3.5% were identified as being Indigenous.
Primary disability
Of the 14,930 employment service consumers in Queensland:
- 31.5% had an intellectual disability
- 20.5% had a psychiatric disability
- 14.9% had a physical disability
- 7.0% had a sensory/speech disability
- 13.5% had a specific learning disability/ADD or autism
- 6.4% had an acquired brain injury or neurological disability.
Main source of income
The main source of income for the 14,930 Queensland employment service consumers was:
- Disability Support Pension 56.8%
- paid employment wages 16.8%
- Newstart/Youth Allowance 17.2%.
5.3.3 Employment specific information
- 51.9% (5,514) of the 10,632 consumers 'on the books' in Queensland on 30 June 2006 were classified as employed (i.e. workers or independent workers) compared with the national average of 48.9%.
- The most common wage range for employed consumers was $61 to $80 a week, with 12.5% of workers earning this, compared with the most common national average range of $61 to $80 with 13.4%.
- 26.3% of consumers worked between eight and 15 hours a week, 23.3% worked 16 to 30 hours a week, and 30.2% worked 31 to 40 hours a week.
[ Return to Top Return to Section ]
5.4 Western Australia
5.4.1 Service outlets and staff hours
Eighty-two (9.4%) of the 868 Australian Government funded disability service outlets were located in Western Australia. Of these service outlets:
- 76.8% were employment services
- 11.0% were respite care services
- 2.4% were print disability services
- 9.8% were advocacy services.
Across Western Australian employment services, staff worked a total of 40,449 hours, which equates to 15.7% of national employment service staff hours.
5.4.2 Consumer information
Service type and consumer demographic information
In Western Australia, there were 7,542 consumers of employment services in 2005–06. This represented 9.8% of all consumers assisted in Australia during the period. Of these consumers:
- 70.0% used an open employment service
- 30.0% used a supported employment service
- 81.9% were born in Australia or another English speaking country
- 2.6% were identified as being Indigenous.
Primary disability
Of the 7,542 employment service consumers in Western Australia:
- 39.1% had an intellectual disability
- 19.6% had a psychiatric disability
- 13.9% had a physical disability
- 6.6% had a sensory/speech disability
- 12.1% had a specific learning disability/ADD or autism
- 7.0% had an acquired brain injury or neurological disability.
Main source of income
The main source of income for the 7,542 Western Australian employment service consumers was:
- Disability Support Pension 67.0%
- paid employment wages 13.1%
- Newstart/Youth Allowance 12.9%.
5.4.3 Employment specific information
- 61.4% (3,535) of the 5,755 consumers 'on the books' in Western Australia on 30 June 2006 were classified as employed (i.e. workers or independent workers) compared with the national average of 48.9%.
- The most common wage range for employed consumers was $21 to $40 a week, with 18.9% of workers earning this, compared with the most common national average range of $61 to $80 with 13.4%.
- 25.3% of consumers worked between eight and 15 hours a week, 26.4% worked 16 to 30 hours a week, and 36.0% worked 31 to 40 hours a week.
[ Return to Top Return to Section ]
5.5 South Australia
5.5.1 Service outlets and staff hours
Ninety-three (10.7%) of the 868 Australian Government funded disability service outlets were located in South Australia. Of these service outlets:
- 88.2% were employment services
- 4.3% were respite care services
- 1.1% were print disability services
- 6.5% were advocacy services.
Across South Australian employment services, staff worked a total of 25,323 hours, which equates to 9.9% of national employment service staff hours.
5.5.2 Consumer information
Service type and consumer demographic information
In South Australia, there were 6,916 consumers of employment services in 2005–06. This represented 8.9% of all consumers assisted in Australia during the period. Of these consumers:
- 57.0% used an open employment service
- 43.0% used a supported employment service
- 88.1% were born in Australia or another English speaking country
- 1.5% were identified as being Indigenous.
Primary disability
Of the 6,915 employment service consumers in South Australia:
- 44.7% had an intellectual disability
- 14.1% had a psychiatric disability
- 10.1% had a physical disability
- 8.7% had a sensory/speech disability
- 10.4% had a specific learning disability/ADD or autism
- 7.0% had an acquired brain injury or neurological disability.
Main source of income
The main source of income for the 6,916 South Australian employment service consumers was:
- Disability Support Pension 62.4%
- paid employment wages 15.3%
- Newstart/Youth Allowance 11.0%.
5.5.3 Employment specific information
- 64.1% (3,441) of the 5,372 consumers 'on the books' in South Australia on 30 June 2006 were classified as employed (i.e. workers or independent workers) compared with the national average of 48.9%.
- The most common wage range for employed consumers was $21 to $40 a week, with 16.6% of workers earning this, compared with the most common national average range of $61 to $80 with 13.4%.
- 17.1% of consumers worked between eight and 15 hours a week, 24.5% worked 16 to 30 hours a week, and 46.9% worked 31 to 40 hours a week.
[ Return to Top Return to Section ]
5.6 Tasmania
5.6.1 Service outlets and staff hours
Thirty-eight (4.4%) of the 868 Australian Government funded disability service outlets were located in Tasmania. Of these service outlets:
- 81.6% were employment services
- 7.9% were respite care services
- 2.6% were print disability services
- 7.9% were advocacy services.
Across Tasmanian employment services, staff worked a total of 9,478 hours, which equates to 3.7% of national employment service staff hours.
5.6.2 Consumer information
Service type and consumer demographic information
In Tasmania, there were 2,205 consumers of employment services in 2005–06. This represented 2.9% of all consumers assisted in Australia during the period. Of these consumers:
- 72.2% used an open employment service
- 27.8% used a supported employment service
- 91.6% were born in Australia or another English speaking country
- 3.9% were identified as being Indigenous.
Primary disability
Of the 2,205 employment service consumers in Tasmania:
- 34.9% had an intellectual disability
- 16.3% had a psychiatric disability
- 12.0% had a physical disability
- 3.9% had a sensory/speech disability
- 17.4% had a specific learning disability/ADD or autism
- 6.8% had an acquired brain injury or neurological disability.
Main source of income
The main source of income for the 2,205 Tasmanian employment service consumers was:
- Disability Support Pension 52.2%
- paid employment wages 14.7%
- Newstart/Youth Allowance 22.4%.
5.6.3 Employment specific information
- 56.3% (761) of the 1,582 consumers 'on the books' in Tasmania on 30 June 2006 were classified as employed (i.e. workers or independent workers) compared with the national average of 48.9%.
- The most common wage range for employed consumers was $21 to $40 a week, with 19.4% of workers earning this, compared with the most common national average range of $61 to $80 with 13.4%.
- 18.7% of consumers worked between eight and 15 hours a week, 22.1% worked 16 to 30 hours a week, and 44.6% worked 31 to 40 hours a week.
[ Return to Top Return to Section ]
5.7 Australian Capital Territory
5.7.1 Service outlets and staff hours
Twenty (2.3%) of the 868 Australian Government funded disability service outlets were located in the Australian Capital Territory. Of these service outlets:
- 70.0% were employment services
- 10.0% were respite care services
- 5.0% were print disability services
- 10.0% were advocacy services
- 5.0% were information services.
Across the Australian Capital Territory employment services, staff worked a total of 2,146 hours, which equates to 0.8% of national employment service staff hours.
5.7.2 Consumer information
Service type and consumer demographic information
In the Australian Capital Territory, there were 982 consumers of employment services in 2005–06. This represented 1.3% of all consumers assisted in Australia during the period. Of these consumers:
- 77.7% used an open employment service
- 22.3% used a supported employment service
- 88.1% were born in Australia or another English speaking country
- 0.5% were identified as being Indigenous.
Primary disability
Of the 982 employment service consumers in the Australian Capital Territory:
- 42.1% had an intellectual disability
- 24.5% had a psychiatric disability
- 9.8% had a physical disability
- 6.4% had a sensory/speech disability
- 9.4% had a specific learning disability/ADD or autism
- 6.3% had an acquired brain injury or neurological disability.
Main source of income
The main source of income for the 982 Australian Capital Territory employment service consumers was:
- Disability Support Pension 55.2%
- paid employment wages 12.7%
- Newstart/Youth Allowance 21.5%.
5.7.3 Employment specific information
- 48.3% (375) of the 776 consumers 'on the books' in the Australian Capital Territory on 30 June 2006 were classified as employed (i.e. workers or independent workers) compared with the national average of 48.9%.
- The most common wage ranges for employed consumers was $101 to $150 a week, with 18.1% of workers earning this, compared with the most common national average range of $61 to $80 with 13.4%.
- 26.9% of consumers worked between eight and 15 hours a week, 31.2% worked 16 to 30 hours a week, and 21.3% worked 31 to 40 hours a week.
[ Return to Top Return to Section ]
5.8 Northern Territory
5.8.1 Service outlets and staff hours
Seventeen (2.0%) of the 868 Australian Government funded disability service outlets were located in Northern Territory. Of these service outlets:
- 64.7% were employment services
- 17.6% were respite care services
- 17.6% were advocacy services.
Across the Northern Territory employment services, staff worked a total of 1,995 hours, which equates to 0.8% of national employment service staff hours.
5.8.2 Consumer information
Service type and consumer demographic information
In the Northern Territory, there were 440 consumers of employment services in 2005–06. This represented 0.6% of all consumers assisted in Australia during the period. Of these consumers:
- 72.7% used an open employment service
- 27.3% used a supported employment service
- 83.2% were born in Australia or another English speaking country
- 19.5% were identified as being Indigenous.
Primary disability
Of the 440 employment service consumers in the Northern Territory:
- 33.4% had an intellectual disability
- 14.8% had a psychiatric disability
- 14.3% had a physical disability
- 4.1% had a sensory/speech disability
- 9.3% had a specific learning disability/ADD or autism
- 7.7% had an acquired brain injury or neurological disability.
Main source of income
The main source of income for the 440 Northern Territory employment service consumers was:
- Disability Support Pension 64.8%
- paid employment wages 10.0%
- Newstart/Youth Allowance 14.5%.
5.8.3 Employment specific information
- 52.3% (150) of the 287 consumers 'on the books' in the Northern Territory on 30 June 2006 were classified as employed (i.e. workers or independent workers) compared with the national average of 48.9%.
- The most common wage range for employed consumers was $21 to $40 a week, with 20.0% of workers earning this, compared with the most common national average range of $61 to $80 with 13.4%.
- 34.0% of consumers worked between eight and 15 hours a week, 22.0% worked 16 to 30 hours a week, and 31.3% worked 31 to 40 hours a week.
6. References
Australian Bureau of Statistics (ABS) (2005). Australian Economic Indicators. Canberra, ACT: ABS.
Australian Government Department of Families, Community Services and Indigenous Affairs (FaCSIA) (2006). Australian Government Disability Services Census 2005. Canberra, ACT: Commonwealth of Australia.
Australian Government Department of Family and Community Services (FaCS) (2005b). Australian Government Disability Services Census 2004. Canberra, ACT: Commonwealth of Australia.
Australian Government Department of Family and Community Services (FaCS) (2005a). Australian Government Disability Services Census 2003. Canberra, ACT: Commonwealth of Australia.
Australian Government Department of Family and Community Services (FaCS) (2004). Australian Government Disability Services Census 2002. Canberra, ACT: Commonwealth of Australia.
Commonwealth Department of Family and Community Services (FaCS) (2003). Commonwealth Disability Services Census 2001. Canberra, ACT: Commonwealth of Australia.
Commonwealth Department of Family and Community Services (FaCS) (2002). Disability Services Census 2000. Canberra, ACT: Commonwealth of Australia.
Commonwealth Department of Family and Community Services (FaCS) (2000). Disability Services Census 1999. Canberra, ACT: Commonwealth of Australia.
Commonwealth Department of Family and Community Services 1998 (FaCS) (1999). Disability Services Census 1998. Canberra, ACT: Commonwealth of Australia.
Commonwealth Department of Family and Community Services (FaCS) (1998). Disability Services Census 1997. Canberra, ACT: Commonwealth of Australia.
Commonwealth Department of Health and Family Services (DHFS) (1997). Disability Services Census Report 1995. Canberra, ACT: Commonwealth of Australia.
Commonwealth Department of Human Services and Health (DHSH) (1994). Service Consumer Profile Report 1993. Canberra, ACT: Commonwealth of Australia.
Department of Health, Housing and Community Services (DHHCS) (1991). 1991 Census of Disability Services. North Sydney, NSW: AGB Research Australia.
7. Appendices
| Jurisdiction |
Service type |
Total | ||||
|---|---|---|---|---|---|---|
| Advocacy | Disability Information |
Print Disability |
Respite | Employment | ||
|
Direct Hours |
||||||
| NSW | 1,920 | 200 | 3,150 | 1,325 | 54,961 | 61,556 |
| Vic | 1,509 | – | 5,815 | 430 | 31,832 | 39,587 |
| Qld | 611 | – | 0 | 3,917 | 36,476 | 41,003 |
| WA | 1,057 | – | 24 | 922 | 31,474 | 33,476 |
| SA | 812 | – | 226 | 630 | 17,322 | 18,990 |
| Tas | 338 | – | 0 | 215 | 6,316 | 6,869 |
| ACT | 230 | 92 | 24 | 51 | 1,632 | 2,029 |
| NT | 245 | – | – | 182 | 1,531 | 1,958 |
| Total | 6,722 | 292 | 9,238 | 7,672 | 181,543 | 205,467 |
|
Indirect Hours |
||||||
| NSW | 758 | 0 | 268 | 640 | 23,144 | 24,811 |
| Vic | 813 | – | 55 | 110 | 10,867 | 11,846 |
| Qld | 376 | – | 300 | 923 | 20,273 | 21,872 |
| WA | 291 | – | 437 | 341 | 8,976 | 10,043 |
| SA | 226 | – | 14 | 513 | 8,001 | 8,754 |
| Tas | 253 | – | 0 | 234 | 3,162 | 3,649 |
| ACT | 120 | 68 | 12 | 381 | 514 | 1,095 |
| NT | 50 | – | – | 44 | 464 | 558 |
| Total | 2,886 | 68 | 1,086 | 3,186 | 75,400 | 82,626 |
|
Total Hours |
||||||
| NSW | 2,678 | 200 | 3,418 | 1,965 | 78,106 | 86,366 |
| Vic | 2,322 | – | 5,870 | 540 | 42,701 | 51,433 |
| Qld | 986 | – | 300 | 4,840 | 56,748 | 62,875 |
| WA | 1,347 | – | 460 | 1,263 | 40,449 | 43,519 |
| SA | 1,038 | – | 240 | 1,143 | 25,323 | 27,744 |
| Tas | 591 | – | 0 | 449 | 9,478 | 10,518 |
| ACT | 350 | 160 | 36 | 432 | 2,146 | 3,124 |
| NT | 295 | – | – | 226 | 1,995 | 2,516 |
| Total | 9,608 | 360 | 10,324 | 10,858 | 256,944 | 288,093 |
| Jurisdiction |
Employment service type |
|||
|---|---|---|---|---|
| Open | Supported | Total | ||
|
Direct Hours |
||||
| NSW | 18,396 | 36,565 | 54,961 | |
| Vic | 13,239 | 18,593 | 31,833 | |
| Qld | 25,963 | 10,513 | 36,476 | |
| WA | 22,113 | 9,361 | 31,474 | |
| SA | 6,087 | 11,235 | 17,322 | |
| Tas | 2,044 | 4,272 | 6,316 | |
| ACT | 892 | 740 | 1,632 | |
| NT | 577 | 954 | 1,531 | |
| Total | 89,311 | 92,232 | 181,543 | |
|
Indirect Hours |
||||
| NSW | 6,013 | 17,131 | 23,144 | |
| Vic | 4,905 | 5,962 | 10,868 | |
| Qld | 17,452 | 2,821 | 20,273 | |
| WA | 3,337 | 5,639 | 8,975 | |
| SA | 1,931 | 6,070 | 8,001 | |
| Tas | 1,109 | 2,053 | 3,162 | |
| ACT | 303 | 211 | 514 | |
| NT | 146 | 318 | 464 | |
| Total | 35,196 | 40,204 | 75,401 | |
|
Total Hours |
||||
| NSW | 24,410 | 53,696 | 78,106 | |
| Vic | 18,145 | 24,556 | 42,700 | |
| Qld | 43,415 | 13,333 | 56,748 | |
| WA | 25,449 | 15,000 | 40,449 | |
| SA | 8,018 | 17,305 | 25,323 | |
| Tas | 3,153 | 6,325 | 9,478 | |
| ACT | 1,195 | 951 | 2,146 | |
| NT | 723 | 1,272 | 1,995 | |
| Total | 124,508 | 132,436 | 256,944 | |
| Jurisdiction |
Indigenous origin |
Total | ||||
|---|---|---|---|---|---|---|
| Aboriginal Origin | Torres Strait Islander Origin | Aboriginal & Torres Strait Islander Origin | Not Indigenous | Not Stated | ||
|
Open |
||||||
| NSW | 423 | 0 | 0 | 14,939 | 22 | 15,384 |
| Vic | 139 | 0 | 0 | 16,001 | 4 | 16,144 |
| Qld | 452 | 4 | 0 | 12,154 | 10 | 12,620 |
| WA | 147 | 1 | 0 | 5,130 | 3 | 5,281 |
| SA | 79 | 0 | 0 | 3,848 | 12 | 3,939 |
| Tas | 76 | 0 | 0 | 1,510 | 7 | 1,593 |
| ACT | 3 | 0 | 0 | 759 | 1 | 763 |
| NT | 43 | 0 | 1 | 276 | 0 | 320 |
| Not known | 2 | 0 | 0 | 11 | 7 | 20 |
| Total | 1,364 | 5 | 1 | 54,628 | 66 | 56,064 |
|
Supported |
||||||
| NSW | 167 | 8 | 9 | 7,690 | 138 | 8,012 |
| Vic | 32 | 1 | 1 | 4,606 | 98 | 4,738 |
| Qld | 48 | 8 | 4 | 2,194 | 56 | 2,310 |
| WA | 45 | 0 | 3 | 2,168 | 45 | 2,261 |
| SA | 27 | 0 | 0 | 2,819 | 131 | 2,977 |
| Tas | 9 | 0 | 0 | 584 | 19 | 612 |
| ACT | 2 | 0 | 0 | 214 | 3 | 219 |
| NT | 41 | 1 | 0 | 75 | 3 | 120 |
| Not known | 0 | 0 | 0 | 0 | 0 | 0 |
| Total | 371 | 18 | 17 | 20,350 | 493 | 21,249 |
|
Total |
||||||
| NSW | 590 | 8 | 9 | 22,629 | 160 | 23,396 |
| Vic | 171 | 1 | 1 | 20,607 | 102 | 20,882 |
| Qld | 500 | 12 | 4 | 14,348 | 66 | 14,930 |
| WA | 192 | 1 | 3 | 7,298 | 48 | 7,542 |
| SA | 106 | 0 | 0 | 6,667 | 143 | 6,916 |
| Tas | 85 | 0 | 0 | 2,094 | 26 | 2,205 |
| ACT | 5 | 0 | 0 | 973 | 4 | 982 |
| NT | 84 | 1 | 1 | 351 | 3 | 440 |
| Not known | 2 | 0 | 0 | 11 | 7 | 20 |
| Total | 1,735 | 23 | 18 | 74,978 | 559 | 77,313 |
| Jurisdiction |
Country of birth |
Total | |||
|---|---|---|---|---|---|
| Australia | Non-English Speaking |
Other English Speaking |
Not Known | ||
|
Open |
|||||
| NSW | 13,280 | 1,445 | 272 | 387 | 15,384 |
| Vic | 12,272 | 3,218 | 308 | 346 | 16,144 |
| Qld | 10,905 | 1,008 | 499 | 208 | 12,620 |
| WA | 4,294 | 698 | 200 | 89 | 5,281 |
| SA | 3,435 | 347 | 44 | 113 | 3,939 |
| Tas | 1,462 | 82 | 8 | 41 | 1,593 |
| ACT | 650 | 74 | 10 | 29 | 763 |
| NT | 253 | 39 | 10 | 18 | 320 |
| Not known | 14 | 1 | 0 | 5 | 20 |
| Total | 46,565 | 6,912 | 1,351 | 1,236 | 56,064 |
|
Supported |
|||||
| NSW | 7,040 | 427 | 134 | 411 | 8,012 |
| Vic | 4,133 | 164 | 54 | 387 | 4,738 |
| Qld | 2,060 | 114 | 64 | 72 | 2,310 |
| WA | 1,638 | 101 | 45 | 477 | 2,261 |
| SA | 2,553 | 103 | 57 | 264 | 2,977 |
| Tas | 547 | 10 | 2 | 53 | 612 |
| ACT | 204 | 7 | 1 | 7 | 219 |
| NT | 103 | 1 | 0 | 16 | 120 |
| Not known | 0 | 0 | 0 | 0 | 0 |
| Total | 18,278 | 927 | 357 | 1,687 | 21,249 |
|
Total |
|||||
| NSW | 20,320 | 1,872 | 406 | 798 | 23,396 |
| Vic | 16,405 | 3,382 | 362 | 733 | 20,882 |
| Qld | 12,965 | 1,122 | 563 | 280 | 14,930 |
| WA | 5,932 | 799 | 245 | 566 | 7,542 |
| SA | 5,988 | 450 | 101 | 377 | 6,916 |
| Tas | 2,009 | 92 | 10 | 94 | 2,205 |
| ACT | 854 | 81 | 11 | 36 | 982 |
| NT | 356 | 40 | 10 | 34 | 440 |
| Not known | 14 | 1 | 0 | 5 | 20 |
| Total | 64,843 | 7,839 | 1,708 | 2,923 | 77,313 |
| English | Italian | Greek | Vietnamese | Chinese | Arabic/ Lebanese |
German | Spanish | Other Language |
Not known | Total | |
|---|---|---|---|---|---|---|---|---|---|---|---|
| NSW | 22,436 | 77 | 62 | 44 | 55 | 56 | 1 | 22 | 411 | 232 | 23,396 |
| Vic | 19,831 | 71 | 48 | 86 | 20 | 12 | 1 | 17 | 610 | 186 | 20,882 |
| Qld | 14,693 | 9 | 2 | 11 | 5 | 1 | 3 | 9 | 144 | 53 | 14,930 |
| WA | 7,224 | 22 | 2 | 9 | 13 | 0 | 1 | 8 | 116 | 147 | 7,542 |
| SA | 6,708 | 22 | 13 | 4 | 3 | 1 | 0 | 2 | 88 | 75 | 6,916 |
| Tas | 2,185 | 2 | 1 | 0 | 0 | 0 | 0 | 0 | 7 | 10 | 2,205 |
| ACT | 960 | 3 | 1 | 1 | 0 | 0 | 0 | 0 | 5 | 12 | 982 |
| NT | 402 | 0 | 2 | 1 | 0 | 0 | 0 | 0 | 30 | 5 | 440 |
| Not known | 13 | 0 | 0 | 0 | 0 | 0 | 0 | 0 | 0 | 7 | 20 |
| Total | 74,452 | 206 | 131 | 156 | 96 | 70 | 6 | 58 | 1,411 | 727 | 77,313 |
| For Spoken Language Other than English |
For Non-Spoken Communication |
No Interpreter | Not Stated | Total | |
|---|---|---|---|---|---|
|
Open |
|||||
| NSW | 20 | 56 | 15,241 | 67 | 15,384 |
| Vic | 68 | 134 | 15,831 | 111 | 16,144 |
| Qld | 14 | 165 | 12,394 | 47 | 12,620 |
| WA | 7 | 94 | 5,148 | 32 | 5,281 |
| SA | 1 | 38 | 3,879 | 21 | 3,939 |
| Tas | 1 | 5 | 1,579 | 8 | 1,593 |
| ACT | 1 | 6 | 756 | 0 | 763 |
| NT | 1 | 2 | 314 | 3 | 320 |
| Not known | 0 | 0 | 13 | 7 | 20 |
| Total | 113 | 500 | 55,155 | 296 | 56,064 |
|
Supported |
|||||
| NSW | 41 | 107 | 7,684 | 180 | 8,012 |
| Vic | 9 | 55 | 4,595 | 79 | 4,738 |
| Qld | 7 | 50 | 2,195 | 58 | 2,310 |
| WA | 4 | 41 | 2,173 | 43 | 2,261 |
| SA | 16 | 37 | 2,868 | 56 | 2,977 |
| Tas | 0 | 5 | 602 | 5 | 612 |
| ACT | 0 | 5 | 205 | 9 | 219 |
| NT | 1 | 2 | 100 | 17 | 120 |
| Not known | 0 | 0 | 0 | 0 | 0 |
| Total | 78 | 302 | 20,422 | 447 | 21,249 |
|
Total |
|||||
| NSW | 61 | 163 | 22,925 | 247 | 23,396 |
| Vic | 77 | 189 | 20,426 | 190 | 20,882 |
| Qld | 21 | 215 | 14,589 | 105 | 14,930 |
| WA | 11 | 135 | 7,321 | 75 | 7,542 |
| SA | 17 | 75 | 6,747 | 77 | 6,916 |
| Tas | 1 | 10 | 2,181 | 13 | 2,205 |
| ACT | 1 | 11 | 961 | 9 | 982 |
| NT | 2 | 4 | 414 | 20 | 440 |
| Not known | 0 | 0 | 13 | 7 | 20 |
| Total | 191 | 802 | 75,577 | 743 | 77,313 |
| Open | Supported | Total | |
|---|---|---|---|
|
Male |
|||
| NSW | 9,683 | 5,137 | 14,820 |
| Vic | 9,987 | 2,999 | 12,986 |
| Qld | 8,170 | 1,459 | 9,629 |
| WA | 3,308 | 1,392 | 4,700 |
| SA | 2,446 | 1,928 | 4,374 |
| Tas | 1,049 | 407 | 1,456 |
| ACT | 427 | 152 | 579 |
| NT | 189 | 72 | 261 |
| Not known | 12 | 0 | 12 |
| Total | 35,271 | 13,546 | 48,817 |
|
Female |
|||
| NSW | 5,691 | 2,875 | 8,566 |
| Vic | 6,154 | 1,739 | 7,893 |
| Qld | 4,438 | 851 | 5,289 |
| WA | 1,968 | 869 | 2,837 |
| SA | 1,487 | 1,049 | 2,536 |
| Tas | 537 | 205 | 742 |
| ACT | 336 | 67 | 403 |
| NT | 131 | 48 | 179 |
| Not known | 3 | 0 | 3 |
| Total | 20,745 | 7,703 | 28,448 |
|
Not stated |
|||
| NSW | 10 | 0 | 10 |
| Vic | 4 | 0 | 4 |
| Qld | 12 | 0 | 12 |
| WA | 5 | 0 | 5 |
| SA | 5 | 0 | 5 |
| Tas | 7 | 0 | 7 |
| ACT | 0 | 0 | 0 |
| NT | 0 | 0 | 0 |
| Not known | 5 | 0 | 5 |
| Total | 48 | 0 | 48 |
|
Total |
|||
| NSW | 15,384 | 8,012 | 23,396 |
| Vic | 16,145 | 4,738 | 20,883 |
| Qld | 12,620 | 2,310 | 14,930 |
| WA | 5,281 | 2,261 | 7,542 |
| SA | 3,938 | 2,977 | 6,915 |
| Tas | 1,593 | 612 | 2,205 |
| ACT | 763 | 219 | 982 |
| NT | 320 | 120 | 440 |
| Not known | 20 | 0 | 20 |
| Total | 56,064 | 21,249 | 77,313 |
| Primary Disability |
Secondary disability |
||||||||||
|---|---|---|---|---|---|---|---|---|---|---|---|
| Intellectual | Specific Learning/ADD |
Autism | Physical | Acquired Brain Injury |
Neurological | Deafblind | Vision | Hearing | Speech | Psychiatric | |
|
Open Employment |
|||||||||||
| Intellectual | 115 | 412 | 50 | 601 | 28 | 296 | 4 | 144 | 188 | 246 | 329 |
| Specific learning/ADD | 109 | 45 | 22 | 186 | 4 | 75 | 3 | 32 | 42 | 37 | 180 |
| Autism | 73 | 90 | 24 | 38 | 2 | 25 | 0 | 11 | 11 | 12 | 79 |
| Physical | 196 | 178 | 10 | 73 | 30 | 166 | 7 | 95 | 92 | 87 | 409 |
| Acquired brain injury | 53 | 52 | 2 | 207 | 25 | 87 | 5 | 48 | 30 | 34 | 96 |
| Neurological | 74 | 85 | 2 | 136 | 15 | 29 | 1 | 28 | 18 | 17 | 88 |
| Deafblind | 4 | 1 | 3 | 3 | 1 | 0 | 0 | 0 | 0 | 4 | 2 |
| Vision | 20 | 24 | 1 | 73 | 9 | 18 | 0 | 16 | 23 | 5 | 36 |
| Hearing | 61 | 27 | 1 | 101 | 6 | 15 | 1 | 38 | 20 | 42 | 35 |
| Speech | 12 | 17 | 0 | 10 | 1 | 4 | 0 | 2 | 4 | 4 | 3 |
| Psychiatric | 170 | 177 | 8 | 560 | 28 | 80 | 6 | 37 | 38 | 19 | 658 |
| Not stated | 47 | 31 | 6 | 48 | 12 | 25 | 0 | 9 | 2 | 11 | 234 |
| Total | 934 | 1,139 | 129 | 2,036 | 161 | 82 | 27 | 460 | 468 | 518 | 2,149 |
|
Supported Employment |
|||||||||||
| Intellectual | 176 | 653 | 190 | 1,205 | 51 | 566 | 39 | 610 | 491 | 1,126 | 643 |
| Specific learning/ADD | 21 | 7 | 1 | 9 | 0 | 6 | 0 | 0 | 4 | 2 | 17 |
| Autism | 104 | 30 | 22 | 9 | 2 | 9 | 4 | 9 | 9 | 35 | 25 |
| Physical | 344 | 77 | 0 | 68 | 12 | 49 | 3 | 87 | 78 | 126 | 43 |
| Acquired brain injury | 54 | 17 | 3 | 111 | 9 | 38 | 3 | 36 | 12 | 35 | 28 |
| Neurological | 76 | 15 | 4 | 54 | 7 | 25 | 1 | 18 | 6 | 15 | 20 |
| Deafblind | 17 | 3 | 0 | 6 | 0 | 13 | 1 | 14 | 13 | 6 | 5 |
| Vision | 49 | 4 | 4 | 34 | 4 | 8 | 3 | 7 | 14 | 7 | 5 |
| Hearing | 43 | 17 | 0 | 19 | 4 | 1 | 0 | 0 | 1 | 37 | 9 |
| Speech | 4 | 3 | 0 | 5 | 0 | 32 | 54 | 12 | 10 | 8 | 0 |
| Psychiatric | 183 | 31 | 8 | 88 | 10 | 0 | 0 | 0 | 0 | 15 | 93 |
| Total | 1,071 | 857 | 232 | 1,608 | 99 | 747 | 108 | 793 | 638 | 1,412 | 888 |
|
Total |
|||||||||||
| Intellectual | 291 | 1,065 | 240 | 1,806 | 79 | 862 | 43 | 754 | 679 | 1,372 | 972 |
| Specific learning/ADD | 130 | 52 | 23 | 195 | 4 | 81 | 3 | 32 | 46 | 39 | 197 |
| Autism | 177 | 120 | 46 | 47 | 4 | 34 | 4 | 20 | 20 | 47 | 104 |
| Physical | 540 | 255 | 10 | 141 | 42 | 215 | 10 | 182 | 170 | 213 | 452 |
| Acquired brain injury | 107 | 69 | 5 | 318 | 34 | 125 | 8 | 84 | 42 | 69 | 124 |
| Neurological | 150 | 100 | 6 | 190 | 22 | 54 | 2 | 46 | 24 | 32 | 108 |
| Deafblind | 21 | 4 | 3 | 9 | 1 | 13 | 1 | 14 | 13 | 10 | 7 |
| Vision | 69 | 28 | 5 | 107 | 13 | 26 | 3 | 23 | 37 | 12 | 41 |
| Hearing | 104 | 44 | 1 | 120 | 10 | 16 | 1 | 38 | 21 | 79 | 44 |
| Speech | 16 | 20 | 0 | 15 | 1 | 36 | 54 | 14 | 14 | 12 | 3 |
| Psychiatric | 353 | 208 | 16 | 648 | 38 | 80 | 6 | 37 | 38 | 34 | 751 |
| Not stated | 1,118 | 888 | 238 | 1,656 | 111 | 772 | 108 | 802 | 640 | 1,423 | 1,122 |
| Total | 2,005 | 1,996 | 361 | 3,644 | 260 | 829 | 135 | 1,253 | 1,106 | 1,930 | 3,037 |
| Primary Disability |
Life area |
||||||||
|---|---|---|---|---|---|---|---|---|---|
| Self Care | Mobility | Communication | Interpersonal | Learning | Education | Community | Domestic | Working | |
|
Does Not Need Help/Supervision and Does Not Use Aids |
|||||||||
| Intellectual | 12,149 | 10,824 | 6,813 | 3,965 | 2,674 | 2,986 | 333 | 384 | 968 |
| Specific Learning/ADD | 4,115 | 3,205 | 2,297 | 1,696 | 1,283 | 1,369 | 112 | 131 | 464 |
| Autism | 1,193 | 959 | 611 | 420 | 350 | 392 | 35 | 43 | 130 |
| Physical | 6,918 | 5,511 | 4,265 | 3,078 | 2,327 | 2,608 | 214 | 235 | 883 |
| Acquired Brain Injury | 1,427 | 1,106 | 881 | 615 | 442 | 494 | 44 | 53 | 152 |
| Neurological | 1,540 | 1,213 | 909 | 632 | 502 | 549 | 34 | 49 | 186 |
| Deaf/Blind | 74 | 69 | 43 | 24 | 16 | 19 | 3 | 1 | 4 |
| Vision | 1,265 | 896 | 769 | 610 | 412 | 435 | 112 | 70 | 124 |
| Hearing | 1,650 | 1,335 | 808 | 658 | 516 | 547 | 64 | 72 | 178 |
| Speech | 163 | 131 | 78 | 60 | 44 | 57 | 6 | 5 | 20 |
| Psychiatric | 11,944 | 10,332 | 7,076 | 4,535 | 3,741 | 4,273 | 346 | 402 | 1,336 |
| Not stated | 2,135 | 1,542 | 1,149 | 888 | 701 | 754 | 63 | 70 | 283 |
| Total | 44,573 | 37,123 | 25,699 | 17,181 | 13,008 | 14,483 | 1,366 | 1,515 | 4,728 |
|
Does Not Need Help/Supervision but Uses Aids |
|||||||||
| Intellectual | 652 | 974 | 439 | 309 | 306 | 334 | 9,575 | 8,921 | 209 |
| Specific Learning/ADD | 177 | 316 | 91 | 81 | 83 | 123 | 2,001 | 1,552 | 101 |
| Autism | 60 | 96 | 28 | 17 | 29 | 38 | 628 | 515 | 26 |
| Physical | 386 | 687 | 206 | 174 | 186 | 236 | 3,417 | 2,729 | 164 |
| Acquired Brain Injury | 81 | 220 | 50 | 20 | 28 | 31 | 796 | 683 | 20 |
| Neurological | 65 | 115 | 42 | 29 | 27 | 47 | 845 | 666 | 25 |
| Deaf/Blind | 2 | 3 | 1 | 1 | 3 | 3 | 51 | 47 | 2 |
| Vision | 132 | 176 | 72 | 60 | 69 | 121 | 603 | 554 | 62 |
| Hearing | 79 | 98 | 57 | 52 | 55 | 63 | 797 | 634 | 33 |
| Speech | 7 | 20 | 6 | 6 | 4 | 6 | 93 | 67 | 3 |
| Psychiatric | 530 | 780 | 336 | 240 | 264 | 314 | 6,437 | 5,118 | 211 |
| Not stated | 106 | 280 | 50 | 40 | 40 | 62 | 855 | 705 | 47 |
| Total | 2,277 | 3,765 | 1,378 | 1,029 | 1,094 | 1,378 | 26,098 | 22,191 | 903 |
|
Sometimes Needs Help/Supervision |
|||||||||
| Intellectual | 8,331 | 6,581 | 10,892 | 12,838 | 13,188 | 10,436 | 4,570 | 3,795 | 14,204 |
| Specific Learning/ADD | 1,140 | 1,158 | 2,285 | 2,775 | 3,114 | 2,728 | 288 | 238 | 3,814 |
| Autism | 478 | 402 | 803 | 920 | 974 | 807 | 240 | 207 | 1,122 |
| Physical | 1,988 | 2,053 | 3,987 | 5,025 | 5,511 | 4,687 | 743 | 730 | 6,749 |
| Acquired Brain Injury | 562 | 544 | 954 | 1,178 | 1,250 | 1,050 | 276 | 252 | 1,460 |
| Neurological | 499 | 517 | 938 | 1,165 | 1,245 | 1,044 | 164 | 164 | 1,478 |
| Deaf/Blind | 45 | 35 | 64 | 84 | 87 | 69 | 23 | 20 | 93 |
| Vision | 396 | 506 | 793 | 939 | 1,104 | 865 | 91 | 102 | 1,333 |
| Hearing | 452 | 452 | 954 | 1,127 | 1,242 | 1,071 | 135 | 106 | 1,556 |
| Speech | 56 | 53 | 116 | 128 | 149 | 117 | 22 | 18 | 171 |
| Psychiatric | 3,912 | 3,940 | 7,682 | 9,558 | 9,980 | 7,913 | 1,471 | 1,225 | 11,595 |
| Not stated | 568 | 533 | 1,159 | 1,475 | 1,615 | 1,230 | 91 | 84 | 1,995 |
| Total | 18,427 | 16,774 | 30,627 | 37,212 | 39,459 | 32,017 | 8,114 | 6,941 | 45,570 |
|
Unable to Do/Always Needs Help/Supervision |
|||||||||
| Intellectual | 1,505 | 2,521 | 2,911 | 3,823 | 4,932 | 6,323 | 5,014 | 5,204 | 5,818 |
| Specific Learning/ADD | 86 | 206 | 253 | 299 | 411 | 478 | 1,855 | 1,887 | 556 |
| Autism | 68 | 136 | 171 | 236 | 246 | 295 | 640 | 656 | 341 |
| Physical | 460 | 665 | 517 | 602 | 899 | 1,057 | 2,836 | 2,930 | 1,255 |
| Acquired Brain Injury | 111 | 178 | 158 | 210 | 317 | 366 | 610 | 630 | 416 |
| Neurological | 62 | 114 | 106 | 152 | 218 | 266 | 560 | 577 | 324 |
| Deaf/Blind | 9 | 19 | 18 | 15 | 19 | 27 | 37 | 37 | 26 |
| Vision | 69 | 112 | 69 | 80 | 110 | 141 | 570 | 612 | 168 |
| Hearing | 28 | 97 | 171 | 136 | 174 | 213 | 614 | 641 | 251 |
| Speech | 6 | 14 | 22 | 20 | 22 | 26 | 56 | 64 | 26 |
| Psychiatric | 536 | 807 | 925 | 1,507 | 1,963 | 2,282 | 5,540 | 5,834 | 2,965 |
| Not stated | 37 | 68 | 73 | 97 | 156 | 213 | 1,280 | 1,238 | 244 |
| Total | 2,977 | 4,937 | 5,394 | 7,177 | 9,467 | 11,687 | 19,612 | 20,310 | 12,390 |
|
Not Known |
|||||||||
| Intellectual | 1,908 | 3,645 | 3,490 | 3,610 | 3,445 | 4,466 | 5,053 | 6,241 | 3,346 |
| Specific Learning/ADD | 842 | 1,475 | 1,434 | 1,509 | 1,469 | 1,662 | 2,104 | 2,552 | 1,425 |
| Autism | 309 | 515 | 495 | 515 | 509 | 576 | 565 | 687 | 489 |
| Physical | 1,370 | 2,206 | 2,147 | 2,243 | 2,199 | 2,534 | 3,912 | 4,498 | 2,071 |
| Acquired Brain Injury | 293 | 426 | 431 | 451 | 437 | 533 | 748 | 856 | 426 |
| Neurological | 234 | 441 | 405 | 422 | 408 | 494 | 797 | 944 | 387 |
| Deaf/Blind | 15 | 19 | 19 | 21 | 20 | 27 | 31 | 40 | 20 |
| Vision | 207 | 379 | 366 | 380 | 374 | 507 | 693 | 731 | 382 |
| Hearing | 243 | 470 | 462 | 479 | 465 | 558 | 842 | 999 | 434 |
| Speech | 28 | 42 | 38 | 46 | 41 | 54 | 83 | 106 | 40 |
| Psychiatric | 2,910 | 3,973 | 3,813 | 3,992 | 3,884 | 5,050 | 6,038 | 7,253 | 3,725 |
| Not stated | 700 | 1,123 | 1,115 | 1,046 | 1,034 | 1,287 | 1,257 | 1,449 | 977 |
| Total | 9,059 | 14,714 | 14,215 | 14,714 | 14,285 | 17,748 | 22,123 | 26,356 | 13,722 |
|
Total |
|||||||||
| Intellectual | 24,545 | 24,545 | 24,545 | 24,545 | 24,545 | 24,545 | 24,545 | 24,545 | 24,545 |
| Specific Learning/ADD | 6,360 | 6,360 | 6,360 | 6,360 | 6,360 | 6,360 | 6,360 | 6,360 | 6,360 |
| Autism | 2,108 | 2,108 | 2,108 | 2,108 | 2,108 | 2,108 | 2,108 | 2,108 | 2,108 |
| Physical | 11,122 | 11,122 | 11,122 | 11,122 | 11,122 | 11,122 | 11,122 | 11,122 | 11,122 |
| Acquired Brain Injury | 2,474 | 2,474 | 2,474 | 2,474 | 2,474 | 2,474 | 2,474 | 2,474 | 2,474 |
| Neurological | 2,400 | 2,400 | 2,400 | 2,400 | 2,400 | 2,400 | 2,400 | 2,400 | 2,400 |
| Deaf/Blind | 145 | 145 | 145 | 145 | 145 | 145 | 145 | 145 | 145 |
| Vision | 2,069 | 2,069 | 2,069 | 2,069 | 2,069 | 2,069 | 2,069 | 2,069 | 2,069 |
| Hearing | 2,452 | 2,452 | 2,452 | 2,452 | 2,452 | 2,452 | 2,452 | 2,452 | 2,452 |
| Speech | 260 | 260 | 260 | 260 | 260 | 260 | 260 | 260 | 260 |
| Psychiatric | 19,832 | 19,832 | 19,832 | 19,832 | 19,832 | 19,832 | 19,832 | 19,832 | 19,832 |
| Not stated | 3,546 | 3,546 | 3,546 | 3,546 | 3,546 | 3,546 | 3,546 | 3,546 | 3,546 |
| Total | 77,313 | 77,313 | 77,313 | 77,313 | 77,313 | 77,313 | 77,313 | 77,313 | 77,313 |
| Employment service type |
Life area |
||||||||
|---|---|---|---|---|---|---|---|---|---|
| Self Care | Mobility | Communication | Interpersonal | Learning | Education | Community | Domestic | Working | |
|
Does Not Need Help/Supervision and Does not Use Aids |
|||||||||
| Open | 36,536 | 28,843 | 20,662 | 15,174 | 12,205 | 13,391 | 1,075 | 1,231 | 4,488 |
| Supported | 8,037 | 8,280 | 5,037 | 2,007 | 803 | 1,092 | 291 | 284 | 240 |
| Total | 44,573 | 37,123 | 25,699 | 17,181 | 13,008 | 14,483 | 1,366 | 1,515 | 4,728 |
|
Does Not Need Help/Supervision but Uses Aids |
|||||||||
| Open | 1,637 | 2,985 | 986 | 739 | 847 | 1,099 | 16,834 | 12,763 | 767 |
| Supported | 640 | 780 | 392 | 290 | 247 | 279 | 9,264 | 9,428 | 136 |
| Total | 2,277 | 3,765 | 1,378 | 1,029 | 1,094 | 1,378 | 26,098 | 22,191 | 903 |
|
Sometimes Needs Help/Supervision |
|||||||||
| Open | 9,951 | 9,812 | 20,028 | 24,894 | 27,186 | 22,879 | 2,279 | 1,864 | 34,060 |
| Supported | 8,476 | 6,962 | 10,599 | 12,318 | 12,273 | 9,138 | 5,835 | 5,077 | 11,510 |
| Total | 18,427 | 16,774 | 30,627 | 37,212 | 39,459 | 32,017 | 8,114 | 6,941 | 45,570 |
|
Unable to do/Always Needs Help/Supervision |
|||||||||
| Open | 819 | 1,640 | 1,830 | 2,326 | 3,192 | 3,822 | 16,291 | 16,683 | 4,612 |
| Supported | 2,158 | 3,297 | 3,564 | 4,851 | 6,275 | 7,865 | 3,321 | 3,627 | 7,778 |
| Total | 2,977 | 4,937 | 5,394 | 7,177 | 9,467 | 11,687 | 19,612 | 20,310 | 12,390 |
|
Not Known |
|||||||||
| Open | 7,121 | 12,784 | 12,558 | 12,931 | 12,634 | 14,873 | 19,585 | 23,523 | 12,137 |
| Supported | 1,938 | 1,930 | 1,657 | 1,783 | 1,651 | 2,875 | 2,538 | 2,833 | 1,585 |
| Total | 9,059 | 14,714 | 14,215 | 14,714 | 14,285 | 17,748 | 22,123 | 26,356 | 13,722 |
|
Total |
|||||||||
| Open | 56,064 | 56,064 | 56,064 | 56,064 | 56,064 | 56,064 | 56,064 | 56,064 | 56,064 |
| Supported | 21,249 | 21,249 | 21,249 | 21,249 | 21,249 | 21,249 | 21,249 | 21,249 | 21,249 |
| Total | 77,313 | 77,313 | 77,313 | 77,313 | 77,313 | 77,313 | 77,313 | 77,313 | 77,313 |
| Basis of employment | NSW | Vic | Qld | WA | SA | Tas | ACT | NT | Not known | Total |
|---|---|---|---|---|---|---|---|---|---|---|
|
Open |
||||||||||
| Full time-permanent | 1,119 | 962 | 882 | 362 | 281 | 141 | 46 | 15 | 0 | 3,808 |
| Part time-permanent | 2,115 | 1,998 | 2,104 | 903 | 589 | 195 | 92 | 36 | 1 | 8,033 |
| Casual-permanent | 118 | 196 | 230 | 95 | 38 | 2 | 2 | 0 | 0 | 681 |
| Seasonal-permanent | 1 | 0 | 1 | 3 | 1 | 0 | 0 | 0 | 0 | 6 |
| Full time-temporary | 10 | 23 | 30 | 14 | 6 | 1 | 0 | 0 | 0 | 84 |
| Part time-temporary | 17 | 37 | 29 | 6 | 4 | 3 | 0 | 0 | 0 | 96 |
| Casual-temporary | 67 | 52 | 85 | 67 | 16 | 3 | 1 | 0 | 0 | 291 |
| Seasonal-temporary | 2 | 0 | 1 | 1 | 2 | 0 | 0 | 0 | 0 | 6 |
| Not known | 732 | 399 | 368 | 239 | 148 | 62 | 45 | 12 | 0 | 2,005 |
| Total | 4,181 | 3,667 | 3,730 | 1,690 | 1,085 | 407 | 186 | 63 | 1 | 15,010 |
|
Supported |
||||||||||
| Full time-permanent | 2,129 | 907 | 478 | 449 | 878 | 198 | 18 | 29 | 0 | 5,086 |
| Part time-permanent | 3,160 | 1,964 | 1,054 | 1,382 | 1,225 | 251 | 157 | 57 | 0 | 9,250 |
| Casual-permanent | 150 | 232 | 50 | 0 | 114 | 4 | 1 | 0 | 0 | 551 |
| Seasonal-permanent | 0 | 0 | 0 | 0 | 0 | 0 | 0 | 0 | 0 | 0 |
| Full time-temporary | 0 | 0 | 0 | 1 | 0 | 0 | 0 | 0 | 0 | 1 |
| Part time-temporary | 1 | 1 | 2 | 1 | 1 | 0 | 1 | 0 | 0 | 7 |
| Casual-temporary | 2 | 1 | 0 | 0 | 4 | 0 | 9 | 0 | 0 | 16 |
| Seasonal-temporary | 0 | 0 | 0 | 0 | 0 | 0 | 0 | 0 | 0 | 0 |
| Not known | 736 | 560 | 200 | 12 | 134 | 30 | 3 | 1 | 0 | 1,676 |
| Total | 6,178 | 3,665 | 1,784 | 1,845 | 2,356 | 483 | 189 | 87 | 0 | 16,587 |
|
Total |
||||||||||
| Full time-permanent | 3,248 | 1,869 | 1,360 | 811 | 1,159 | 339 | 64 | 44 | 0 | 8,894 |
| Part time-permanent | 5,275 | 3,962 | 3,158 | 2,285 | 1,814 | 446 | 249 | 93 | 1 | 17,283 |
| Casual-permanent | 268 | 428 | 280 | 95 | 152 | 6 | 3 | 0 | 0 | 1,232 |
| Seasonal-permanent | 1 | 0 | 1 | 3 | 1 | 0 | 0 | 0 | 0 | 6 |
| Full time-temporary | 10 | 23 | 30 | 15 | 6 | 1 | 0 | 0 | 0 | 85 |
| Part time-temporary | 18 | 38 | 31 | 7 | 5 | 3 | 1 | 0 | 0 | 103 |
| Casual-temporary | 69 | 53 | 85 | 67 | 20 | 3 | 10 | 0 | 0 | 307 |
| Seasonal-temporary | 2 | 0 | 1 | 1 | 2 | 0 | 0 | 0 | 0 | 6 |
| Not known | 1,468 | 959 | 568 | 251 | 282 | 92 | 48 | 13 | 0 | 3,681 |
| Total | 10,359 | 7,332 | 5,514 | 3,535 | 3,441 | 890 | 375 | 150 | 1 | 31,597 |
| Weekly wage |
Weekly hours |
Total | ||||||
|---|---|---|---|---|---|---|---|---|
| <8 | 8–15 | 16–30 | 31–40 | >40 | Not stated | |||
|
Open |
||||||||
| No Wage | 10 | 3 | 2 | 2 | 1 | 1 | 19 | |
| $1–$20 | 31 | 24 | 17 | 13 | 3 | 2 | 90 | |
| $21–$40 | 105 | 505 | 39 | 6 | 5 | 3 | 663 | |
| $41–$60 | 65 | 698 | 83 | 16 | 12 | 0 | 874 | |
| $61–$80 | 27 | 1,067 | 178 | 16 | 27 | 3 | 1,318 | |
| $81–$100 | 8 | 542 | 220 | 47 | 9 | 6 | 832 | |
| $101–$150 | 21 | 916 | 831 | 393 | 63 | 20 | 2,244 | |
| $151–$200 | 5 | 274 | 709 | 387 | 67 | 20 | 1,462 | |
| $201–$250 | 3 | 148 | 376 | 677 | 85 | 15 | 1,304 | |
| $251–$300 | 3 | 64 | 240 | 641 | 118 | 18 | 1,084 | |
| $301–$350 | 7 | 15 | 167 | 380 | 86 | 4 | 659 | |
| $351–$400 | 1 | 16 | 138 | 191 | 64 | 7 | 417 | |
| $401–$450 | 1 | 5 | 76 | 162 | 38 | 12 | 294 | |
| $451–$500 | 1 | 10 | 34 | 170 | 35 | 4 | 254 | |
| >$500 | 13 | 94 | 97 | 696 | 219 | 42 | 1,161 | |
| Not known | 833 | 209 | 134 | 235 | 66 | 858 | 2,335 | |
| Total | 1,134 | 4,590 | 3,341 | 4,032 | 898 | 1,015 | 15,010 | |
|
Supported |
||||||||
| No Wage | 3 | 0 | 0 | 2 | 0 | 2 | 7 | |
| $1–$20 | 63 | 968 | 475 | 164 | 0 | 48 | 1,718 | |
| $21–$40 | 42 | 982 | 1,324 | 1,088 | 6 | 89 | 3,531 | |
| $41–$60 | 29 | 345 | 961 | 1,427 | 4 | 76 | 2,842 | |
| $61–$80 | 32 | 199 | 649 | 1,933 | 1 | 98 | 2,912 | |
| $81–$100 | 19 | 91 | 279 | 969 | 2 | 30 | 1,390 | |
| $101–$150 | 21 | 131 | 342 | 1,235 | 6 | 20 | 1,755 | |
| $151–$200 | 8 | 25 | 92 | 438 | 2 | 10 | 575 | |
| $201–$250 | 2 | 13 | 37 | 161 | 1 | 2 | 216 | |
| $251–$300 | 2 | 3 | 24 | 76 | 0 | 1 | 106 | |
| $301–$350 | 1 | 1 | 12 | 38 | 1 | 1 | 54 | |
| $351–$400 | 2 | 0 | 4 | 35 | 0 | 0 | 41 | |
| $401–$450 | 1 | 0 | 2 | 9 | 0 | 0 | 12 | |
| $451–$500 | 0 | 0 | 1 | 6 | 0 | 0 | 7 | |
| >$500 | 1 | 1 | 0 | 25 | 0 | 3 | 30 | |
| Not known | 0 | 39 | 37 | 102 | 2 | 1,211 | 1,391 | |
| Total | 226 | 2,798 | 4,239 | 7,708 | 25 | 1,591 | 16,587 | |
|
Total |
||||||||
| No Wage | 13 | 3 | 2 | 4 | 1 | 3 | 26 | |
| $1–$20 | 94 | 992 | 492 | 177 | 3 | 50 | 1,808 | |
| $21–$40 | 147 | 1,487 | 1,363 | 1,094 | 11 | 92 | 4,194 | |
| $41–$60 | 94 | 1,043 | 1,044 | 1,443 | 16 | 76 | 3,716 | |
| $61–$80 | 59 | 1,266 | 827 | 1,949 | 28 | 101 | 4,230 | |
| $81–$100 | 27 | 633 | 499 | 1,016 | 11 | 36 | 2,222 | |
| $101–$150 | 42 | 1,047 | 1,173 | 1,628 | 69 | 40 | 3,999 | |
| $151–$200 | 13 | 299 | 801 | 825 | 69 | 30 | 2,037 | |
| $201–$250 | 5 | 161 | 413 | 838 | 86 | 17 | 1,520 | |
| $251–$300 | 5 | 67 | 264 | 717 | 118 | 19 | 1,190 | |
| $301–$350 | 8 | 16 | 179 | 418 | 87 | 5 | 713 | |
| $351–$400 | 3 | 16 | 142 | 226 | 64 | 7 | 458 | |
| $401–$450 | 2 | 5 | 78 | 171 | 38 | 12 | 306 | |
| $451–$500 | 1 | 10 | 35 | 176 | 35 | 4 | 261 | |
| >$500 | 14 | 95 | 97 | 721 | 219 | 45 | 1,191 | |
| Not known | 833 | 248 | 171 | 337 | 68 | 2,069 | 3,726 | |
| Total | 1,360 | 7,388 | 7,580 | 11,740 | 923 | 2,606 | 31,597 | |
| Weekly wage | Open | Supported | Total |
|---|---|---|---|
|
2006 |
|||
| No Wage | 19 | 7 | 26 |
| $1–$20 | 90 | 1,718 | 1,808 |
| $21–$40 | 663 | 3,531 | 4,194 |
| $41–$60 | 874 | 2,842 | 3,716 |
| $61–$80 | 1,318 | 2,912 | 4,230 |
| $81–$100 | 832 | 1,390 | 2,222 |
| $101–$150 | 2,244 | 1,755 | 3,999 |
| $151–$200 | 1,462 | 575 | 2,037 |
| $201–$250 | 1,304 | 216 | 1,520 |
| $251–$300 | 1,084 | 106 | 1,190 |
| $301–$350 | 659 | 54 | 713 |
| $351–$400 | 417 | 41 | 458 |
| $401–$450 | 294 | 12 | 306 |
| $451–$500 | 254 | 7 | 261 |
| >$500 | 1,161 | 30 | 1,191 |
| Not known | 2,335 | 1,391 | 3,726 |
| Total | 15,010 | 16,587 | 31,597 |
| Weekly wage | Open | Supported | Dual Open/ Supported |
Total |
|---|---|---|---|---|
|
2005 |
||||
| No Wage | 511 | 21 | 18 | 550 |
| $1–$20 | 220 | 1,932 | 114 | 2,266 |
| $21–$40 | 123 | 4,055 | 184 | 4,362 |
| $41–$60 | 446 | 3,828 | 209 | 4,483 |
| $61–$80 | 824 | 2,966 | 220 | 4,010 |
| $81–$100 | 798 | 1,342 | 116 | 2,256 |
| $101–$150 | 2,444 | 1,422 | 296 | 4,162 |
| $150–$200 | 1,774 | 467 | 114 | 2,355 |
| $201–$250 | 1,772 | 183 | 72 | 2,027 |
| $251–$300 | 1,541 | 121 | 65 | 1,727 |
| $301–$350 | 1,245 | 58 | 41 | 1,344 |
| $351–$400 | 1,099 | 41 | 44 | 1,184 |
| $401–$450 | 1,300 | 15 | 41 | 1,356 |
| $451–$500 | 1,142 | 18 | 49 | 1,209 |
| >$500 | 2,865 | 39 | 68 | 2,972 |
| Total | 18,104 | 16,508 | 1,651 | 36,263 |
|
2004 |
||||
| No Wage | 422 | 14 | 49 | 485 |
| $1–$20 | 164 | 2,103 | 83 | 2,350 |
| $21–$40 | 147 | 4,444 | 200 | 4,791 |
| $41–$60 | 677 | 4,331 | 199 | 5,207 |
| $61–$80 | 680 | 2,693 | 141 | 3,514 |
| $81–$100 | 846 | 1,229 | 114 | 2,189 |
| $101–$150 | 2,552 | 1,222 | 196 | 3,970 |
| $150–$200 | 1,785 | 353 | 97 | 2,235 |
| $201–$250 | 1,922 | 120 | 113 | 2,155 |
| $251–$300 | 1,572 | 83 | 87 | 1,742 |
| $301–$350 | 1,238 | 42 | 61 | 1,341 |
| $351–$400 | 1,162 | 28 | 101 | 1,291 |
| $401–$450 | 1,599 | 12 | 85 | 1,696 |
| $451–$500 | 1,091 | 14 | 50 | 1,155 |
| >$500 | 2,521 | 29 | 144 | 2,694 |
| Total | 18,378 | 16,717 | 1,720 | 36,815 |
|
2003 |
||||
| No Wage | 335 | 79 | 17 | 431 |
| $1–$20 | 187 | 2,216 | 147 | 2,550 |
| $21–$40 | 214 | 4,253 | 168 | 4,635 |
| $41–$60 | 746 | 4,526 | 218 | 5,490 |
| $61–$80 | 637 | 2,587 | 130 | 3,354 |
| $81–$100 | 958 | 1,092 | 117 | 2,167 |
| $101–$150 | 2,505 | 1,058 | 186 | 3,749 |
| $151–$200 | 1,793 | 272 | 145 | 2,210 |
| $201–$250 | 1,927 | 116 | 125 | 2,168 |
| $251–$300 | 1,608 | 68 | 94 | 1,770 |
| $301–$350 | 1,144 | 35 | 73 | 1,252 |
| $351–$400 | 1,181 | 16 | 62 | 1,259 |
| $401–$450 | 1,716 | 13 | 50 | 1,779 |
| $451–$500 | 937 | 17 | 52 | 1,006 |
| >$500 | 2,033 | 16 | 113 | 2,162 |
| Total | 17,921 | 16,364 | 1,697 | 35,982 |
|
2002 |
||||
| No Wage | 147 | 116 | 23 | 286 |
| $1–$20 | 121 | 2,137 | 451 | 2,709 |
| $21–$40 | 229 | 3,831 | 611 | 4,671 |
| $41–$60 | 814 | 4,420 | 310 | 5,544 |
| $61–$80 | 590 | 2,404 | 159 | 3,153 |
| $81–$100 | 995 | 981 | 108 | 2,084 |
| $101–$150 | 2,344 | 882 | 289 | 3,515 |
| $151–$200 | 1,755 | 229 | 190 | 2,174 |
| $201–$250 | 1,780 | 99 | 132 | 2,011 |
| $251–$300 | 1,432 | 57 | 93 | 1,582 |
| $301–$350 | 1,051 | 34 | 78 | 1,163 |
| $351–$400 | 1,213 | 27 | 90 | 1,330 |
| >$400 | 4,133 | 39 | 204 | 4,376 |
| Total | 16,604 | 15,256 | 2,738 | 34,598 |
|
2001 |
||||
| No Wage | 24 | 130 | 10 | 164 |
| $1–$20 | 89 | 2,215 | 460 | 2,764 |
| $21–$40 | 204 | 3,663 | 638 | 4,505 |
| $41–$60 | 704 | 4,657 | 288 | 5,649 |
| $61–$80 | 594 | 2,033 | 183 | 2,810 |
| $81–$100 | 955 | 866 | 143 | 1,964 |
| $101–$150 | 2,116 | 864 | 321 | 3,301 |
| $151–$200 | 1,853 | 233 | 220 | 2,306 |
| $201–$250 | 1,751 | 88 | 168 | 2,007 |
| $251–$300 | 1,358 | 51 | 130 | 1,539 |
| $301–$350 | 1,065 | 25 | 108 | 1,198 |
| $351–$400 | 1,245 | 16 | 83 | 1,344 |
| >$400 | 3,488 | 31 | 227 | 3,746 |
| Total | 15,446 | 14,872 | 2,979 | 33,297 |
8. Glossary of terms
A | B | C | D | E | F | H | I | J | L | M | N | O | P | R | S | T | U | V | W | Y
A
Aboriginal origin – a person who self-identifies, or is identified as, being of Aboriginal heritage.
Aboriginal and Torres Strait Islander origin – a person who self-identifies, or is identified as, being of Aboriginal and Torres Strait Islander heritage.
ABS – Australian Bureau of Statistics.
Acquired brain injury (ABI) – damage to the brain acquired after birth.
ADD – Attention Deficit Disorder. A behaviour disorder usually diagnosed in childhood. The disorder is also commonly called ADHD (Attention-Deficit/Hyperactivity Disorder).
Advocacy services – services specialising in the representation of people with a disability, their views and interests.
Alzheimer's Disease – a type of dementia classified as a neurological disability.
Apprenticeship – a form of paid employment where an individual works for another for a specific amount of time in return for instruction in a trade, art or business.
Auslan – Australian sign language.
Autism – a pervasive developmental disorder characterised by restricted, repetitive and stereotyped patterns of behaviour, and impairment in communication skills and social interactions.
Average standard hours – the standard number of hours worked by a consumer. If standard hours vary, this is an estimate of the average.
Awards/agreements – a written document between an employer and employee about the terms and conditions of employment. Examples of such documents are a certified agreement, an Australian workplace agreement, and an SWS productivity based wage.
Award wage – the minimum legal rate of pay set in the relevant award for a particular occupation.
B
Basis of employment – the basis on which a consumer is employed (e.g. full-time, part-time, casual).
Benefits – monetary payments provided by the government to a consumer (e.g. Disability Support Pension, Newstart/Youth Allowance).
Block Grant Funding – monies paid to an organisation for the purposes of provision of employment assistance to eligible job seekers and workers.
Brain injury/damage – injury to the brain which may have been caused by one or more of the following conditions: head trauma, inadequate oxygen supply or infection.
Business service – another term used to refer to supported employment services.
C
Case Based Funding (CBF) – a funding model which links individual needs to employment outcomes. Financial payments are made to an employment service in accordance with the amount of money deemed necessary to assist a particular individual. CBF includes funding provided through Phase One or Two of the CBF Trial or 2002–03 Growth Funding.
Casual employment – paid employment often characterised by irregular hours and higher hourly rates of pay compared to part- and full-time employment. Casual employment can be either temporary or permanent, and employees are not usually entitled to holiday or sick leave.
Certified agreement – a specifically negotiated workplace agreement.
Cessation reason – the reason a consumer reportedly left a service.
Communication – making oneself understood by others, and understanding others.
Community (civic) and economic life – participating in community life, recreation, human rights and economic life, such as handling money.
Community support – a form of service provided to people with a disability that includes advocacy, information and print disability.
Consumers 'on the books' – the total number of consumers on 30 June 2006 registered as receiving support from a disability employment service.
CSTDA – Commonwealth State Territory Disability Agreement.
D
Days of operation – the days of the week that a service usually operates. If days of operation during the collection week (26 June to 30 June 2006) are not typical for the service, typical hours should be recorded as well.
Deafblind – having sensory impairment to both hearing and sight.
Direct support staff – staff that have direct contact with consumers in a support role.
Disability Support Pension – a form of income support paid by the Australian Government to persons with a specified degree of disability.
Does not need assistance, uses aids – the consumer does not need help or supervision to perform the task, but uses aids and/or equipment.
Does not need assistance, does not use aids – the consumer does not need help or supervision to perform the task, and does not use aids and/or equipment.
Domestic life – home and living skills such as shopping, housekeeping, cooking and home maintenance.
Duration of employment – the length of time an employment service consumer has been employed during the financial year. This is recorded as the number of months and weeks.
E
Effective communication – the ability to express more than basic needs to unfamiliar people (e.g. the exchange of thoughts, messages or information) via speech, signals, writing and/or behaviour.
Eligible job seekers – consumers who have not worked during the reporting period.
Employed (fy) – identifies whether the consumer has had a period of employment during a particular financial year.
Employment service type – the type of employment service an outlet provides. As of November 2004, outlets cannot deliver a dual open and supported service. This means that services can only be open or supported.
Exit date – the date on which an outlet stopped providing service/support to a consumer. This is recorded as ddmmyyyy.
F
FaCS – (Australian Government) Department of Family and Community Services.
FaCSIA – (Australian Government) Department of Families, Community Services and Indigenous Affairs.
FaCSIA funded respite care – a program funded by FaCSIA aimed at increasing the provision of immediate and short–term respite to carers of people with severe/ profound disabilities.
Financial year – the year dated 1 July to 30 June. The financial year for this report is 1 July 2005 to 30 June 2006.
Full award wage – the income set in the relevant award for a particular occupation.
Full-time employment – employment of at least 35 hours a week.
H
Hearing – a disability grouping encompassing deafness, hearing impairment and hearing loss.
Hours – the average number of hours a week worked by a staff member in a disability-related service.
I
Income – any monies given to a consumer by an agency, department or business in exchange for labour or services (i.e. work).
Independent worker – an individual who a service assisted to obtain employment in the previous financial year (i.e. 2004–05) and who continues to work, but who received no employment assistance from the service in this financial year (i.e. 2005–06).
Indigenous origin – a person who is identified as being of Aboriginal and/or Torres Strait Islander origin in response to a verbal or written question.
Indirect support staff – staff that have no, or only a minimal, direct supporting role.
Individualised funding – money paid to a disability employment service on the basis of the needs of an individual consumer. An example of this is case based funding.
Individual workplace agreement – a written agreement between an employer and employee about the terms and conditions of employment.
Information/referral services – services that provide accessible information to people with disability, their carers, families and relevant professionals.
Intellectual disability – a type of disability that involves a deficit in cognitive ability (i.e. the brain is not working to its full age-appropriate capacity). The severity of an intellectual disability can range from minor to profound and may be caused by genetic or environmental factors.
Interpersonal interactions and relationships – forming and maintaining friendships, coping with feelings and behaving within socially accepted boundaries.
Interpreter service – a service that interprets the communication between a consumer and an employment service. Spoken languages other than English and non-spoken communication (e.g. sign language) are interpreted via these services.
J
Job seeker – a consumer who receives support from an employment service to prepare him/her for employment.
L
Language spoken at home – the language spoken by a consumer in their current home.
Last received support – the date when support was last received by the consumer. This is recorded as ddmmyyyy.
Learning disability – a disability grouping used to define persons with significant difficulty in the acquisition and use of listening, speaking, reading, writing and mathematical skills.
Lives alone – consumer lives alone in private or public housing.
Lives with family – consumer lives with family members, foster family or partner.
Lives with others – consumer shares with friends or a carer who is not a family member.
Living arrangements – whom the consumer resides with (i.e. alone or with related or unrelated persons).
M
Main language spoken – the language used most often by the consumer to communicate with other residents or visitors in their current home.
Main source of income – of all sources of income, this is the source of the greatest amount received from an individual agency department or business.
Method of communication – the most effective and common way by which the consumer communicates.
Mobility – ability to move around the home or other environment, including the use of public transport or driving a vehicle.
Mobility Allowance – a form of financial assistance paid by the Australian Government to persons with a significant degree of difficulty with mobility.
N
Neurological disability – a disability grouping used to define persons with impairment of the nervous system occurring after birth. Conditions included under this category are epilepsy, dementia, multiple sclerosis and Parkinson's Disease.
New job seeker – an eligible job seeker who did not receive employment assistance from a service outlet during the previous financial year (i.e. 2004–05).
Newstart/Youth Allowance – a form of income support paid by the Australian Government to young Australians who are studying, undertaking training, looking for work or temporarily incapacitated.
Non-spoken communication – effective ways of communicating that do not include verbal cues such as speaking or murmurs. Examples include the use of sign language, Canon Communicator and Compic.
Non–vocational program – a program that is not designed for vocational training (e.g. study, work experience, work), but rather for recreational purposes (e.g. social outings, sporting activities).
Not known – the consumers' situation in respect to a particular question was not known.
No wage – the consumer did not receive payment for work undertaken.
Number of consumers – the total number of persons who received employment assistance during 2005–06.
Number of consumers 'on the books' – the number of active consumers listed with a service on 30 June 2006.
Number of hours – the average number of hours a consumer worked per week during 2005–06.
Number of months – the number of months a consumer worked during 2005–06.
O
'On the books' – a consumer who, on 30 June 2006, was registered as receiving support from a disability service.
Open employment service outlets – services that provide employment assistance to people with a disability in obtaining and/or retaining paid employment in the open labour market.
Open and supported employment service outlets – employment services that provided both open and supported employment assistance to people with a disability.
Other income – money received by a consumer from an agency department, or business in exchange for labour or services (i.e. work) which is in addition to the consumer's main source of income. Examples include superannuation and dividends/interest from investments.
Other pension/benefit – financial assistance paid by the Australian Government other than the Disability Support Pension, Newstart/Youth Allowance or Mobility Allowance. Such payments might include monies paid to veterans and their families through the Department of Veterans' Affairs. Superannuation is not included in this category.
Other setting of employment – a place of employment that is neither an open nor supported employment setting. For example, self-employed positions or contract work.
Other significant disability group – a disability group that is secondary to the main (or primary) disability registered for a consumer.
P
Paid employment – employment for which a consumer receives an income.
Paid staff – staff who receive an income for being employed at a disability employment service.
Part-time employment – employment of less than 35 hours a week.
Pension/benefit – financial assistance paid by the Australian Government to persons in certain circumstances. An individual's circumstances will determine which pension/benefit they receive. Examples include Disability Support Pension, Newstart/Youth Allowance and Mobility Allowance.
Period of employment – the number of months or weeks a consumer worked in the financial year.
Permanent employment – employment on a continuing basis with leave entitlements.
Phase – the employment status of a consumer on 30 June 2006. Examples include worker, job seeker and work experience.
Physical disability – a type of disability that involves conditions attributable to a physical cause that impact on one's ability to perform physical activities. It includes the effects of paraplegia, quadraplegia, cerebral palsy and spina bifida.
Primary disability group – the category of disability that causes the most difficulty to the consumer.
Print disability services – services that provide alternative formats of communication for people who, by reason of disability, are unable to access printed information.
Private residence – a home that the consumer lives in. It may be a house, flat, unit, caravan or mobile home.
Pro rata – a reduced wage based on the proportion of hours worked out of an equivalent full-time working week.
Productivity based wage – a reduced wage based on a person's productive capacity, and paid under a legal industrial agreement.
Psychiatric disability – a type of disability involving mental health conditions which have recognisable symptoms and behaviour patterns that impair personal and/or occupational/educational functioning. Examples include schizophrenia, depression and anxiety-related disorders.
R
Referrals – those consumers referred to a service by Centrelink or another source.
Residential setting – the type of physical accommodation the consumer usually resides in (usually being four or more days a week).
Respite care – immediate and/or short term care provided to enable some relief to a carer of a person with a with severe or profound disability.
S
Seasonal employment – work in a position or industry that experiences a dramatic employment increase for a defined period of time each year (e.g. fruit picking).
Self-care – undertaking tasks involved in looking after one's self (e.g. eating, bathing, dressing and going to the toilet).
Sensory disability – a type of disability related to one of the senses (e.g. hearing, sight and speech).
Sign language – a form of communication involving hand movements and signals. Examples include Auslan and Makaton.
Specific learning disorder/ADD – a group of disabilities characterised with difficulty in the acquisition and use of listening, speaking, reading, writing, reasoning and/or mathematical skills.
Speech disability – a disability group encompassing loss of speech, impairment and/or difficulty in being understood.
Staff hours – total number of hours worked by staff including volunteers and contract staff during the snapshot week.
Support commencement date – the date a consumer received their first episode of support from a service. This is recorded as ddmmyyyy.
Supported accommodation facility – accommodation which provides board or lodging for a number of people and which has support services provided by rostered care workers, usually on a 24 hour basis.
Supported employment service outlets – services that directly provide support and employment to people with a disability.
Support needs – the degree of a consumer's requirements for help and/or supervision in various areas.
SWS productivity based wage – a productivity based wage determined in accordance with the Supported Wage System.
T
Temporary employment – fixed (usually short) term employment, which includes entitlements to paid holiday and sick leave.
Torres Strait Islander origin – a person who self-identifies, or is identified as, being of Torres Strait Islander heritage.
U
Unpaid staff – unpaid hours worked by staff or volunteers.
V
Visual disability – a disability grouping, which encompasses blindness and vision impairment which is not corrected by prescription glasses or contact lenses.
Vocational program – a program, which prepares a consumer for employment or helps to place them in employment.
Volunteer work – employment that is unpaid.
W
Wage level and conditions – the current relationship of the consumer's wage and conditions to an award/agreement wage.
Weeks of operation – the number of weeks during the 2005–06 financial year that a service operated.
Work experience – a consumer who is undertaking paid or unpaid work experience or a work trial.
Worker – a consumer who is undertaking paid employment.
Worker meeting worker target – a consumer who has worked in paid employment of eight hours a week or more for at least three months.
Worker not meeting worker target – a consumer who has worked in paid employment for less than three months and/or who worked less than eight hours a week.
Working – currently employed.
Working (Support needs indicator) – undertaking actions, behaviours and tasks needed to obtain and retain paid employment.
Workplace agreement – a written agreement between an employer and employee about the employee's terms and conditions of employment.
Y
Youth Allowance – a type of benefit paid by the Australian Government to persons meeting the payment criteria.
List of tables and figures
List of tables
Table 3.2 Distribution of disability service outlets across location, 2005–06
Table 3.4 Number and per cent of employment service outlets across locations, 2005–06
Table 3.5 Number and per cent of employment service outlets within locations, 2005–06
Table 3.6 Number of outlets by service type and average daily hours of operation, 2005–06
Table 3.7 Number of outlets by service type and average days of operation per week, 2005–06
Table 3.8 Number of outlets by service type and weeks of operation, 2005–06
Table 3.9 Number and per cent of FTE staff working in direct or indirect support roles, 2005–06
Table 4.1 Number and per cent of consumers by age and gender, 2005–06
Table 4.2 Number and per cent of consumers by main language spoken at home, 2005–06
Table 4.5 Number and per cent of open employment service consumers by primary disability, 2005–06
Table 4.10 Consumer residential setting, 2005–06
Table 4.11 Consumer living arrangements, 2005–06
Table 4.14 Employed consumers: consumer wage type, 30 June 2006
Table 1A Staff hours by disability service type and jurisdiction, 2005–06
Table 2A Staff hours in employment service outlets, by jurisdiction and service type, 2005–06
Table 4A All consumers: country of birth by jurisdiction and employment service type, 2005–06
Table 5A All consumers: main language spoken at home by jurisdiction, 2005–06
Table 6A All consumers: need for interpreter by jurisdiction and employment service type, 2005–06
Table 7A All consumers: employment service type across gender and jurisdiction, 2005–06
Table 9A All consumers: need for support/assistance by primary disability and life area, 2005–06
List of figures
Figure 3.1 Number (and per cent ) of disability service outlets by type of service, 2005–06
Figure 4.1 Per cent of males and females across disability employment service type, 2005–06
Figure 4.2 Per cent of consumers by disability employment service type and age group, 2005–06
Figure 4.3 Per cent of consumers across primary disability groups, 2005–06
Figure 4.4 Main income source, 2005–06
Figure 4.5 Employment phase of employed consumers 'on the books', by service type, 30 June 2006
Figure 4.6 Disability employment service type by basis of employment, 30 June 2006
Figure 4.9 Per cent of employed consumers by primary disability group and wage level, 30 June 2006
Last updated: