Income Management (IM) and enhanced IM – Participant Data
Attachments
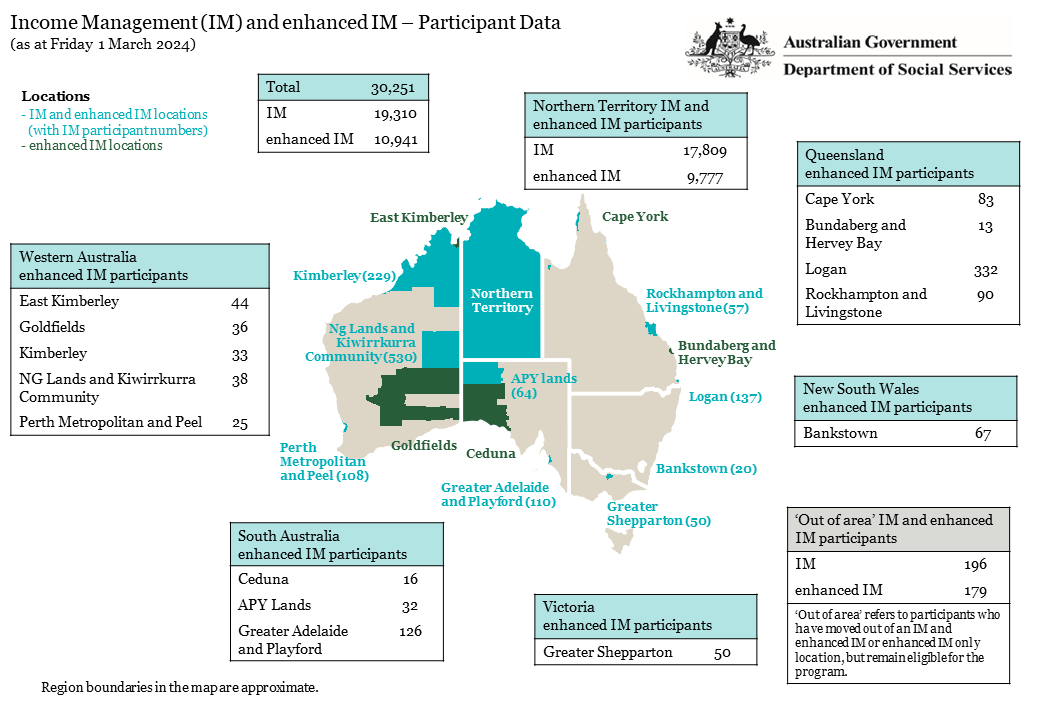
- Total (30,251)
- IM (19,310)
- enhanced IM (10,941)
Northern Territory IM and enhanced IM participants
- IM (17,809)
- enhanced IM (9,777)
Western Australia (WA) enhanced IM participants
- East Kimberley (44)
- Goldfields (36)
- Kimberley (33)
- NG Lands and Kiwirrkurra Community (38)
- Perth Metropolitan and Peel (25)
Queensland (QLD) enhanced IM participants
- Cape York (83)
- Bundaberg and Hervey Bay (13)
- Logan (332)
- Rockhampton and Livingstone (90)
South Australia (SA) enhanced IM participants
- Ceduna (16)
- APY Lands (32)
- Greater Adelaide and Playford (126)
Victoria enhanced IM participants
- Greater Shepparton (50)
New South Wales enhanced IM participants
- Bankstown (67)
Locations
IM and enhanced IM (with participant numbers)
- Kimberley (33)
- Ng Lands and Kiwirrkurra Community (38)
- Perth Metropolitan and Peel (25)
- APY lands (32)
- Greater Adelaide and Playford (126)
- Rockhampton and Livingstone (90)
- Logan (332)
- Bankstown (67)
- Greater Shepparton (50)
Enhanced IM only
- East Kimberley
- Goldfields
- Ceduna
- Cape York
- Bundaberg and Hervey Bay
‘Out of area’ IM and enhanced IM participants
- IM (196)
- enhanced IM (179)
‘Out of area’ refers to participants who have moved out of an IM and enhanced IM or enhanced IM only location, but remain eligible for the program.
Last updated: