Pension Review Background Paper
The Minister for Families, Housing, Community Services and Indigenous Affairs has asked the Secretary of FaHCSIA, Dr Jeff Harmer, to complete an investigation into measures to strengthen the financial security of seniors, carers and people with disability, including a review of the Age Pension, Carer Payment and Disability Support Pension. This review is part of the Government’s wider inquiry into Australia’s Future Tax System, chaired by the Secretary to the Treasury, Dr Ken Henry.
Context
Many people who rely on the income support system for a basic acceptable standard of living say that they are finding it harder to make ends meet.
The Senate Standing Committee on Community Affairs has drawn attention to the financial circumstances of older Australians with few assets who do not own their own home, particularly singles, private renters, and those with a limited capacity to work and/or save for retirement. Many of these people have a long-term reliance on the income support system. The committee recommended the Government review the suitability of the base pension levels through economic analyses of amounts required to achieve at least a modest standard of living for retired Australians.
The Government recently introduced a number of changes including one off payments to seniors and carers and an increase in the Utilities Allowance from $107 to $500 and its extension to disability support pensioners and carers in recognition of some of the pressures identified in the Senate Committee report.
Terms of reference
The Pension Review Background Paper provides information to help people understand how well the income support system works for those who rely on it. It addresses the Review’s three key terms of reference
- the appropriate levels of income support and allowances;
- the frequency of payments; and
- the structure and payment of concessions or other entitlements.
Principles of the social security system
The social security system redistributes Government revenue collected in the tax system to individuals and families to increase the wellbeing of the Australian population. It is part of a broader social protection system that includes direct expenditure on services and infrastructure (such as health, education and community services), the superannuation system—which complements the Age Pension in Australia’s retirement income system—and payments, services and investment to promote the efficient and effective functioning of the Australian economy which underpins individual and national wellbeing.
To work effectively, in addition to supporting a basic acceptable standard of living, taking into account prevailing community standards, the income support system has to:
- give greater assistance to those with additional costs either through transfer payments or services;
- target payments to those not able to fully support themselves;
- promote participation and self-provision through services, incentives to work and save, and obligations; and
- be sustainable.
Key Facts
Around 4.6 million Australians receive an income support payment of some kind from the Australian Government in the form of a pension or allowance (27 per cent of the population aged 15 years and over):
- in 2006–07, Australian Government expenditure on the income support system was $71.6 billion, or around 6.8 per cent of GDP
- 77 per cent of Australians over the age of 65 receive income support, and 17 per cent of Australians aged 16–64 years
- 59 per cent of income support recipients are women, and 58 per cent are single.
Australia’s population is ageing: 13 per cent of Australians are over 65 years now, growing to 25 per cent by 2047.
Even with the maturing of the superannuation system the proportion of retired Australians who receive the Age Pension will only decline slightly although many more will receive a part-pension in addition to their private income rather than relying upon the pension alone.
Many pensioners rely on income support for long periods. The average total time on income support of current Age Pensioners is 13.1 years. For Disability Support Pensioners, it is 10.8 years and for Carer Payment recipients it is 7.6 years. In most cases, these pensioners have moved on to their current payment from another income support payment.
Pension rates have grown by more than 2 per cent a year above inflation over the last decade, which is slower than average households (3 per cent), but higher than low wage earners (1 per cent).
The single rate of pension is 60 per cent of the combined couple rate, lower than the average for major OECD countries (63 per cent).
Most pensioners have low incomes: over half have less than $20 a week of private income, but some have higher incomes; 5 per cent have private incomes of over $400 a week.
Most pensioners do not have substantial savings or other assets: over half have assessable assets (excluding the family home) under $30,000 and 30 per cent report having bank balances of less than $1,000, but some have higher assets with 5 per cent reporting assessable assets over $250,000. Pensioners are able to receive some pension with assets up to around $1,000,000.
The family home is a major form of savings for seniors: 61 per cent of Age Pensioners are homeowners; among Age Pensioner couples, 83 per cent are homeowners.
Few pensioners participate in work to supplement their payments: 4 per cent of Age Pensioners, 12 per cent of Disability Support Pensioners and 11 per cent of Carer Payment recipients.
Consultation
The Government has announced a public consultation process to ensure that individuals and community organisations can contribute to the work of the Pension Review. A series of public meetings in capital cities and major regional centres will commence in Darwin on 19 August. A written submission process has also been announced to allow the widest possible participation.
Acronyms
| ABS | Australian Bureau of Statistics |
| ALCI | Analytical Living Cost Index |
| ATI | Adjusted Taxable Income |
| CA | Carer Allowance |
| CCB | Child Care Benefit |
| CDAP | Child Disability Assistance Payment |
| CP | Carer Payment |
| CPC | Combined Pensioner Couple |
| CPI | Consumer Price Index |
| CSHC | Commonwealth Seniors Health Card |
| CSTDA | Commonwealth State Territory Disability Agreement |
| DEEWR | Department of Education, Employment and Workplace Relations |
| DSP | Disability Support Pension |
| DVA | Department of Veterans' Affairs |
| EdEP | Education Entry Payment |
| FaHCSIA | Department of Families, Housing, Community Services and Indigenous Affairs |
| FTB | Family Tax Benefit |
| GDP | Gross Domestic Product |
| HACC | Home and Community Care |
| HCC | Health Care Card |
| HILDA | Household Income and Labour Dynamics in Australia |
| MAA | Mature Age Allowance |
| MTAWE | Male Total Average Weekly Earnings |
| NSA | Newstart Allowance |
| OECD | Organisation for Economic Co-operation and Development |
| PA | Partner Allowance |
| PCC | Pensioner Concession Card |
| PES | Pensioner Education Supplement |
| PhA | Pharmaceutical Allowance |
| RA | Rent Assistance |
| RAA | Remote Area Allowance |
| SCA | Seniors Concession Allowance |
| SDAC | Survey of Disability, Ageing and Carers |
| TAL | Telephone Allowance |
| UA | Utilities Allowance |
| WA | Widow Allowance |
| YA | Youth Allowance |
Introduction
On 15 May 2008, the Minister for Families, Housing, Community Services and Indigenous Affairs, the Hon. Jenny Macklin MP, announced that the Secretary of the Department of Families, Housing, Community Services and Indigenous Affairs (FaHCSIA), Dr Jeff Harmer, would lead a review into measures to strengthen the financial security of seniors, carers and people with disability. This would include a review of the Age Pension, Carer Payment and Disability Support Pension as part of the Government's wider inquiry into Australia's Future Tax System, chaired by Dr Ken Henry.
Recent rises in cost of living pressures have led to concerns that people on low incomes—particularly those who are dependent on the maximum rate of pension and have few assets—may be finding it harder to make ends meet. The recent Senate Standing Committee on Community Affairs' inquiry into cost of living pressures on older Australians found that people on low incomes are disproportionately affected by rises in the cost of petrol, food, medical care and rental accommodation. It also found the maximum rate of pension may be insufficient to maintain a basic, decent standard of living, and those most at risk of financial stress are single pensioners receiving the maximum rate of pension and living in private rental accommodation. The committee acknowledged that certain groups are more likely to be wholly reliant on pensions, including older women, people with severe disability or chronic illnesses, and those whose earning ability has been limited by their caring responsibilities.
The Pension Review will investigate the appropriate levels of income support and allowances, the frequency of payments and the structure and payment of concessions or other entitlements for Age Pension, Disability Support Pension and Carer Payment recipients. The review will carefully examine options for reforming the pension system to ensure that any changes are sustainable in the long term.
The Pension Review Background Paper is designed to support the public consultation and submission process for the Pension Review. All interested people are encouraged to participate in the public consultation. Details about the consultation process and how to get involved are available on the FaHCSIA website at www.fahcsia.gov.au. The Pension Review will be completed by February 2009. The broader inquiry into Australia's Future Tax System will conclude by the end of 2009.
The wider inquiry into Australia's Future Tax System will consider improvements to the tax and transfer payment system for individuals and working families. This will include consideration of the relationships of the tax system with the transfer system and other social support payments, rules and concessions, with a view to improving incentives to work, reducing complexity and maintaining cohesion. Consultations will also be undertaken as part of the broader review. Further information on the Australia's Future Tax System review, including a copy of the architecture paper, is available on the tax review web site at www.taxreview.treasury.gov.au.
Readers of this background paper may also be interested in the report of the Senate Community Affairs Committee, A decent quality of life. On 20 March 2008 the committee released this report into the cost of living pressures on older Australians. The report made 15 recommendations to improve the financial wellbeing of older Australians.
The House of Representatives Standing Committee on Family, Community, Housing and Youth is also conducting an inquiry into Better support for carers, which was launched on 1 May 2009. More information, including copies of submissions to the inquiry, is available on its web site at http://www.aph.gov.au/house/committee/fchy/carers/index.htm.
1. Background
1.2 Income support in Australia
1.1 Scope of the review
The Minister for Families, Housing, Community Services and Indigenous Affairs has asked the Secretary of FaHCSIA, Dr Jeff Harmer, to complete an investigation into measures that might be adopted to strengthen the financial security of seniors, carers and people with disability, and to report by 28 February 2009 on the:
- appropriate levels of income support and allowances, including the base rate of the pension, with reference to the stated purpose of the payment
- frequency of payments, including the efficacy of lump sum versus ongoing support
- structure and payment of concessions or other entitlements that would improve the financial circumstances and security of carers and older Australians.
In addition, the Pension Review will inform the inquiry into Australia's Future Tax System through Dr Harmer's membership of the tax review panel. The inquiry has the broader role of reporting on 'improvements to the tax and transfer system for individuals and working families, including those for retirees'.
This discussion paper has three sections:
- Section 1 is an overview of Australia's income support system
- Section 2 outlines some key issues relating to the investigation's terms of reference
- Section 3 outlines key trends and characteristics of income support recipients.
While the focus of the Pension Review is on Age Pension, Carer Payment and Disability Support Pension, information is provided at various points on the income support system as a whole to recognise the flow-on issues for other payments.
There are many linkages between Age Pension, Carer Payment and Disability Support Pension and the broader income support system:
- many seniors, carers and people with disability receive one of the above payments or another income support payment, such as a Department of Veterans' Affairs (DVA) payment, and/or supplementary payments
- many of the policy settings that apply to these payments also apply to the other major income support payments (Parenting Payment, Newstart Allowance, Youth Allowance and the Service Pension) and affect the level of supplementary payments such as Rent Assistance and family assistance
- many recipients of the Age Pension, Disability Support Pension and Carer Payment are partnered with a person who receives one of these payments and their household income reflects the settings of both payments, in addition to Family Tax Benefit (FTB) if they have children
- a number of the supplementary and bonus payments available to people who get Age Pension, Carer Payment and Disability Support Pension are also available to people who receive other payments
- differences between payments add to the complexity people face in accessing support and can create incentives for people to gain access to payments which they perceive to be more favourable. In addition, many people move between payments as their circumstances change.
1.2 Income support in Australia
In 2006–07, Australian Government expenditure on the transfer system was $71.6 billion, or around 6.8 per cent of Gross Domestic Product (GDP). The largest program of expenditure was assistance for the aged at $26.1 billion.
Around 4.6 million Australians receive a pension or an allowance from the Australian Government as income support. Many more receive cash transfer payments for their families through the FTB, or may be eligible for concession cards or other assistance.
While for some these transfers supplement their own income from employment or savings, for others their pension or allowance is the sole source of income. Obviously, the settings and rates for income support are very important for people largely or wholly reliant on the system, particularly when they also have long durations on income support.
FaHCSIA, the Department of Education, Employment and Workplace Relations (DEEWR) and DVA are each responsible for a number of payments. These are mainly delivered through Centrelink, part of the Human Services portfolio, and DVA.
The largest payment is the Age Pension, which around two million older Australians receive, followed by the Disability Support Pension, with more than 700,000 recipients. While 3.5 million people receive payments classified as pensions, one million receive payments classified as allowances. Table 1 outlines the numbers of people receiving payments, and more information on payments is available in Section 1.2.3 and at Appendices A, B, C and D.
| Payments | Male | Female | Total |
|---|---|---|---|
| Pensions | |||
| Age Pension | 815,900 | 1,136,800 | 1,952,700 |
| Disability Support Pension | 413,400 | 300,800 | 714,200 |
| Parenting Payment Single | 26,000 | 369,500 | 395,500 |
| Carer Payment | 38,100 | 78,500 | 116,600 |
| Wife Pension | 0 | 35,300 | 35,300 |
| Widow B Pension | 0 | 700 | 700 |
| Bereavement Allowance | 100 | 500 | 600 |
| Service Pension | 112,600 | 98,000 | 210,600 |
| DVA Income Support Supplement | 100 | 84,400 | 84,500 |
| 1,406,200 | 2,104,500 | 3,510,700 | |
| Allowances | |||
| Newstart Allowance | 262,700 | 155,100 | 417,800 |
| Youth Allowance—Full-time study | 119,000 | 144,300 | 263,300 |
| Youth Allowance—Other | 34,600 | 34,100 | 68,700 |
| Parenting Payment Partnered | 12,700 | 131,700 | 144,400 |
| Widow Allowance | 0 | 40,200 | 40,200 |
| Partner Allowance | 4,600 | 41,400 | 46,000 |
| Austudy | 15,100 | 13,200 | 28,300 |
| Abstudy | 15,900 | 18,200 | 34,100 |
| Exceptional Circumstances Relief Payment | 23,000 | 5,600 | 28,600 |
| Sickness Allowance | 4,800 | 2,800 | 7,600 |
| Special Benefit | 3,100 | 3,100 | 6,200 |
| Mature Age Allowance | 5,000 | 0 | 5,000 |
| Farm Family Restart | 200 | 0 | 200 |
| 500,700 | 589,700 | 1,090,400 | |
| Total income support | 1,906,900 | 2,694,200 | 4,601,100 |
| Other payments/supplements | |||
| Family Tax Benefit Part A | 178,500 | 1,590,600 | 1,769,100 |
| Family Tax Benefit Part B | 154,800 | 1,222,100 | 1,376,900 |
| Baby Bonus | 286,800 | ||
| Carer Allowance | 96,000 | 297,300 | 393,300 |
| Mobility Allowance | 29,800 | 24,700 | 54,500 |
| Double Orphan Pension | 200 | 1,100 | 1,300 |
| Commonwealth Seniors Health Card | 318,300 | ||
| Low Income Health Care Card | 364,200 | ||
| DVA Disability Pension (a) | 133,400 | 6,300 | 139,700 |
| War Widows (a) | 300 | 110,300 | 110,600 |
Around 59 per cent of income support recipients are women, with higher proportions among the pension population. Around half the income support population is aged under 63 years and around 58 per cent are paid as a single person. The characteristics and circumstances of people receiving income support are considered in more detail in Section 3. As is shown in Section 3.3.3, many people on income support rely on it for long periods. This is particularly evident for Age Pension and Disability Support Pension recipients.
1.2.1 Purpose and principles of the social security system
In essence, the social security system redistributes Government revenue collected in the tax system to individuals and families to increase the wellbeing of the Australian population. It is part of a broader social protection system that includes direct expenditure on services and infrastructure (such as health, education and community services), the superannuation system—which complements the Age Pension in Australia's retirement income system—and payments, services and investment to promote the efficient and effective functioning of the Australian economy, which underpins individual and national wellbeing.
The social security system primarily supports the broader social protection system by providing a safety net for Australians without the means to achieve a basic acceptable standard of living. However, there are other ways in which the design of the system helps Australians manage risk and change—for example, by providing security through periods of transition, such as the breakup of a relationship or a period of bereavement.
While the focus of the review is on appropriate levels of support and the frequency and structure of Age Pension, Disability Support Pension and Carer Payment, the social security system plays a key role in advancing the objectives of the broader social protection system, such as social and economic inclusion.
1.2.2 Design principles
The social security system has to balance a number of objectives, and it reflects the accumulation of past initiatives that responded to the social and economic pressures of the time. In looking across the system, it could be said there are five key principles underpinning its design.
It supports a basic acceptable standard of living, accounting for prevailing community standards. Payments are not related to past earnings and do not compensate for pain, suffering or loss of amenity.
It is equitable. It treats people in similar circumstances similarly. Those with additional costs are given greater assistance either through transfer payments or services to help them achieve a similar living standard. In some circumstances, these additional costs are recognised across a range of income levels.
It targets payments to those not able to fully support themselves. Those with their own resources and therefore the capacity to support themselves do not have the same need for transfers. Income and assets tests are used to reduce payments for people with private resources.
It promotes participation and self-provision through a combination of:
- services and assistance to help people deal with disadvantage (including disability, caring, improving skills and seeking work)
- incentives to work to provide for current needs and for retirement —for example, through contributions to superannuation
- obligations to work and to seek suitable work for those who are expected to, and the use of private savings to support themselves for those with savings.
It is sustainable. The broad community accepts that those who receive social security payments are in genuine need and that the overall system is affordable across the economic cycle and in the long run, given the ageing of the population.
1.2.3 Design features of current system
Governments have given a different emphasis to these principles at different times. These principles must be balanced against each other, because there are significant tensions between them. This has created six key features of the Australian system that together define its distinctive character (as opposed, for example, to the social insurance models used in OECD countries where individuals receive benefits based on contributions and/or prior earnings):
- categories of eligibility
- rates of payment
- income and assets testing
- obligations
- supplementary payments
- services and concessions.
While many of these design features also apply to payments made by DVA, such payments also have a more specific objective which is to compensate veterans and their dependents for the effects of war or defence service.
Categories of eligibility
The aim of ensuring that everybody in the community achieves a basic standard of living has to be balanced with the expectation that those with the capacity to support themselves will do so. To do this, the social security system supports people only if they meet eligibility criteria based on their ability and availability to work or if the community expects they do not have to work to support themselves.
For working age people, Newstart Allowance is paid on the basis that a person is expected to actively seek and accept suitable work, consistent with their ability and availability. However, some groups are not expected to work. This may be because they:
- have already reached a specific age (Age and Service Pensions) or experienced a recent bereavement (Bereavement Allowance)
- are undertaking a significant caring role and are not expected to look for or accept additional work (Carer Payment and Parenting Payment)
- are undertaking an activity that will improve their long-term ability to work (Youth Allowance [Student], Austudy and Abstudy)
- are unable to undertake significant part-time work due to disability (Disability Support Pension)
- are unable to work or study due to illness, but they have employment or study to return to (Sickness Allowance).
While not all groups are expected to work, individuals are encouraged to work, where this is appropriate to their circumstances, and payments are structured to enable them to gain financially from this participation.
The balance between providing support and the expectation that those with the capacity to support themselves do so works out differently for these different groups. Broadly, payments fall into two groups: pensions and allowances (formerly referred to as benefits). Pensions are generally paid at higher rates with more relaxed means tests. Allowances are paid at lower rates with tighter means tests.
The differences in the rates and conditions of pensions and allowances partly reflects the different rationale for allowances, which historically have been designed to provide temporary assistance, and pensions, which are for longer term assistance.
Details of social security system eligibility categories are at Appendix A. Details of expenditure and recipients of payments are at Appendix B.
Rates of payment
The rates of income support given to each individual have to balance providing a basic acceptable standard of living, promoting equity between individuals and providing incentives for people to support themselves where possible. They must also be sustainable.
The income support system pays a higher rate to single people than to each member of a couple. This recognises that a single person living alone usually does not have the economies of sharing household expenses commonly experienced by a couple. The single rate is currently 60 per cent of the combined couple rate.
Some rates of payment for younger people and students assume that, even when single, these people share accommodation or could reasonably be expected to do so.
The maximum rate of pension for 20 March to 19 September 2008 is:
- $546.80 per fortnight for a single person (or around $14,216 per annum)
- $456.80 for each member of a couple (or around $11,876 per annum).
The equivalent rates for allowances for the same period are:
- $437.10 or $472.80 for singles (or around $12,292 per annum at the higher rate). The higher rate is paid to those with a dependent child or aged 60 or over after nine months
- $394.40 per fortnight for each member of a couple (or around $10,254 per annum).
The lower rates of allowances provide incentives to work but also make pension payments relatively attractive.
People with substantial levels of care of dependent children have access to FTB to assist with the additional costs of children. FTB payments can also constitute a significant proportion of a family's income. At June 2007, around 68,000 recipients of Age Pension, Carer Payment or Disability Support Pension were also receiving FTB for dependent children in their care.
In the current system, improvements in community living standards achieved through the productivity gains of the labour force are passed on to pension payments through benchmarking the maximum rate of single pension to 25 per cent of Male Total Average Weekly Earnings (MTAWE). MTAWE benchmarking applies to Age Pension, Carer Payment, Disability Support Pension (and other pensions) and indirectly to FTB. Other payments are indexed by the Consumer Price Index (CPI) to maintain purchasing power in line with overall price changes across the community.
Details of rates of payment are at Appendix C and supplementary payments at Appendix D. Indexation arrangements are described at Appendix E and historical trends in transfer payment are outlined in Appendix F.
Income and assets testing
Separate income and assets tests assess the personal resources available to income support recipients and calculate how much assistance is payable. Both tests aim to capture all income and assets of pensioners and allowees. However, in practice income from different sources is treated differently to encourage particular outcomes or equalise treatment between groups (for example, income from superannuation is assessed differently to income from shares). There is also a series of exemptions, the most significant being the exemption of the family home from the assets test (although higher assets test thresholds apply for recipients who do not own a home).
The primary goal of these arrangements is to target assistance to those most in need. This ensures that the system remains sustainable, both fiscally and in terms of community support. However, the arrangements also provide incentives for self-provision by rewarding workforce participation and saving. To balance these two principles, the social security system uses income and assets free areas and tapered income tests (and tapered assets tests for pensions) to attempt to ensure that those making the effort to provide for themselves are better off when they work or get more income from their savings.
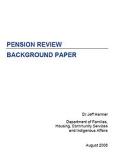
Chart 1 shows how the two components of the income test operate—an initial 'free area' where private assessable income has no impact on the rate of pension or allowance, and then a taper over which the amount of payment paid is reduced as the person has higher levels of private income. The rate of the taper varies between payments, but in all payments (other than Special Benefit) it is designed so people gain an increase in total income as private income increases. This basic architecture also means the full value of increases in the maximum rate of pension, whether by indexation or ad hoc, flow to all pensioners across the income distribution and result in additional people who may have been excluded due to their level of income becoming eligible for a part pension.
Chart 1. Illustration of the operation of the income test
Because the income support system's interactions with the labour market, and the retirement income system's interactions with superannuation, are important to the way Australians manage risk and change, incentives have been a focus for policy development.
In the last 14 years there have been major changes to income and assets tests. They have been relaxed to improve returns from work and incentives to save for retirement. These relaxations increased payments to those with private income and assets, and allowed others in this group to access income support for the first time.
The pension income test taper rate was lowered from 50 per cent to 40 per cent in July 2000 when the GST was introduced to improve work and savings incentives. Currently, a pensioner couple can have up to $66,000 a year in assessable income and receive some pension.
The pension assets test taper rate was halved from 20 September 2007 to increase incentives for saving for retirement and workforce participation as part of superannuation reforms. Under this change, pensions are now reduced by $1.50 per fortnight for each $1,000 in assets above the free area. The change means a homeowner couple can have up to $856,000 in assessable assets (in addition to the exempt home) and receive some pension. Prior to the change the limit was $531,000.
Under changes in 1995 and 2006, allowance income test taper rates have been lowered. They were initially reduced from 50 and 100 per cent withdrawal rates before July 1995 to a taper of between 50 and 70 per cent. In July 2006 these were further reduced to 50 and 60 per cent to improve incentives for part-time work for second earners and as a pathway to full-time employment.
While the income and assets tests reduce payments to people earning additional income, elements of the social security system support and reward participation to reinforce the benefits of self-provision. These include:
- Working Credit, which encourages income support recipients under Age Pension age who have accumulated sufficient credits to take up full-time, part-time or irregular casual work by allowing them to keep more of their income support payments when starting work
- Pension Bonus Scheme, which encourages people to stay in the workforce longer by providing a lump-sum payment to those continuing to work instead of those claiming a pension after Age Pension age
- concession cards, which can be retained for a period if a person aged under Age Pension age leaves payment due to their own or their partner's earnings
- Disability Support Pension with return-to-work 'suspension' provisions, which allow recipients who leave payment due to earnings to return to payment within two years (if they later cease work or reduce their earnings below the income test limit)
- Carer Payment arrangements, where recipients can participate in employment, education, training or unpaid voluntary work for up to 25 hours a week without it affecting their eligibility (increased from 20 hours a week before April 2005 and 10 hours a week before July 1997)
- a range of offsets within the personal taxation system that operate to reduce the effective tax rate on income for income support recipients and low-income earners. For example, in 2007-08 a single Age Pension recipient did not pay tax until their income exceeded $25,867.1
Other features of the income support system seek to ensure that different circumstances of households in providing support are accounted for. For members of a couple, for example, the partner's income and assets are taken into account on the basis that they are expected to share resources. In the case of family assistance and some young people on Youth Allowance or Abstudy, a parental income test recognises that parents are generally expected to support dependent children. Reflecting the exemption of the family home from the assets test for owner occupiers, non-homeowners have a higher assets test free area.
Details of income and assets testing are at Appendix C.
Obligations
While the income and assets tests provide incentives, obligations also play a complementary role in reinforcing the expectation that those who can support themselves do so. Obligations add integrity and sustainability to the social security system by assuring the community that assistance is provided only to those taking reasonable steps to support themselves.
There are broadly three types of obligations.
- Activity testing arrangements ensure that those with a capacity for work and who are expected to work undertake activities that will maximise their chances of finding and taking up suitable work. Activity testing only applies to Newstart Allowance, Youth Allowance and Parenting Payment recipients with a youngest child aged 6 to 15 years.
- Income test rules ensure that those who have financial resources use them to support themselves. The liquid assets waiting period means applicants for certain allowance payments—Newstart Allowance, Sickness Allowance, Youth Allowance and Austudy—have to serve a waiting period of up to 13 weeks if they have liquid assets (such as bank savings) over certain levels. Gifting rules mean income support recipients who give away assets or income above a threshold value may continue to have the value of the gift included in their assessed assets for five years and deemed to earn income in the same way as a financial asset.
- Direct and indirect obligations to support children. Under the Child Support system non-resident parents are obliged to support their children. More recently, the development of income management approaches ensures people who get payments use them for the purposes for which they were provided.
Supplementary payments
Supplementary payments provide a way of ensuring that people with additional costs achieve a similar standard of living.
Supplements recognise specific costs faced by particular groups which have not otherwise been met through direct services and which cannot reasonably be met out of the basic payment alone. For example, Rent Assistance recognises that people in the private rental market can face higher costs than people who own their own home. Apart from some payments in the DVA's system, supplements have not been used to compensate for pain and suffering or loss of amenity.
Supplements have also been used to compensate for changes in government policy (Pharmaceutical Allowance to compensate pensioners for the introduction of the co-payment for prescription medicines in the early 1990s) and to deliver assistance on a different frequency from the fortnightly pension payments and recognise specific costs, such as Utilities Allowance and Telephone Allowance.
From 20 March 2008, the Australian Government increased Utilities Allowance to $500 per annum for singles or for couples combined and increased the Seniors Concession Allowance from $218 a year to $500 a year for around 320,000 Commonwealth Seniors Health Card holders and certain Gold Card holders. While the Utilities Allowance is paid at the same rate for singles or couples—that is, $500 for singles and $250 for each member of a couple—the Seniors Concession Allowance is paid at a flat rate of $500 to both singles and each member of a couple. Also from 20 March 2008, the Government increased the rate of Telephone Allowance from $88 a year to $132 a year for around 800,000 veterans, income support recipients of Age Pension age, Commonwealth Seniors Health Card holders and recipients of Carer Payment and Disability Support Pension who have a home Internet connection.
In addition to these longer standing supplementary payments, government has, from time to time, paid bonuses to some social security recipients at the end of the financial year. Some payments are made regularly (such as the Child Disability Assistance Payment and FTB supplements) and others are ad hoc (such as the Seniors Bonus and the Carer Bonus).
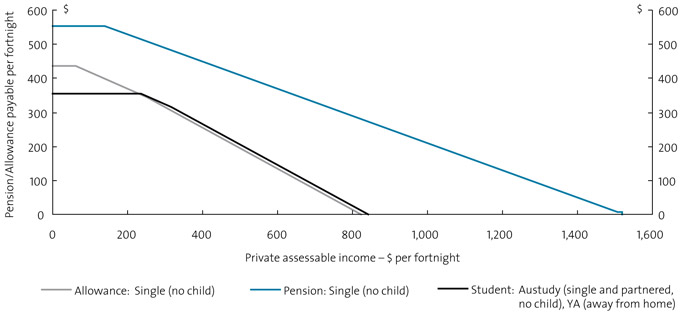
In combination, these supplementary and bonus payments have increased the total amount provided to many income support recipients well above the base rate of payment. The bonuses have also significantly altered the relationship between various income support packages received by different groups, and created incentives to access particular payment types.
Chart 2 illustrates the different levels of support given to different categories of beneficiary.
Chart 2. Income support packages for selected single recipients, June 2008
Details of supplementary payments are at Appendix D. Further information on ad hoc lump sum payments is at Appendix G.
Services and concessions
The social protection system includes payments, services, concessions and subsidies. Services and concessions (through discounted fees and user charges) have an important impact on the wellbeing of income support recipients and other low-income households. Concessions and services that are directly linked with the receipt of Australian Government pensions and allowances (for example, through concession cards) can also enhance the total value of these payments. As such, the loss of support when paid work is undertaken can be greater than just the withdrawal of the primary payment. To address this, concession cards are available for a period on return to work, and alternative concession cards are available to some beyond the pension and allowance cut-outs.
Services and concessions have three main roles:
- to directly lower the cost of living for income support recipients and other low-income households by reducing the costs of goods and services they need to buy. Such reductions relate to a wide range of government, and often private sector, services and charges
- to ensure and promote access to key and essential services, including health, considered necessary for a basic quality of life and to enable people to fully participate in society
- to respond to the wide range of needs and circumstances of income support recipients. For example, different types of disability require different health, disability and other services. Through direct service provision the costs associated with such services can be met by government and targeted to those who need them.
One mechanism used for accessing services and concessions are concession cards, which provide discounts to cardholders at the point of access to the good or service. These concessions include discounts on prescription pharmaceuticals (funded by the Australian Government), and public transport, rates, utilities and motor vehicle assistance (provided by state, territory and local governments). Pensioner Concession Card holders, Health Care Card holders and Seniors Concession Card holders receive different concessions, as outlined in Appendix H. Section 2.3.1 discusses how social assistance in kind is distributed. Unlike other components of support, such as payments which taper away with increasing incomes, concession cards are usually retained until the person extinguishes all entitlements. Because the loss of the card may result in a sharp drop in the overall level of assistance received while on income support, this can produce strong incentives for people to remain eligible for quite low rates of payment, only leave payment for employment for a short period, or take other actions to ensure retention of the concession card.
Because the value of concessions and subsidies is targeted to usage, discounts can contribute to the equity principle by providing the greatest benefit to those who make more use of services such as pharmaceuticals or public transport. Some private companies also use concession cards to target price discounts. However, given that the value of concessions increases with consumption, concessions can also provide a greater benefit to those with more private resources.
2. Terms of reference
2.2 Frequency of payments, including the efficacy of lump sum versus ongoing support
2.1 Appropriate levels of income support and allowances, including the base rate of the pension, with reference to the stated purpose of the payment
Chapter 1 noted that providing a basic standard of living for those not able to support themselves is a key principle of the income support system. Every citizen should be able to meet their basic needs and participate in Australian society.
The benchmarking of pension payments to 25 per cent of the MTAWE links pension rates to community living standards. In effect the provisions operate as an adequacy benchmark. Chapter 3 illustrates how this approach has driven real increases in pension rates.
The first terms of reference poses the question: do the current rates and the 25 per cent of MTAWE benchmark meet the objectives of the system?
This issue is particularly important for those who are wholly reliant on income support and do not have private income and assets to assist with cost of living pressures, for example:
- some people with disability may be dependent on Disability Support Pension for most of their adult lives
- carers of children with disability who, because of their caring responsibilities, may not have the opportunity to work for many years and build up assets
- people with disrupted work histories may not have been able to save for their retirement or purchase a home.
Chapter 3 provides data on private income and asset levels for a number of income support groups.
These settings are significant for people who have to rely on income support for long periods. Chapter 3 also provides information on income support durations and movement between payments. The average durations of current recipients on income support is 13.1 years for Age Pension, 10.8 years for Disability Support Pension and 7.6 years for Carer Payment recipients. The proportion of new maximum rate Age Pensioners who come from another income support payment is extremely high: 82.9 per cent for men and 89.6 per cent for women.
This section discusses data on a range of fixed and relative adequacy benchmarks and measures, including information on comparative rates of real income growth, replacement rates, international comparisons, budget standards, relative income measures, and outcome measures of stress and hardship. Also included are data on price changes for different groups.
Care needs to be taken in interpreting these benchmarks and measures.
There is no one way to determine whether a benchmark like 25 per cent of MTAWE is set at the right level. There is a need to look to a range of measures to judge whether current payment rates are appropriate.
Equally no one benchmark can definitively set a level at which an income support payment is adequate for all needs and all people. While the measures are useful guides, it does not follow, for example, that every person below 25 per cent of the MTAWE, or a relevant budget standard, has inadequate income for their needs.
2.1.1 Rates of income growth
Chapter 3 shows that the real value of the support paid to pensioners and families with children has increased over time, and the question arises as to how this compares with the experience of the wider community.
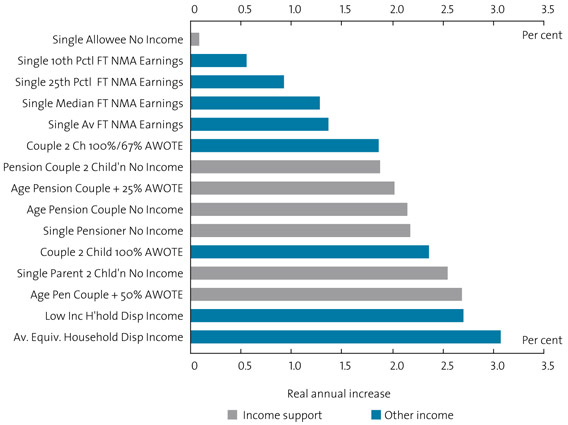
Chart 3 presents a number of comparisons of relative growth in real disposable income over the past decade. It draws from multiple sources, including surveys and estimated after tax earnings of a person on various levels of income. It shows:
- an Age Pensioner with no income other than the Age Pension had, on average, a real increase of just over two per cent per year
- there is a wide variety of outcomes for different groups—wage earners in the bottom half of the earnings distribution experienced lower real income growth than Age Pensioners wholly reliant on income support, while a couple with two children on average wages experienced higher real growth.
Chart 3. Comparison of real rates of income growth over the past decade
2.1.2 Replacement rates
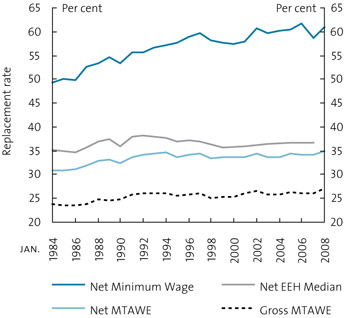
Three such replacement rates are in Chart 4 and Chart 5. These show the single allowance and single pension rate respectively as a proportion of the net income of a single worker on the minimum wage, MTAWE and earning the median of full-time non managerial employees' wage (as reported in the ABS Employee Earnings and Hours survey).
Chart 4 and Chart 5 show, for example, that the replacement rate for a single allowee as at 1 January was 45.9 per cent of the net earnings of a minimum wage worker and the Age Pension was 61 per cent. These different results reflect the different policy rationales behind pension and allowance payments, as noted in Chapter 1.
Chart 4. Replacement rates – single allowee
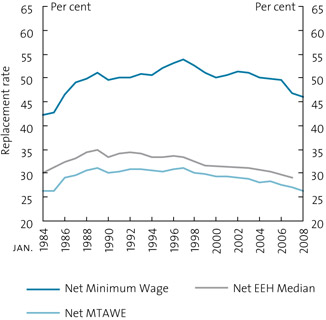
Chart 5. Replacement rates – single pensioner
2.1.3 International comparisons
Replacement rates can also be compared across countries.
When compared with other countries, Australia's transfer system provides working aged families and individuals with a higher replacement rate of income in periods of sustained unemployment or other joblessness than the equivalent social assistance component of most other OECD countries (although short-term income related insurance type payments in some countries are higher).
Chart 6. OECD – social assistance as a proportion of household income
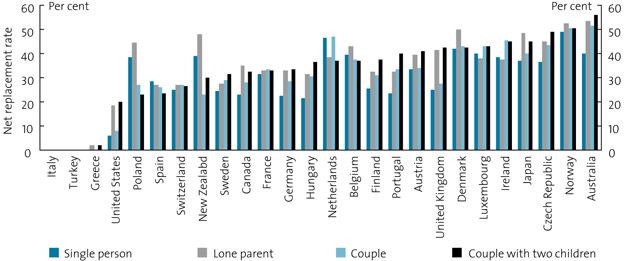
As these replacement rates are based upon allowance rates only, the actual assistance and replacement rates of a high proportion of income support recipients will be higher as they are eligible for pension rates of assistance rather than allowance rates.
Australia's replacement rates for retirement incomes are not as high relative to other countries, many of which operate contributory earnings related public pension schemes; however, the sustainability of many of these systems is questionable. Chart 7 compares replacement rates relative to the net earnings of a worker on 50 per cent and 100 per cent of the OECD defined national Average Production Worker wage.
Chart 7. OECD – retirement income systems net replacement rates for a worker on 50 per cent and 100 per cent of average earnings
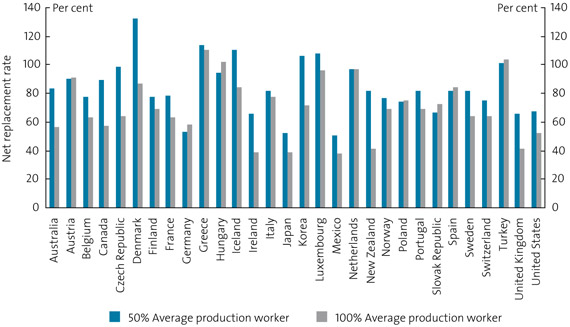
Australia's results will change in the future as superannuation assets build and feed into increased private retirement incomes. Nevertheless, the results indicate that Australia, out of the 30 countries surveyed, has the 12th highest replacement rate for low-income workers but because of the more limited level of superannuation assets built up by current retirees the country is ranked less highly at higher earnings levels. The net replacement rates for a worker on 50 and 100 per cent of average full time earnings in Australia in 2035 are expected to be 91 and 65 per cent respectively.
2.1.4 Budget standards
Budget standards involve developing detailed household budgets specifying the items a household needs to buy to achieve a defined standard of living and therefore can be used to identify the disposable income needed to obtain that standard of living. As with all approaches to measuring adequacy, these standards have strengths and weaknesses and are subject to considerable debate on whether they represent appropriate levels of living and can realistically reflect the diversity of living arrangements and trade-offs that households make.2
The Social Policy Research Centre at the University of New South Wales developed budget standards in the mid-1990s. These included some 600 individual products derived from research on household expenditure. Budgets were developed for two levels:
- a median living standard, described as the 'situation of a household whose living standard falls somewhere around the median standard of living experienced within the Australian community as a whole'
- a low-cost budget, described as 'a level of living which may require frugal and careful management of resources but would still allow social and economic participation consistent with community standards and enable the individual to fulfil community expectations in the workplace, at home and in the community'.
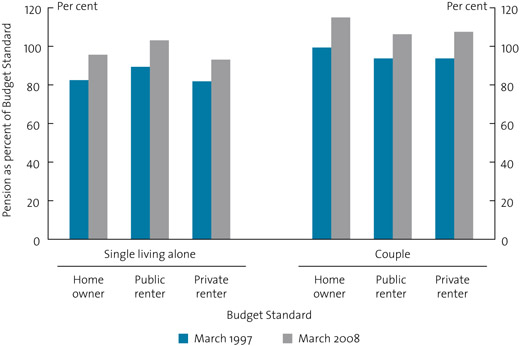
Chart 8 presents an update of the basic budget for aged single and couple households in a range of housing tenures using CPI. In effect, the cost of the basket of goods in the original standards has been adjusted to account for detailed price changes but the products in the original budget standards have not been adjusted for any change in community living standards.3
The results are shown in terms of the value of the pension for the particular household types as a proportion of the budget for that household type (for example, in March 2008 it is estimated that a single private renter on the Age Pension received 93 per cent of the low-cost budget standard from their Age Pension and Rent Assistance).
As illustrated in Chart 8, the Age Pension has increased relative to the budgets over the past decade. In March 2008, the Age Pension rate for single homeowners and single renters was below the relevant budget standard, and the rates for all couple household types were above the standard.
Chart 8. Age Pension as a percentage of budget standards
2.1.5 Relative income measures
Sometimes labelled 'poverty lines', relative income measures show the percentage of a population with incomes less than a proportion of an average or median household. A commonly used measure is 50 per cent of median household income (adjusted for household size). In much public debate, all households below the 'poverty line' are assumed to have inadequate income. However, care needs to be taken in interpreting relative income measures. 4
Not everyone below a relative line will have too little income to achieve a basic standard of living. Relative income definitions of poverty are quite poor at identifying households that actually experience hardship and financial stress.
Because they use relative disposable income, these measures ignore the extent to which support for low-income households may be provided through non-cash transfers such as services.
Also, a relative benchmark often moves with changes in the distribution of income in the broader population rather than real increases or decreases in the disposable income of people on low incomes.
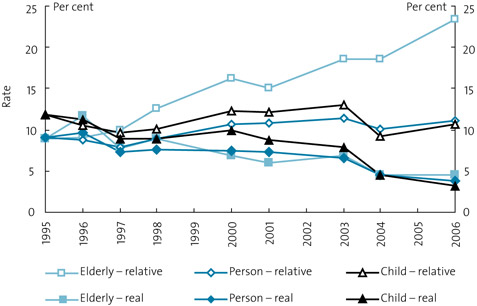
Chart 9 shows two approaches to such measures. The first uses the income of a household with 50 per cent of the household median income in 1994–95 to establish a poverty line which is maintained in real terms by adjusting for price inflation ('real' measure). The second tracks the proportion of the population with disposable incomes of less than 50 per cent of the median household income over time—that is, the 1996 results use the 1996 median household ('relative' measure). The chart shows three rates for each of the approaches: Persons, the proportion of the total population who live in households with an income below the low income line; Elderly, the proportion of people aged 65 years and over who live in households with incomes below the low income line; and Child, the proportion of children under the age of 15 years who live in low-income households.
The two approaches show divergent results. Using the constant real line there has been a marked decline in the incidence of low incomes across the population. Real increases in income support and wages have, in effect, moved many households above the poverty line that was set using 1994–95 median household income. In contrast, if a purely relative approach is taken there has been an increase in the poverty rate for the population as a whole. In 2005-06 it is estimated that 11.1 per cent of the population lived in households with less than 50 per cent of the 2005-06 equivalised disposable income of the median household, and 3.8 per cent lived in households with incomes below the 1995-96 benchmark adjusted to 2005-06 dollars. For the elderly the rates were 23.4 per cent under the relative measure and 4.6 per cent using the real benchmark, and for children 10.7 per cent and 3.2 per cent.
Chart 9. Relative and real low income measures
(Proportion living in households with equivalised disposable incomes below 50 per cent median equivalised disposable income, relative and real measures)
As noted above, this approach only considers current cash incomes rather than the wider set of resources available to households. An important component omitted is the benefits homeowners gain from owning their homes and not paying rent, along with the subsidies provided to public housing tenants. Taking these into account, using FaHCSIA estimates results in a fall in the relative measure in 2005–06 to 6.1 per cent5. For some household types the change is even more dramatic: for single persons over 65 years the rate drops from 47.4 per cent to 7.0 per cent, and for couples in this age group it drops from 19.0 per cent to 4.8 per cent.
The broad picture these data present is similar to that seen in considering the relative growth of income for different household types. Low-income households have maintained or increased their incomes in real terms, but for many the rate of increase has been lower than that for other groups in the community.
2.1.6 Financial stress indicators
The Household Income and Labour Dynamics in Australia (HILDA) survey found that Australian households, including pensioner and allowee households, when asked, do not generally nominate themselves as poor. Most are satisfied, although a significant group consider they are 'just getting along' (50.1 per cent of households relying on income support for 90 per cent of their income).
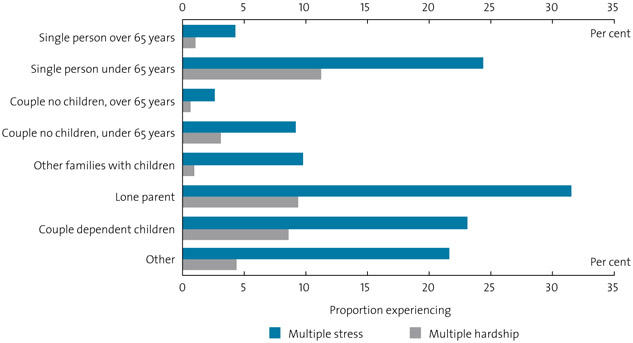
Self-reported rates of financial stress (for example, could not pay electricity, gas or telephone bills on time; could not pay the mortgage or rent on time; asked for financial help from friends or family) or hardship (for example, pawned or sold something; went without meals; was unable to heat the home; and asked for help from welfare/community organisations) are also low, although with some significant pockets of multiple stress and hardship. For example, a recent study by Edwards et al (2008) found that carers experienced financial hardship at around double the rate of the general population. Chart 10 illustrates the levels of stress reported by households with more than 50 per cent of their income from transfer payments.
Chart 10. Transfer reliant households: incidence of financial stress, 2006
While providing some insight into the adequacy of payments, the incidence of poor outcomes reflects a much wider set of factors. These include the full range of resources such as wealth and access to services, and personal characteristics, competencies and behaviours. While a certain level of income appears to be more than adequate for some households and individuals, others, despite being in similar situations, may find it inadequate.
This highlights that decisions on the adequacy of income support need to account for the role services play in meeting specific needs, especially for those who due to health or other reasons would otherwise face high costs.
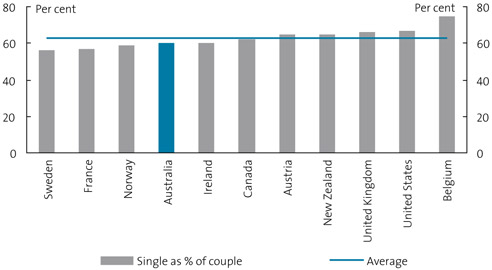
2.1.7 Singles and couples
The difference between the single and couple rates of pension also has an important effect on the adequacy of payment for specific groups. As noted in Chapter 1, the single-couple rate reflects the fact that a single person living alone usually does not have the economies of sharing household expenses commonly experienced by a couple. The single rate of pension is currently 60 per cent of the combined couple rate.
Chart 11 shows how the single-couple ratio in Australia compares with the relativities in other major OECD countries, which fall into a range from 57 per cent to 75 per cent, but somewhat below the average value of 62.9 per cent (the median value across these countries is 62 per cent).
Chart 11. International comparison of single–couple relativities
FaHCSIA analysis using a range of data including the ABS Household Expenditure Survey, HILDA and budget standards has sought to estimate 'equivalences' between couple and single person households using 14 different approaches. These included the relative incidence of financial stress and more econometrically based approaches using shares of food expenditure and types of private consumption. These measures of equivalence ranged from 0.6 to 0.79.
It should also be noted that this type of analysis only considers the relativities between household types – that is, a single person household compared with a couple only household. Other types of household have different relative needs – for example, a single person living with others compared with a couple living together. While the gains from this type of sharing may not be as great as those obtained by a member of a couple, the costs are likely to be substantially below those of a person living by themselves. Typically, the relative income required by a single renter living alone is higher than that required by a couple renting.
These comparisons of single-couple equivalences are consistent with the analysis of a range of measures in earlier sections of this report, including the budget standards approach, relative income distribution and the incidence of stress, which suggest that outcomes for those single pensioners living by themselves are somewhat lower than those reported by couples.
2.1.8 Maintaining adequacy over time
In addition to the level at which payments are struck, the basis on which they are adjusted over time contributes to their adequacy.
The CPI's goal is to provide a broad measure of inflation in the household sector. As an aggregate measure, it records the impact of price changes on the total quantum of consumption across the sector6. As a general measure of price inflation, the CPI does not reflect the impact of costs for particular households and indeed is more heavily weighted by the consumption patterns of higher income households, who contribute the greater weighting of their purchases. As a result, where households have a different pattern of consumption to the average of the population, changes in the specific costs they encounter may not be appropriately reflected by the CPI. To overcome this, the ABS has developed a number of Analytical Living Cost Indexes which account for the specific purchases made by different household types7.
Chart 12 compares one of these analytical indexes—the Age Pensioners index—with the CPI, showing the trends in both measures of price increase and the difference between them.
Chart 12. CPI and Age Pension Analytical Living Cost Index
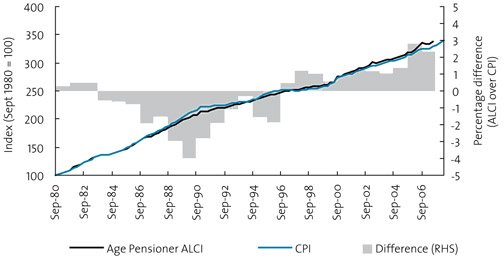
Over the 27 years for which the two indexes are available, the two measures of prices have varied at particular times. Over the whole period, the cumulative difference has been relatively small. The measure of prices for Age Pensioners has increased by 237.3 per cent compared with 229.5 per cent for the CPI. Over the past five years, while the CPI has increased by 14.5 per cent the price index for Age Pensioners has increased by 15.8 per cent.
In addition to the longer standing Age Pensioner Analytical Living Cost Index (ALCI), ABS has also developed more recent indexes for 'Other Government Transfer Recipient', 'Self-Funded Retiree' and 'Employee' households. Over the past five years, some ALCIs have increased more rapidly than both the CPI and the Age Pensioner ALCI. The Employee ALCI increased by 18.0 per cent and the Other Government Transfer Recipient ALCI increased by 16.6 per cent. The Self-Funded Retiree ALCI grew by 14.4 per cent over the period, which was less than the growth of the CPI and the Age Pensioner index.
If it were possible to further breakdown the Other Government Transfer Recipient group (something that is not currently able to be done because of the small sample size) it is likely that more specific subgroups of pensioners and allowees would have faced cost increases either above or below this average.
Of course, any measure of price change, whether it is the CPI, the Age Pensioner ALCI or any other measure, will not describe the actual price changes faced by a household. Such measures still assess price changes in an average basket of goods with average expenditure weights applied to the categories of items in the basket. There will always be a significant number of households with expenditure weights that mean they face higher or lower than average price changes over any time period.
Return to top Start of section
2.2 Frequency of payments, including the efficacy of lump sum versus ongoing support
Most Australian income support payments are paid on a fortnightly basis, reflecting the role of these payments in providing individuals and families with the money they need for their day-to-day living costs. However:
- some payments (for example, Telephone Allowance and Utilities Allowance) are made quarterly
- annual lump sums in the family payments system help moderate debts resulting from reconciling family income estimates with taxable income
- regular bonuses are intended to help with larger lump sum costs
- ad hoc bonuses have been paid annually to allow pensioners and some allowees to benefit from productivity gains in the economy as a whole.
Chapter 1 showed that different income support recipients get different packages of income support.
From the perspective of the individual pensioner or allowee, the frequency of payments and balance of lump sum and ongoing support are important because of how this affects the capacity to manage regular recurrent costs and less regular or unplanned lump sum costs. In addition to the quarterly and annual payments listed above, it should be noted that pensioners and allowees can get advances of their payments that they then repay. They can also use Centrepay to make regular payments to cover expenses such as utility bills and can use electronic banking to make direct payments from their accounts to help manage their finances.
Since annual and large quarterly payments are a relatively new component of the income support system, no research is available on customer preferences. However, information is available on people's access to cash reserves and/or credit that would allow people to meet planned and unplanned lumpy expenditure. This gives an insight into the need for mechanisms within the income support system to give people the flexibility to balance different types of expenditure.
2.2.1 Ability to raise funds in an emergency
Data is available on whether pensioners think that they have the ability to meet emergency needs. The 2003–04 Household Expenditure Survey asked households whether they could raise $2,000 in a week for an emergency. As the person's reliance on income support increases, their capacity to raise funds in an emergency decreases. Table 2 examines payment recipients by type of payment and proportion of household income that the payment constitutes, and the proportion of households that could not raise $2,000 in an emergency. For example, of all households relying on the Age Pension for 90 per cent or more of their income, 18.1 per cent said they could not raise $2,000 in an emergency. This increased to 50.9 per cent for the equivalent Disability Support Pension population.
| Proportion of household income derived from transfers | ||||
|---|---|---|---|---|
| Under 50 per cent | 50 to under 90 per cent | 90 per cent and over | Total | |
| Age | 6.1 | 2.3 | 18.1 | 11.4 |
| DSP | 15.2 | 18.4 | 50.9 | 35.2 |
| DVA | 3.5 | 4.3 | 8.2 | 5.5 |
| Parenting | 26.0 | 41.5 | 67.6 | 45.4 |
| Newstart/student | 20.7 | 38.2 | 45.4 | 31.3 |
| Other income support | 11.8 | 20.1 | 44.4 | 24.3 |
| All Households | 8.9 | 18.5 | 33.5 | 14.3 |
The main source households would use to raise funds in an emergency is private savings. Among Age Pension households highly reliant on income support who said they could raise $2,000 in an emergency, 68.8 per cent said they could do so from savings. For the comparable Disability Support Pension households, around half said they could access savings for this purpose.
2.2.2 Access to cash savings
Most income support reliant households have relatively few assets (although, as Chapter 3 describes, there are some comparatively wealthy households). This is even more marked when cash savings, which are an important source of liquid assets, are considered.
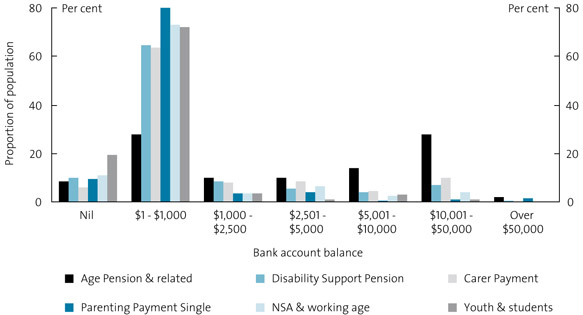
Most of the almost two million income support recipients living in households reliant upon transfers for more than 90 per cent of household income report they have savings under $1,000.
Amongst these highly welfare reliant households, Age Pensioners—along with those on DVA payments—have higher levels of savings and much lower proportions reporting very low savings (Chart 13).
Chart 13. Highly reliant income support recipients: value of bank accounts, 2005–06
2.2.3 Credit cards
The main form of non-housing consumer credit used by Australians is credit cards. The Reserve Bank of Australia reports there are some 12.9 million credit card accounts in Australia with balances of $39.3 billion.
Many consumers, however, do not hold a credit card either because they do not want to use one or because they have not been able to obtain one. This may be due to their credit history or because their circumstances are not considered by lending institutions to offer sufficient assurance of their ability to meet their obligations.
The majority of people on income support (52.7 per cent) who live in households mainly reliant upon transfers as their main source of income do not have a credit card. This proportion varies between types of income support and with the extent of reliance upon income support (Table 3). Overall, the more reliant a household is on income support the less likely people are to have a credit card.
| Proportion of household income derived from transfers | Total | ||||
|---|---|---|---|---|---|
| Under 10% | 10-<50% | 50-<90% | 90% and over | ||
| Age Pension and related | 9.2% | 27.1% | 40.8% | 56.6% | 45.4% |
| DSP | 14.7% | 29.6% | 39.5% | 68.0% | 50.6% |
| Carer Payment | 0.0% | 12.0% | 36.5% | 57.7% | 42.2% |
| Parenting Payment Single | 10.6% | 39.4% | 52.3% | 68.5% | 53.9% |
| NSA and working age | 16.5% | 33.6% | 43.3% | 50.5% | 40.7% |
| Austudy/Abstudy/YA | 8.4% | 29.6% | 52.3% | 65.8% | 34.5% |
| Other family payments | 13.5% | 21.7% | 51.1% | 52.5% | 19.4% |
| Other | 11.5% | 29.1% | 27.5% | 60.1% | 33.6% |
2.3 Structure and payment of concessions or other entitlements that would improve the financial circumstances and security of carers and older Australians
Chapter 1 reported that one principle of the social security system was to ensure that households in different circumstances achieve a comparable standard of living. This is an area where the income support system crucially depends on the wider social protection system; as is outlined below, this is particularly the case for those who face high costs because of disability.
One question in the design of social policy is whether the direct provision of services will meet an individual's needs more efficiently and effectively than cash transfers. Transfer payments work best when the costs of different groups are clustered tightly around the average. They tend to be based on an assessment of the average need of population groups (for example, renters, singles or couples). However, transfer payments work less well if used to address costs that are borne unevenly in the population. In this case there is a risk that groups with high needs will be significantly under compensated and groups with low needs will get a windfall gain.
2.3.1 Social assistance in kind
Australia's social protection system is designed to provide assistance as part of an integrated approach to people at key stages or events across the life course. In addition to income support payments and concessions on a range of goods and services such as those provided through the Pensioner Concession Card, Commonwealth Seniors Health Card and Health Care Card, the social protection system encompasses subsidised services such as child care, health, housing, transport, disability and aged care, compensation for work and other injuries, paid sick leave, and other cash and in-kind benefits. These contribute to the overall financial and economic security of pensioners.
Elements of the system are funded by all levels of government through transfers, tax expenditures and funding of community and welfare services. Business also contributes by providing employee benefits such as maternity and sick leave. The non-government sector also plays a role by providing services, as does the public (for example through compulsory levies on motor vehicles to cover compensation payments for road accident injuries).
Transfer payments operate in conjunction with these other forms of assistance to meet the needs of income support recipients. In a number of service areas, individuals may contribute to the overall cost of the service provided according to their ability to pay. Residential aged care services are a case in point. Here the government provides significant funding through the non-government sector's provision of aged care accommodation and services. The individual also contributes, either through paying a proportion of their pension or specified amounts based on their income and assets.
From the data available it appears that these services are well targeted. The ABS estimated in 2003–04 that 29.8 per cent of the gross value of this type of assistance flows to households in the lowest private income quintile (adjusted for household size).
It also appears that these services are a significant component of the total support available to low income households. Chart 14 shows, for those households that receive more than 90 per cent of their income from transfer payments, the value of net private income, transfers and non-cash benefits for households, classified by the main form of income support received by the household. In the case of households in receipt of the Age Pension, for example, the equivalised value of these benefits was $203 per week, which was close to the equivalised value of income support of $247 per week (in 2003-04).
Chart 14. Highly reliant households: components of final income, 2003–04
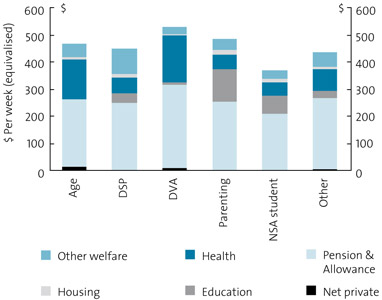
Both the level and mix of these non-cash benefits vary between the household types associated with these different payments. For example, while older income support reliant households have a very high use of health services, households with some income from the Disability Support Pension have a relatively high use of other welfare services, including disability services. These households, along with single parents, are high users of public housing. Because these data reflect average values of assistance across households, they disguise the much greater diversity in the benefit obtained by different households.
As the population ages, the need for additional health care in the community will increase. One of the most significant needs individuals may have over their lives is the need for, and access to, medical and health services. The timing and scale of the need for these services may be unpredictable for many. Australia, responds directly by providing a universal health safety net, which ensures all Australians can access health and medical assistance without being constrained by their ability to pay.
Another feature of an ageing population will be an increase in the number of people with disability who need access to services and support. Disability issues are central to this review as they cut across the income support population.
Return to top Start of section
2.3.2 Disability related services
Many people with disability have additional needs and associated costs related to their disability. The nature and level varies significantly from individual to individual. They are ameliorated, in part, by services funded by government that respond directly to a range of individual and household needs.
Costs
There is little systemic information available on the dispersion of the costs of disability. The DVA, however, has a unique data set drawn from its population of White Card holders, which provides information on service types by cost and by the level of disability of the card holder.
These data represent the average annual cost of the White Card at each point of the general rate disability pension under the Veterans' Entitlement Act. The White Card provides for treatment and other services for a veteran's accepted service-related disabilities.
Chart 15 illustrates the increases in cost by service type as the level of disability increases.
Chart 15. White Card clients: average expenditure, 2007–08
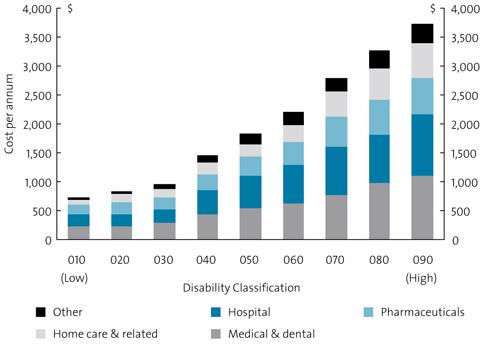
The data should be interpreted with some caution because they are the product of a complex eligibility system:
- they reflect only the costs of disabilities that have been accepted as being due to a veteran's service—that is, an individual could have more severe disabilities than implied by the level of their service-related accepted disabilities
- access to each program is regulated and capped through business rules, and further services beyond the caps can be approved on the basis of need
- the White Card population is concentrated in older age ranges
- costs are gross and do not include Medicare offsets.
The costs reflect a range of the total costs of disability and not the costs for individuals. These actual costs are much harder to identify and there is considerable debate surrounding them. A recent report undertaken for the United Kingdom's Department for Work and Pensions (Tibble 2005) reports that while research generally agrees on there being extra costs of disability that there is much variance in the findings of different studies of the cost to individuals with little agreement on the size of costs, the costs for specific groups and items, nor the factors that influence the size of costs.
2.3.3 Services example
Services for people with disability are provided through the current Commonwealth State Territory Disability Agreement (CSTDA), the Commonwealth Department of Health and Ageing's programs—including the Home and Community Care (HACC) program—and additional state and territory government funding. As an example of governments' contribution to the costs incurred by people with disability, the disability related services provided through the HACC program and the CSTDA are briefly described next.
Home and Community Care
The HACC program is a joint Australian, state and territory government cost-shared initiative, with around $1.6 billion in funding in 2007–08. State and territory governments manage the day-to-day administration of the program. HACC provides community care services to frail aged and younger people with disability and their carers to promote and enhance their independence at home and in the community. Types of services funded through HACC include nursing care, allied health care, meals and other food services, domestic assistance, personal care, home modification and maintenance, transport, respite care, counselling, support, information, advocacy and assessment. Information on the use of some of these services in 2006–07 is included in Table 4.
| Service type | Number of clients | Total service hours (million) |
Average per client (hours) |
|---|---|---|---|
| Centre-based day care | 74,227 | 8.70 | 117.3 |
| Respite | 34,642 | 2.46 | 71.1 |
| Personal care | 80,028 | 4.32 | 53.9 |
| Domestic assistance | 250,793 | 7.76 | 30.9 |
| Social support | 106,105 | 3.84 | 36.2 |
| Nursing care | 211,498 | 2.83 | 13.4 |
| Allied health | 163,110 | 0.88 | 5.4 |
The majority (92.2 per cent) of HACC clients in 2006–07 received some form of government pension or benefit, most commonly the Age Pension (65.2 per cent), Department of Veterans' Affairs pension (13.5 per cent) and the Disability Support Pension (8.8 per cent).
Commonwealth State Territory Disability Agreement
The CSTDA provides the national framework for the provision of government support to service for people with disability. Under the agreement, all parties are responsible for funding specialist disability services. The state and territory governments have responsibility for the planning, policy setting and management of accommodation support, community support, community access and respite care for people with disability. The Australian Government has similar responsibilities for specialised disability employment assistance.
Total Commonwealth and state and territory funding under the CSTDA in 2006–07 was $4.4 billion. Expenditure per client through the CSTDA tends to be, on average, much higher than HACC expenditure due to the more intensive nature of the services being delivered—for example, supported accommodation services. Table 5 provides information on some of the services funded through the CSTDA by service type in 2006–07. It is not a total list.
| Service type | Total annual cost to government $ million |
Average cost per service user |
Number of users |
|---|---|---|---|
| Accommodation support | $2,088.9 | $55,745 | 37,473 |
| Community support | $519.9 | $5,273 | 98,598 |
| Community access | $525.5 | $9,871 | 53,236 |
| Respite | $255.7 | $8,506 | 30,058 |
| Open employment | $218.8 | $3,678 | 59,478 |
| Supported employment | $171.5 | $8,111 | 21,140 |
3. Trends and characteristics
3.1 Economic and social context
3.2 Changes in social assistance over time
3.3 Characteristics of income support recipients
3.4 Participation and private resources
3.1 Economic and social context
The social security system works in a complex demographic, economic and social environment. The community expects it to respond to new needs arising from demographic, economic and social change. By changing incentives and providing options, the system also affects each of these dimensions. This section outlines briefly the key demographic, economic and social trends that have affected the social security system in the medium to long term.
3.1.1 Demographic
Australia's population is changing and its structure is dynamic. Over the past 25 years the population has increased by nearly 40 per cent. The population is ageing: in 1975 only nine per cent of Australians were aged 65 years and over but today it is 13 per cent, and this proportion is projected in the second Intergenerational Report to increase to 25 per cent by 2047.
Demographic trends will play a significant role in the sustainability of the social security system into the future through their impact on the aggregate level of income support payments and the number of people in the workforce who will support these payments through the tax system. The ageing of Australia's population, coupled with higher life expectancies, is projected to drive a net increase in payments to individuals from 6.7 per cent to 7.1 per cent of GDP over the next 40 years.
The population aged 65 years and over is also changing. New generations of retirees, such as the baby boomers, are different from earlier generations born before the Second World War, and Generations X and Y will differ again. The differences between these cohorts mean that there can be quite marked shifts in the characteristics, size and expectations of segments of the population over quite short periods. Pressures to improve assistance or defray costs can therefore develop quite quickly in the income support system.
3.1.2 Economic
Labour market participation is a critical element of the linkage between the economy and individual and community wellbeing. Female participation has shown marked increases over the last 40 years.
With changes in social values and labour market conditions, many older women have returned to work after their children have grown, while younger women, having entered the labour force in their twenties, are maintaining their participation across their lifetime with shorter periods of withdrawal associated with family formation. Notwithstanding this strong growth, the employment rate for women in Australia remains some six-and-a-half or seven percentage points below the high participation countries of the OECD. Australia has the ninth highest rate of employment of mothers with children aged six years and over in the OECD but the eighth lowest rate for those with younger children. Single mothers, who in Australia have an employment rate 9.4 percentage points lower than partnered mothers, have the second lowest rate of employment in the OECD.
Labour force participation rates for men aged 15 years and over are currently around 73 per cent, below the rates of 80 per cent and higher recorded in the 1960s but above the low of around 71 per cent in the early 2000s.
The greater availability of part-time employment and relatively low rates of unemployment have increased the opportunity for many on income support to re-enter the workforce, including those who are unable to take up full-time work. This is reflected by the increasing levels of overall participation (including by second earners and students). Rising wages across the economy also have impacts on the social security system. For pensioners, changes in earnings directly affect the rate of assistance through the 25 per cent of MTAWE benchmark (see Section 1.2.3 for rates of payment). More generally, changes in overall levels of wellbeing in the community act as one of the reference points that people use to judge the adequacy of income support payments. With increasing earnings dispersion, these judgments can become increasingly varied. There has also been a shift in the relative role of earnings and transfers in the incomes of low-income working families with children.
3.1.3 Social
Australian households are much smaller than they used to be and, with the ageing of the population, are increasingly composed of older couples and singles rather than couple families with dependent children. Single parenthood, which increased almost continuously between the 1980s to 2000s—from 12.2 per cent of families with children in 1980 to 23.1 per cent in 2004—appears to have stabilised. Within families, the increasing rate of labour force participation by women has resulted in a marked increase in two-income households and a decline in the traditional single breadwinner household.
Changing social attitudes and aspirations are also critical to judgements about the role of the transfer systems and what it should deliver.
3.2 Changes in social assistance over time
The effect of these trends on the social support system is complex: as noted above there are new needs (such as child care), cost pressures (for example, the demographic impact on Age Pension) and changes to expectations (including different judgments about what is an adequate household income, including in retirement). Governments have responded to these pressures in various ways, including by funding additional services, increasing payments, expanding coverage of payments and introducing stronger obligations to increase self provision for some groups.
3.2.1 Trends in income support
Over most of the 20th century an increasing proportion of the population received transfer payments. Many of the initial changes reflected the increasing role of social protection through the welfare state, as well as changing population structures. By the end of the 1960s and early 1970s, 12 per cent of the population aged 15 years and over received transfer payments and this increased rapidly during the 1970s to 23.5 per cent in 1979. It peaked in 1996 at 33.1 per cent and has now declined to 27.2 per cent.
Chart 16. Proportion of the population aged 15 years and over on income support, 1901–2008
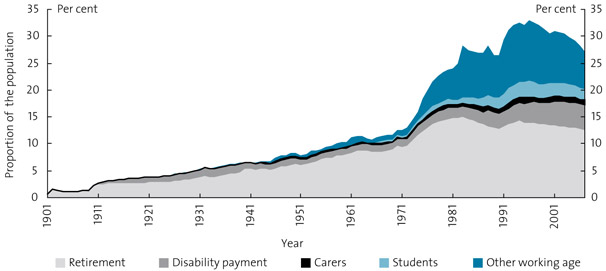
Chart 16 shows the trend over time of the percentage of the population receiving income support (family payments and child care are not included).
Age Pension has been a feature of the Australian income support system for the last 100 years. The proportion of the population receiving Age Pension has grown over time as the population has aged and the level of payment has increased. The proportion of working age people receiving income support has grown in the last 30 years. Some of this growth is due to increases in real rates of assistance (such as extensions of Rent Assistance to allowees) that, combined with reductions in income test taper rates, has made more people eligible for a part-rate of income support.
Much of the growth, however, reflects social and economic factors. As well as cyclical economic conditions, periods of high unemployment and structural change have created cohorts with very high income support durations. Other labour market changes, such as increased part-time work, especially in association with increases to income test cut-outs, have extended income support into the working population. Social changes, such as increased levels of family break-up and later workforce entry as a result of longer periods in education, have also played a role.
Particularly marked in the chart are more recent declines in rates of receipt as economic conditions have improved.
3.2.2 Rates of assistance
Changes to the real value of basic income support
Both pensions and allowances are indexed by the CPI to maintain their purchasing power in the face of price increases. In addition, pensions are benchmarked to earnings, as measured by the MTAWE, so recipients who are not able or expected to participate in the labour market can benefit from growing productivity.
As shown in Chart 17, there has been considerable divergence in trends in the rates at which various payments are made as a result of these settings.
Chart 17. Real rates of selected pensions and allowances, 1970–2008
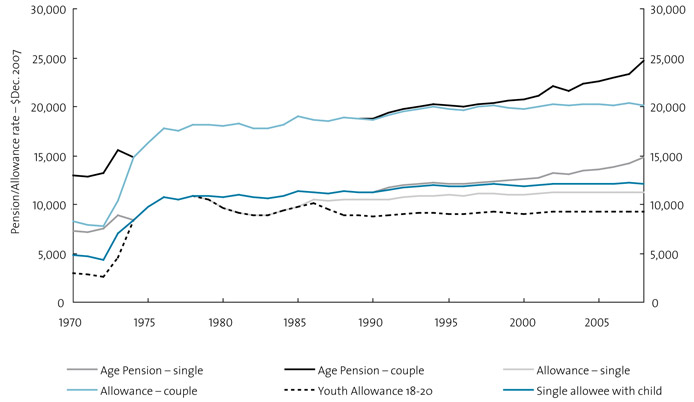
In effect, while pensions have increased in real value over most of the period since 1970, more recently allowances have simply maintained their real value because they are only indexed to the CPI.
A consequence of this is that over the period 20 March 2008 to 19 September 2008 allowee couples and singles on the higher rate of allowance receive 86 per cent of the couple and single rates of pension, and singles on the lower rate of allowance receive 80 per cent of the single pension rate. The rates at which pensions and allowances are paid will continue to diverge with growth in productivity and real wages.
These rates reflected the different policy contexts for pensions and allowances noted in Chapter 1: pensions were intended to provide long-term support to those who were unable to support themselves, while allowances were intended primarily for short-term support and to have strong incentives to take up work.
3.2.3 Expenditure
In 2006–07, Australian Government expenditure on transfer payments was $71.6 billion, or around 6.8 per cent of GDP. The trends over time are in Chart 18.
Chart 18. Australian Government expenditure on transfer payments, 1910–2008
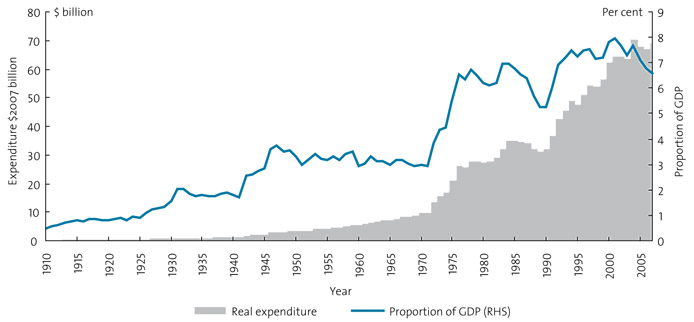
The pattern of expenditure reflects many factors, changes in economic conditions, the development of the Commonwealth role in income support including the take-over of various state payments, increases in the real level of assistance and relaxed means testing arrangements, and expansions in coverage as a result of policy change, for example the recognition of single parents, carers and expanded definitions of disability.
While expenditure has generally trended upwards it has fallen as a share of GDP at various stages as a result of sustained economic growth.
3.3 Characteristics of income support recipients
This section provides an overview of the characteristics of those who receive income support, including gender, age, duration, transitions and living arrangements. What emerges is the complexity of how people interact with the system. While we are used to thinking about people through the lens of discrete categories (Age Pensioners, Carer Payment recipients or Disability Support Pensioners) the reality is different. For example, there are as many people with disability on the Age Pension as there are on Disability Support Pension.
3.3.1 Gender
In June 2007 around 58 per cent of all income support recipients were women, with 2,694,200 receiving a payment compared to 1,906,900 men.
As Chart 19 shows, gender balance varies between payments with women constituting 58.3 per cent of all Age Pensioners, 42.1 per cent of Disability Support Pensioners and 67.3 per cent of Carer Payment recipients. Of the major payments, Newstart Allowance had the highest proportion of male recipients at 62.9 per cent.
Chart 19. Main income support payments by gender, June 2007
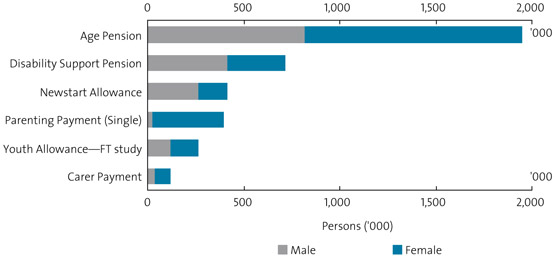
While roughly equal numbers of males receive income support8 as a single person as they do as a member of a couple, a much higher proportion of women are single. Indeed, around two-thirds of women receive income support as a single person, compared with around one-third as a member of a couple. The main reasons for this are that women have a longer life expectancy and are outliving their partners, and that women are more likely to be single parents. (As discussed in Section 2.3.4, the number of partnered males and females do not match because many couples have only one person receiving income support.)
3.3.2 Age
The median age of income support recipients is 62 years, comprising a median age of 74 years for those on the Age Pension and 39 years for others. There is considerable variation in the rate of receipt by age, with similarities and differences in the patterns of the ages of men and women (see Chart 20).
For women and men, there is an early peak reflecting the age group receiving income support for students. For both sexes, Disability Support Pension and Carer Payment receipt increases with age. However, the number of women who are single parents and the associated lower labour force participation is a key driver of the fact that women have higher rates of income support receipt at almost every age than men.
Chart 20 also shows the substantial increase in the proportion of the population receiving income support payments after the age of 65. It also illustrates how the significant proportion of the population who receive Age Pension transfer from another payment, with rates of income support receipt increasing rapidly in the population aged over 55 years. This issue is explored in more detail in the section dealing with duration of income support receipt.
Chart 20. Levels and rates of receipt of income support by age and gender, June 2008
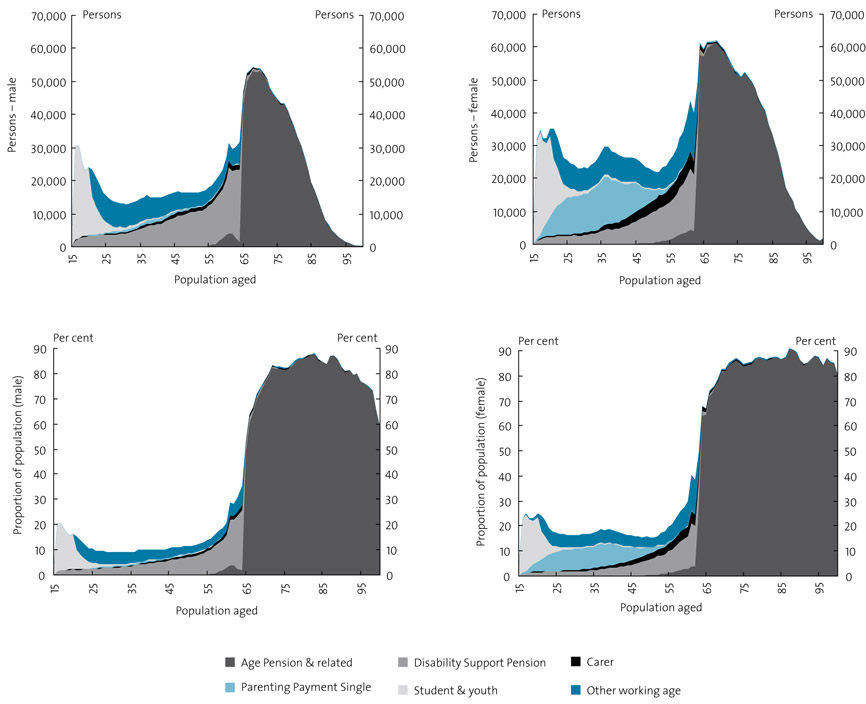
In total, 16.9 per cent of working age people (aged 16 to 64 years) receive an income support payment. Of these, 15.9 per cent are students or on other youth payments, 6.0 per cent are carers, 30.8 per cent are people with disability on Disability Support Pension, 5.9 per cent are on retirement related payments and the remaining 26.1 per cent are on other working age payments, including Parenting Payment and Newstart Allowance. Of the entire working age income support population, only around one in six are either required to seek work as a condition of payment or are already meeting their participation requirements through work.
Changes in age specific rates of receipt
The impact of economic and social change on the rates of income support receipt by age over time can be illustrated by comparing age specific dependency rates at various points in time. Chart 21 shows the net effect of changes in age specific dependency rates over the last decade. It does so by comparing the percentage of men and women receiving income support by age for 1997 and 2007.
Chart 21. Age specific rates of receipt to age 65, June 1997 and June 2007
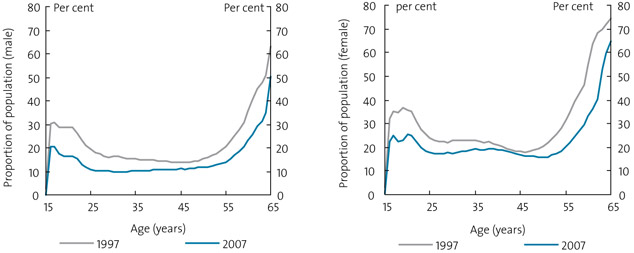
The past decade has seen a general fall in most age specific rates of receipt across the working age population for men and women, largely driven by improving labour market conditions. The fall has been largest amongst the youngest and the oldest age groups, for men the change was smallest in the 45 to 50 year age range and for women in the range from 40 to 45 years.
The strong fall among young people is likely to have been a result of support for this group being more likely to be received today through parental receipt of FTB rather than individual support through Youth Allowance. This in part reflects the increased generosity of assistance for children in the FTB system relative to Youth Allowance.
Notwithstanding the generalised falls in rates of age specific receipt between June 1997 and June 2007 there was:
- a 395 per cent increase in the number of people receiving Carer Payment
- a 35 per cent increase in the numbers of Disability Support Pensioners.
At June 2007 around 77 per cent of the Australian population aged 65 and over was in receipt of an income support payment, down from about 82 per cent in 1997. This figure is expected to increase to around 78 per cent for June 2008, partly due to the relaxation of the pension assets test taper that occurred in September 2007.
3.3.3 Duration and patterns of income support receipt
The decrease in the proportion of the population receiving income support is important, but again it does not capture the full complexity of the way that the system works for pensioners and allowees.
Many income support recipients receive a pension or allowance for an extended period. As noted in Chapters 1 and 2, people who rely on income support for long periods, especially if they have low levels of private income and assets, are particularly dependent on pension rates to achieve a basic acceptable standard of living. People with disability and older people on the Age Pension have particularly long durations on income support. However, long durations are also recorded for many others. In addition, there is a significant group who are largely reliant on income support for an extended period and they move as much between payments as they move in and out of the system.
| Persons | Average time spent on income support (years): | 'Total' (b) duration (years) to date: | ||||||||||
|---|---|---|---|---|---|---|---|---|---|---|---|---|
| In past 5 (a) years | In past 10 (a) years | Median | Average | |||||||||
| This pay-ment | All pay-ments | This pay-ment | All pay-ments | This pay-ment | All pay-ments | This pay-ment | All pay-ments | |||||
| Age Pension | 1,996,900 | 4.6 | 5.0 | 7.5 | 8.9 | 9.4 | 12.4 | 11.3 | 13.1 | |||
| DSP | 731,100 | 4.3 | 4.8 | 6.6 | 8.2 | 7.1 | 10.9 | 8.7 | 10.8 | |||
| Carer | 117,300 | 2.9 | 4.3 | 3.6 | 6.8 | 2.8 | 7.9 | 3.6 | 7.6 | |||
| Parenting Payment Single |
446,800 | 3.7 | 4.2 | 5.0 | 6.8 | 4.9 | 7.6 | 5.0 | 7.4 | |||
Table 6 shows that current recipients of the four major pension payments have spent between 6.8 and 8.9 of the past 10 years on payment, with the largest amount of time recorded by Age Pensioners and a smaller amount of time recorded for carers and those on Parenting Payment Single. Over a shorter five-year period, the average time on payments ranges from 4.2 to five years.
The data show not only the long period of receipt, but also the extent to which there is considerable movement between payments over time. For all payments types, the average period spent on the current payment represents only part of the total average time recipients have been in receipt of income support. This is most clearly seen with those currently receiving Carer Payment. While this group has spent an average of 3.6 of the past 10 years on this payment, they have also spent an average of 3.2 years on other income support payments either before moving onto Carer Payment or when they were not providing care.
More detailed data indicate that some 55 per cent of those on Carer Payment in 2007 were also on income support in 1998; however, only 15.7 per cent of people on Carer Payment in 2007 were on Carer Payment in 1998. The largest group (29.7 per cent) were on Newstart Allowance, followed by Parenting Payment. Looking at this from the perspective of those on Carer Payment in 1998, it can be seen that 73.3 per cent were still on income support in 2007, although only 25.7 per cent were still on Carer Payment, with the balance moving to other payments—in particular, the Age Pension, Disability Support Pension and Newstart Allowance.
The pattern of movement between payments is also seen in persons entering Age Pension. Of the males who took up the maximum pension (just over half of new male entrants) at the qualifying age of 65 years in 2006–07, 82.9 per cent came from another income support payment. Of those who moved onto a part pension, 40.6 per cent did so from another payment. The main payments these men moved from were Disability Support Pension (64.3 per cent), Mature Age Allowance (21.1 per cent) and Newstart Allowance (9.4 per cent).
Of the women who entered Age Pension at qualifying age, a slightly higher proportion (56 per cent) moved onto the maximum rate of payment. Of these, 89.6 per cent came from another income support payment—the single main payment was Disability Support Pension (39 per cent). Of the balance, the majority transferred from Partner and Widow Allowances, and Widow and Wife Pensions.
Similar patterns can be seen with regard to Disability Support Pension, with 50.7 per cent coming from another payment. Most of these movements were from Newstart Allowance, followed by Parenting Payment Single. Each year around 7,000 young people aged under 18 years move onto this payment. The majority of people leaving Disability Support Pension move to the Age Pension.
3.3.4 Housing and living arrangements
There is considerable diversity in the housing and living arrangements of income support recipients. As well as mirroring community diversity, this reflects the life histories of income support recipients and the circumstances that have led them to seek assistance.
Housing tenure
Most income support recipients find their housing through the market—in particular, through home ownership and the private rental market (Table 7).
| Main transfer payment | No rent paid |
Funded aged care |
Public housing |
Private rent— No RA |
Private rent— RA |
Home owner / purchaser |
Total |
|---|---|---|---|---|---|---|---|
| Couples | |||||||
| Age Pension | 4.0 | 1.5 | 2.8 | 1.3 | 7.5 | 82.9 | 100.0 |
| Carer Payment | 5.4 | 0.0 | 8.2 | 3.2 | 17.6 | 65.6 | 100.0 |
| Disability Support Pension | 5.3 | 0.3 | 10.7 | 3.1 | 17.5 | 63.2 | 100.0 |
| Family Tax Benefit (only) | 7.6 | 0.0 | 1.5 | 10.8 | 20.6 | 59.5 | 100.0 |
| Newstart Allowance | 10.6 | 0.0 | 9.8 | 8.6 | 35.2 | 35.9 | 100.0 |
| Parenting Payment Partnered | 8.5 | 0.0 | 4.6 | 7.3 | 36.9 | 42.7 | 100.0 |
| Youth Allowance | 22.3 | 0.0 | 3.8 | 19.7 | 51.8 | 2.4 | 100.0 |
| Other | 7.8 | 0.1 | 4.2 | 8.7 | 26.0 | 53.2 | 100.0 |
| All | 6.0 | 0.7 | 4.2 | 5.3 | 16.5 | 67.3 | 100.0 |
| Singles | |||||||
| Age Pension | 9.1 | 9.8 | 9.0 | 3.2 | 15.4 | 53.4 | 100.0 |
| Carer Payment | 20.6 | 0.0 | 16.5 | 14.9 | 23.7 | 24.2 | 100.0 |
| Disability Support Pension | 15.6 | 1.1 | 19.3 | 14.6 | 32.2 | 17.2 | 100.0 |
| Family Tax Benefit (only) | 8.8 | 0.0 | 3.2 | 18.5 | 29.9 | 39.5 | 100.0 |
| Newstart Allowance | 20.4 | 0.0 | 8.8 | 22.1 | 37.6 | 11.0 | 100.0 |
| Parenting Payment Partnered | 16.7 | 0.0 | 13.3 | 6.7 | 30.0 | 33.3 | 100.0 |
| Parenting Payment Single | 10.4 | 0.0 | 14.3 | 11.4 | 45.3 | 18.5 | 100.0 |
| Youth Allowance | 7.2 | 0.0 | 0.7 | 71.6 | 20.1 | 0.4 | 100.0 |
| Other | 10.0 | 0.3 | 8.8 | 19.3 | 29.5 | 32.2 | 100.0 |
| All | 11.9 | 3.6 | 10.6 | 17.9 | 27.3 | 28.6 | 100.0 |
Some two-thirds of income support recipients who are members of a couple and just over a quarter of single income support recipients are homeowners or purchasers. This tenure is particularly important for Age Pensioners: 82.9 per cent of Age Pensioner couples and 53.4 per cent of singles are homeowners or purchasers. Public housing plays a very important role for single recipients of Disability Support Pension, with 19.3 per cent renting from state or territory housing authorities. Public housing is also used at a relative disproportionate rate by single Carer Payment recipients and single parents. Funded aged care facilities provide accommodation for 9.8 per cent of single Age Pensioners. In contrast, other groups have a very high reliance on the private rental market and on the additional support provided through Rent Assistance. This includes single parents—of whom 45.3 per cent receive Rent Assistance in the private market—and singles and couples on Newstart Allowance.
Living arrangements—couples
While we tend to segment the population as couples or singles, it should not be assumed that all couples share the same payments (indeed, since both members of a couple must qualify for income support in their own right, a substantial number of partnered people do not have a partner on income support). Of the 775,9049 couples where both members receive income support, 80 per cent have both members on a pension, 10.9 per cent have one member on a pension and one on an allowance, and the balance of 9.1 per cent have both members on an allowance.
The main combinations of payments are in Table 8 and Table 9. The most common arrangement is where both members receive the Age Pension (63.9 per cent of couples) followed by 6.3 per cent of couples where one member is on Disability Support Pension and one on an allowance, and 6.0 per cent of couples where one receives Disability Support Pension and the other is on Carer Payment.
| Partner | ||||||
|---|---|---|---|---|---|---|
| Age Pension | DSP | Carer payment | Other pension | Allowance | ||
| Person | ||||||
| Age Pension | 63.9% | |||||
| DSP | 4.1% | 3.7% | ||||
| Carer Payment | 1.9% | 6.0% | 0.1% | |||
| Other Pension | 1.9% | 2.8% | 0.0% | 0.0% | ||
| Allowance | 4.3% | 6.3% | 0.9% | 0.0% | 4.2% | |
| % Paid as a single | % Paid at couple rate |
Total | Of those with a partner on income support: partner payment type |
||||||||
|---|---|---|---|---|---|---|---|---|---|---|---|
| Partner not on payment | Partner on payment | Age Pension | DSP | Carer Pay-ment | Other pension | Allow-ance | Total | ||||
| Age Pension | 43.8 | 3.3 | 52.9 | 100.0 | 91.3 | 2.9 | 1.3 | 1.3 | 3.1 | 100.0 | |
| DSP | 65.4 | 6.7 | 27.9 | 100.0 | 15.4 | 28.1 | 22.6 | 10.4 | 23.6 | 100.0 | |
| Carer Payment | 35.2 | 9.5 | 55.3 | 100.0 | 20.8 | 66.7 | 2.1 | 0.0 | 10.3 | 100.0 | |
| Other Pension | 92.0 | 0.0 | 8.0 | 100.0 | 40.5 | 59.5 | 0.0 | 0.0 | 0.0 | 100.0 | |
| Allowance | 67.5 | 10.4 | 22.1 | 100.0 | 21.5 | 31.6 | 4.7 | 0.0 | 42.2 | 100.0 | |
In many cases different payment combinations make little financial difference. However, the increasing diversity of income support packages noted in Section 1.2.3 means there can be marked differences in the packages available for different households.
Eligibility for Carer Payment, uniquely, depends on a commitment by the recipient to maintain a relationship with at least one other person—in this case, in a caring role. Detailed analysis of the relationships between carers and care receivers shows:
- 85 per cent of recipients care for a direct relative (42 per cent for partners, 25 per cent for children and 18 per cent for parents)
- 88 per cent of those cared for also receive an income support payment
- 12 per cent of carer/care receiver circumstances involve a 55- to 64-year-old caring for a 55- to 64-year-old Disability Support Pensioner (typically a partner looking after their spouse), followed by 7 per cent where a 55- to 64-year-old is caring for an Age Pensioner over 75 years (typically a child looking after an aged parent).
Living arrangements—single people
As noted earlier, 58 per cent of income support recipients receive income support as a single person. As noted in Chapter 1, singles are paid at a higher rate than each member of a couple in recognition of the fact that single people living alone may not have the same household economies of sharing expenses as those experienced by a couple. However, being paid as a single person is not synonymous with living alone. Single recipients may live in many different household arrangements—children living with their parents, or older relatives living in extended families or sharing housing with other people.
Data on living arrangements is not easily available from administrative sources, but an insight can be obtained from household survey data produced by the Australian Bureau of Statistics (ABS) and presented in Table 10.10
| Proportion single | Proportion of singles living by themselves | |
|---|---|---|
| Age Pension and related | 41.9% | 73.7% |
| DSP | 52.5% | 45.8% |
| Carer Payment | 33.1% | 4.6% |
| NSA and working age | 36.4% | 38.3% |
| Austudy/Abstudy/YA | 45.1% | 11.4% |
| Other | 31.9% | 56.6% |
When compared with administrative data, the ABS reports smaller proportions of people receiving income support as a single person; however, of interest here is the living arrangements of those identified as single. Single recipients of Carer Payment are the least likely to be living by themselves (just 4.6 per cent). In contrast, 73.7 per cent of single Age Pensioners live alone.
The difference in the concept of 'single' for the purposes of income support payments and actual living arrangements is important because different living arrangements have different implications for living costs. While in most cases single people living with others do not achieve the same economies as an individual living as a member of a couple does, they are likely to have lower costs than a person living by themselves.
Living arrangements—dependent children
At June 2007 around 640,100 or 35 per cent of FTB Part A customers were in receipt of an income support payment (excluding DVA income support). The largest group of income support recipients were on Parenting Payment Single (398,800) or Parenting Payment Partnered (130,700), and 42,100 FTB Part A recipients were on Disability Support Pension, 20,800 on Carer Payment and 4,800 on Age Pension.
For the pension payments under consideration as part of this review, 17.8 per cent of Carer Payment, 5.9 per cent of Disability Support Pension and 2.5 per cent of Age Pension recipients receive family payments.
3.3.5 Caring and disability
This section summarises ABS 2003 Survey of Disability, Ageing and Carers (SDAC) data on caring and disability, and patterns of caring and disability across the income support system. These data show that there are carers and people with disability across all payment types, not just in the Carer Payment and Disability Support Pension populations. However, the data is not necessarily indicative of eligibility for a particular income support payment type as it uses classifications that are not consistent with the eligibility criteria for payments.
According to the ABS SDAC data from 2003, around 35.3 per cent of primary carers who provided more than 20 hours of care per week and who received some income support (or Carer Allowance) were on Carer Payment, with a further 30.2 per cent on the Age Pension or related DVA payments. Another group of carers is on Newstart Allowance and related working age payments. Table 11 cross-references the incidence of caring and disability according to ABS SDAC data with income support status as reported in the survey.
| % who are carers (a) | % of carers | %with a core disability (b) | % of those with a core disability | ||
|---|---|---|---|---|---|
| Age and related | 2.4% | 23.7% | 49.3% | 50.4% | |
| Age and related plus Carer Allowance (CA) | 58.8% | 6.5% | 57.0% | 0.7% | |
| Carer Payment | 80.7% | 26.3% | 27.2% | 0.9% | |
| Carer Payment plus CA | 94.1% | 9.0% | 20.5% | 0.2% | |
| Disability Support Pension (DSP) | 1.8% | 4.6% | 84.6% | 22.2% | |
| DSP plus CA | 36.8% | 0.7% | 100.0% | 0.2% | |
| Parenting Payment Single | 1.6% | 2.3% | 12.3% | 1.9% | |
| Parenting Payment Single plus CA | 39.5% | 1.8% | 4.6% | 0.0% | |
| Newstart Allowance and related | 2.0% | 9.1% | 17.6% | 8.6% | |
| Other income support | 1.4% | 4.3% | 11.0% | 3.5% | |
| Other plus CA | 38.8% | 2.6% | 14.2% | 0.1% | |
| CA only | 36.1% | 9.0% | 17.4% | 0.5% | |
| Under 15 | 0.0% | 0.0% | 5.7% | 10.9% |
This type of pattern is even more marked with incidence of disability. The majority who report having a disability are in receipt of the Age Pension, reflecting the increasing incidence of disability with age. There is also a marked concentration among those on Newstart Allowance and related payments. Also of note is the coincidence of both caring and having a disability amongst recipients of Carer Payment. Again, the definitions used by the ABS for survey purposes are not consistent with the eligibility criteria for income support payments.
Chart 22 provides information on Disability Support Pensioners by category of disability. Chart 23 outlines the first listed medical condition for care receivers (mapped to the current version of the International Classification of Diseases (ICD-10), as reported by Carer Allowance recipients. Carer Allowance (child) is paid to carers of a child aged under 16 years, and a different assessment process is used compared with Carer Allowance (adult). The first listed medical condition does not necessarily correspond with the main type of disability of the care receiver.
Chart 22. Disability Support Pensioners by medical category
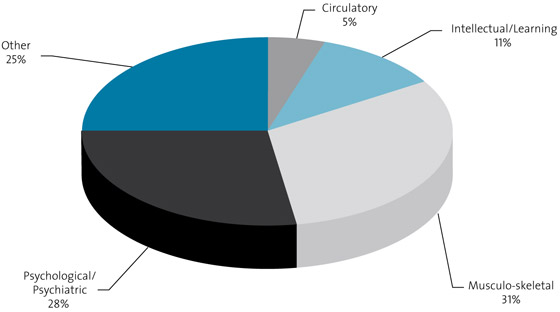
The four major medical categories for people on Disability Support Pension have remained unchanged between 2006 and 2008. Comparisons between the 2008 data and data from 2006 show that the proportion of people with musculo-skeletal and connective tissue conditions has declined slightly and the number of people with psychological/psychiatric illnesses and intellectual and learning disabilities has increased.
Chart 23. Medical condition of carees of Carer Allowance recipients
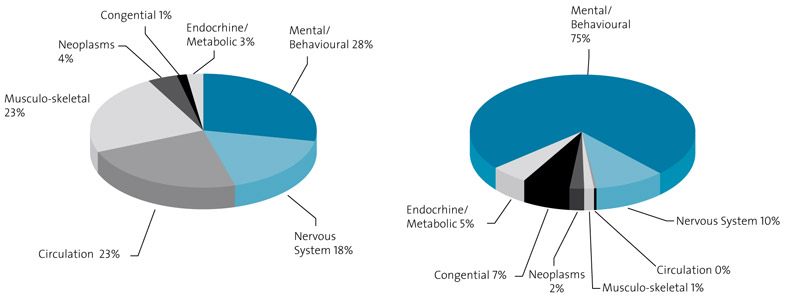
The category of mental and behavioural disorders formed the largest proportion of all first-listed medical conditions for Carer Allowance care receivers.
While the four main categories of disability are consistent across both genders in each of the adult and child populations, there is a difference in the proportion of males and females with specific conditions. In the Carer Allowance (adult) care receiver population, fewer women than men have a mental and behavioural disorder but more women have a musculo-skeletal or connective tissue disorder. For children, around 71 per cent of male Carer Allowance (child) care receivers have a mental and behavioural disorder compared with just over 51 per cent of females, although more girls have a congenital malformation or chromosomal abnormality than boys.
3.4 Participation and private resources
The structure of income support payments encourages participation in employment and accumulation and use of savings. The interaction of the income support system with the labour market and the broader retirement income system is a crucial part of the way it supports the wellbeing of Australians. Access to private income, particularly through work and savings—especially superannuation—provides many Australians with a higher standard of living than could be achieved by the income support system alone. Conversely, those with no or low levels of private savings must rely solely on the income support system to provide them with a basic acceptable standard of living.
3.4.1 Participation
A significant number of income support recipients participate in the workforce. As illustrated in Chart 24, the level of participation varies by payment type. (Comparisons between payments need to be made with care because of the different means testing and other conditions of payment, which would result, for example, in a low-income, full-time worker still being eligible for most pension payments but precluded from most allowances.)
Chart 24. Employment of income support recipients, 2005–06
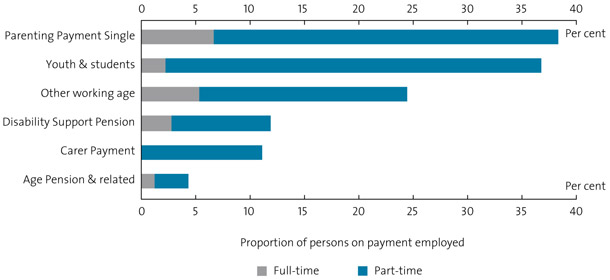
Low levels of participation are recorded amongst Age Pensioners, where 1.2 per cent report working full-time and 3.1 per cent part-time. Amongst recipients of Carer Payment there is a higher level of participation of 11.1 per cent. This employment is all part-time. The eligibility rules for Carer Payment preclude full-time work on the basis that the carer must be providing constant care.
The participation rate of Disability Support Pension recipients is a little higher at 11.9 per cent, with a small number reporting full-time employment. Although it is not generally possible to work full-time for award wages while receiving Disability Support Pension, it would be possible in some circumstances if the person was legally blind or had an intermittent disability. It is also possible for a Disability Support Pensioner to be working full-time in a business service, or while in receipt of a Supported Wage subsidy.
In relation to carers, the ABS' Survey of Disability, Ageing and Carers (2003) indicates that fewer than 40 per cent moved from employment into caring, although some were caring before giving up employment. Amongst this group, one-third reported they gave up employment because there were no alternative care arrangements; one-third did so because they felt they could provide better care; one-sixth did so because they felt an emotional obligation to provide care; and the balancing one-sixth gave other reasons.
3.4.2 Income
Income support recipients often have private income from a range of sources, such as paid work and earnings on investments, including superannuation. The effects of private income on the total support of a household can be diverse because income may be assessed in different ways for different payments (for example, all superannuation and rollover investments are disregarded for income and assets test purposes for those under Age Pension age while in the accumulation phase).
It is important to note that most income support recipients have low levels of private income. Just over one-third of income support recipients (35.5 per cent) have no private income and a further 22.3 per cent have private income of less than $20 per week.
More than half of the people on Disability Support Pension, other working age payments and youth support report having no private income, as do 48 per cent of carers. The two groups with the most significant levels of private income are the aged and those on Parenting Payment Single.
Among the aged, while only 13.3 per cent report no private income a further 28.2 per cent have only small amounts of private income (of up to $20 per week). Overall, 25 per cent of those on age-related payments have private income of over $100 per week. The income pattern of single parents is somewhat different, with 59.0 per cent on incomes of below $10 per week and many of the rest on quite high private incomes (30 per cent on over $200 per week and 15 per cent on over $450 per week). This reflects the high level of employment amongst this group.
When comparing the relative incomes of people on different payments it is important to note, as mentioned above, that there is also interaction between the means testing of particular payments and the apparent level of income. For example, pensioners can earn levels of income that would disqualify an allowee and will hence show as having some people on higher income than the allowance data.
Chart 25 and Chart 26 look at the level of private income received by income support recipients in two ways. Chart 25 shows the percentages of income support recipients with various levels of private income. Chart 26 shows the cumulative distribution of pension recipients by private income, highlighting the different private income levels of people on different payments.
Chart 25. Private weekly income by income support payment type, September 2007
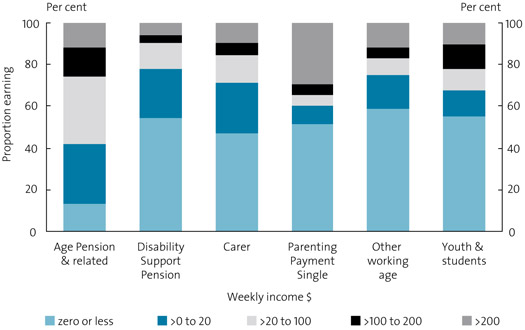
Chart 26. Cumulative private income by income support payment, September 2007
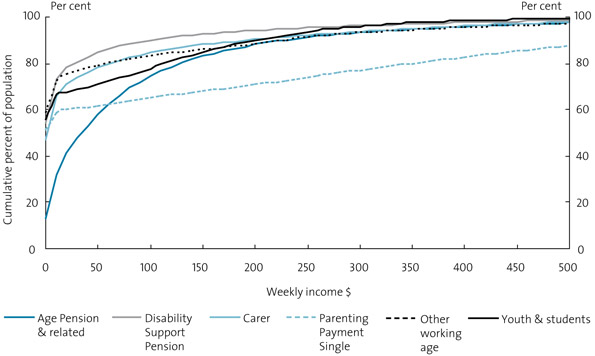
Those income support recipients who do have significant levels of private income are able to achieve living standards well above the base rate of pension. While rewarding people who have private income is important to the way the income support system operates (as noted in Chapter 1), it also results in considerable variations in the living standards of recipients of transfer payments. This is shown in Chart 27, which shows the pension and non-pension income of Age Pensioners, ranked by their total income, as a multiple of the base rate of pension.
Chart 27. Total income of Age Pensioners as a proportion of pension, September 2007

This chart also shows the distribution of private income and its effect on total income and pension income:
- as private income increases, the total income increases
- as private income increases, pension income decreases.
The slow withdrawal rate of the Age Pension as private income increases (the income test taper) means there is a small but significant group of people receiving Age Pension who have household income over one-and-a-half times the Age Pension rate. Some four per cent receive incomes more than double the Age Pension rate.
The proportion of Age Pensioners with significant levels of private income is expected to grow in the future as the Superannuation Guarantee matures.
There will still be some pensioners, however, with little private income or assets. These pensioners may have spent considerable parts of their working life out of the workforce and/or much of their working life pre-dated the Superannuation Guarantee arrangements. Others may have withdrawn some or all of their superannuation savings under hardship and compassionate grounds.
These factors restrict the capacity to accumulate savings. They also mean that, with the growing proportion of Age Pensioners who have substantial private resources, there will be increased diversity in the income and assets holdings of Age Pensioners.
3.4.3 Wealth
As is the case with income, while most income support recipients have low levels of private wealth, particularly when the family house is excluded, some have substantial wealth or live in households with others who have considerable assets. The September 2007 relaxation of the assets test taper means pensioner couples can potentially have assessable assets from zero to $856,000 (in addition to the family home, which is exempt). Few income support recipients have the maximum allowable level of assets.
There are different ways of looking at wealth and income support receipt. In the next analysis total household wealth is considered using ABS data that incorporates all assets including items such as the family home, which is excluded from income support assets testing arrangements (and as such is not included in Centrelink administrative data) and household debt. Chart 28 examines the population as a whole divided into net wealth deciles and shows that, while income support recipients are most highly represented in the lowest wealth decile, they are also found in households across the wealth distribution. Of particular note is the concentration of Age Pensioners and related recipients in the upper end of the middle of the distribution and the number of Disability Support Pensioners who are more highly represented at the bottom.
Chart 28. Income support recipients by net household wealth, 2005–06
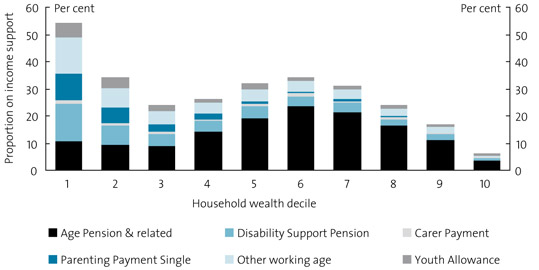
Income support payments play a much more important role in low-wealth households than they do in high-wealth households (Table 12). This indicates that 26.5 per cent of households relying on income support for 90 per cent or more of their household income are in the lowest wealth decile.
| Household wealth decile | Household reliance upon income support | |||
|---|---|---|---|---|
| Under 10% | 10–<50% | 50–90% | 90%+ | |
| 1 | 5.6 | 6.4 | 11.5 | 26.5 |
| 2 | 8.4 | 11.9 | 11.1 | 12.5 |
| 3 | 10.4 | 11.6 | 6.5 | 8.8 |
| 4 | 9.7 | 10.2 | 8.8 | 11.4 |
| 5 | 8.7 | 11.2 | 11.5 | 12.2 |
| 6 | 9.0 | 9.8 | 14.4 | 11.3 |
| 7 | 9.1 | 11.7 | 14.8 | 8.7 |
| 8 | 11.0 | 10.6 | 12.8 | 4.9 |
| 9 | 12.7 | 10.1 | 7.2 | 2.8 |
| 10 | 15.5 | 6.4 | 1.2 | 0.8 |
| Total | 100.0 | 100.0 | 100.0 | 100.0 |
A second snapshot looks at the wealth of a subset of the income support population living in households who mainly rely on income support. The distribution of net wealth11 (again in relation to all assets, including the family home) and debts, including consumer credit and Higher Education Contribution Scheme liabilities, in these households by main type of income support received is outlined in Chart 29. This chart ranks households receiving particular payments by wealth, from poorest to richest, and plots the cumulative proportion of households by level of net assets.
Chart 29. Transfer reliant households: distribution of net wealth, 2005–06
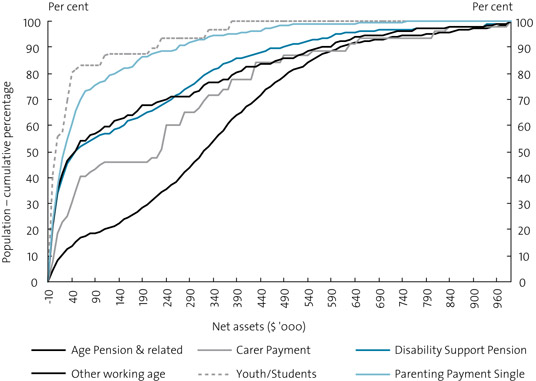
Again, most households have low levels of wealth, although there are considerable variations in wealth even among households that rely on income support for half or more of their income:
- some five per cent of households where the main sources of income support were the Disability Support Pension, Parenting Payment Single and other working age payments, as well as 15 per cent of those mainly receiving student assistance, had total assets of little more than $1,000
- the poorest five per cent of households with the Age Pension and related payments as their main source of income had assets up to $11,550, and fewer than 20 per cent had assets under $100,000
- more than 75 per cent of welfare dependent households with Parenting Payment Single as their main source of income had wealth below this point
- at the upper end of the distribution, more than 20 per cent of households reliant on the Age Pension and related payments had net assets of over half a million dollars, as do almost 15 per cent of those with Carer Payment as their main source of income and around 10 per cent of those with Disability Support Pension as their main source of income.
An important explanation for differing distributions is the different lifecycle points at which payments are made and the fact that assets usually accumulate over a long period.
Chart 28 and Chart 29 include the family home in the household's wealth. These recorded wealth levels therefore cannot easily be converted into cash to support living standards (although owner-occupied housing supports living standards in other ways).
A further insight into this is given by looking at the components of wealth. Chart 30 ranks households that rely upon income support payments for more than half their income into deciles of wealth. For all deciles the family home is the largest component of wealth. Of particular note are the relative low levels of superannuation assets. For some this may be because they have already drawn down this asset, but for most it reflects low levels of accumulation.
Chart 30. Transfer reliant households: composition of wealth, 2005–06
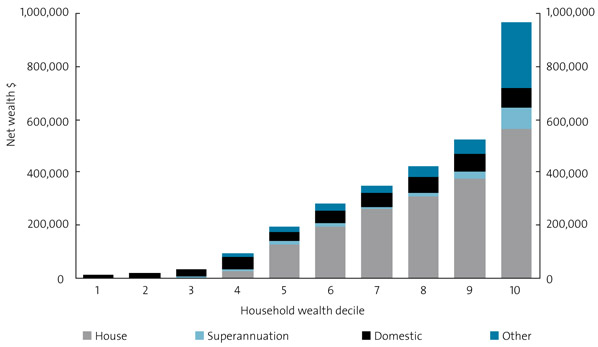
As noted, assessable assets—those taken into account in means testing payments—are a more limited subset of all assets. A non-homeowner aged couple can have assets of up to $981,000 and still gain a part-pension, and many Age Pensioners have significant levels of assessable assets. Of new entrants to the Age Pension in 2006-07, the average assessable assets of those transferring from another payment was $53,000, for those transferring from the Commonwealth Seniors Health Card it was $147,000 and for others it was $102,000. The majority of current Age Pensioners have assessable assets of under $50,000.
As with income, the average wealth holdings of Age Pensioners is expected to increase as the Superannuation Guarantee matures.
Appendix A: Transfer payments and concession cards
Income Support Payments
This section outlines the broad eligibility criteria for the income support payments in the Australian transfer system. Most such payments apply a 104 week waiting period or residence requirement to newly arrived residents, with exemptions for certain specified new entrants.
Payment rates and means testing provisions as at 1 July 2008 are outlined at Appendix C.
Age Pension is available to men and women at Age Pension age, which is 65 years for men and 63½ years for women (increasing to 65 by July 2013). Generally, a claimant is required to be an Australian resident and in Australia at the time of claim, unless they are claiming under an International Social Security Agreement. To receive Age Pension a person must have prior residence of 10 years or more, with at least five years in a continuous block (they can include, under certain International Agreements, periods of residence in the agreement country). Under certain limited circumstances people may be exempt from the 10-year residence requirement.
Disability Support Pension is for people aged 16 and over (new entrants must be under Age Pension age), with a physical, intellectual or psychiatric impairment (assessed as 20 points or more under the Impairment Tables) that prevents them from working, or being re-skilled to work, for 15 hours a week at or above the minimum wages for at least the next two years. Recipients of the payment at 10 May 2005 are required to be unable to work 30 hours a week. Similar prior residence requirements as Age Pension apply unless the person became unable to work while in Australia.
Special provisions allow recipients who commence work or increase their earnings on a long term basis to have their eligibility 'suspended' for up to two years, rather than cancelled, allowing them to return to payment if they cease work or reduce their hours of work. Disability Support Pension is non-taxable for recipients under Age Pension age.
Carer Payment is a pension for a person providing constant care for a person with disability or severe medical condition, or who is frail aged; a child with profound disability; two or more children with disability; or an adult and that adult's dependent child who needs care permanently or for an extended period. The person being cared for must receive an income support or service pension, or not have qualifying residence for a pension, or meet the Special Care Receiver income and assets limits. They are not required to live with or adjacent to the person being cared for. A Carer Payment recipient can participate in employment, education, training or unpaid voluntary work for up to 25 hours a week without it affecting their eligibility.
Bereavement Allowance is a pension paid for up to 14 weeks to a recently widowed person, without a qualifying child for Parenting Payment Single, following the death of their partner (the period can be extended if the widow is pregnant).
Newstart Allowance is for people between 21 and Age Pension age who are regarded as unemployed, and who satisfy the requirements of an activity test (or are exempted from activity testing, for example, due to a temporary incapacity for work). Activity requirements are tailored to the individual's capacity to work. For example, reduced requirements apply to people with disability with a partial capacity to work and principal carers of older children (aged 6 to 15 if partnered and 8 to 15 if single). The most common activity requirement is to seek and accept suitable work. Other agreed activities are designed to improve employment prospects.
Sickness Allowance is for people who are temporarily incapacitated for work or study as a result of illness, and who have a job or course of study to return to (if aged 25 plus).
Parenting Payment is for principal carers of dependent children. Claimants must have a qualifying child aged under six if the carer is partnered or under eight if the carer is single. A person must enter into an activity agreement with part-time requirements if the youngest child is aged six or more. Those who were on Parenting Payment at 30 June 2006, must have a qualifying child aged under 16 and must enter into an activity agreement with part-time requirements if the youngest child is aged seven or more.
Parenting Payment for a single parent is a pension. Parenting Payment for a partnered person is an allowance. To receive Parenting Payment a claimant must have two years prior Australian residence. This period is waived for people whose partner dies while they are in Australia.
Widow Allowance is for older women (born on or before 1 July 1955) widowed, divorced or separated prior to turning 40 and with no recent workforce experience at the time of initial claim. No recent workforce experience is defined as having not worked at least 20 hours a week for 13 weeks or more in the 12 months before claim. Payment rates and means testing as for Newstart Allowance (for a single person).
Youth Allowance is an income support payment for young people aged 16-20 and full-time students aged 21-24. Youth Allowance (student) is for full-time students in secondary or tertiary education or training and full-time Australian Apprentices aged 16 to 24 years. The student must be undertaking an approved course of study. Youth Allowance (other) is for young people aged 16 to 20 who are not in full-time study, seeking or preparing for work or temporarily unable to work. Youth Allowance for non-independent under 18 year olds is paid to a parent, unless the parent directs in writing otherwise.
Rates for people with children are similar to equivalent Newstart Allowance rates. A lower rate is paid to partnered young people without children or living away from home. Rates are lower again, and age related, if the young person is living at home. Youth Allowance for non-independent young people is subject to parental means testing arrangements: a parental income and family assets test applies unless a parent receives an income support payment or holds a low income Health Care Card; a family actual means test applies to families with specified financial arrangements. The payment includes young people assessed as only having a partial capacity for work—this group is not subject to parental means testing.
Austudy Payment is for people over 25 who are full-time students in study or training or full-time Australian Apprentices. The student must be undertaking an approved course of study. Payment rates and income testing are the same as Youth Allowance for an independent young person, except that they are not paid the lower 'at home' rate.
ABSTUDY is for full-time secondary and tertiary students and apprentices who are Aboriginal or Torres Strait Islander. Payment rates are generally equivalent to Youth Allowance (Student) and Newstart Allowance for over 21-year-olds. ABSTUDY has a range of supplementary benefits in addition to living allowance payments.
Special Benefit is for those who are in financial hardship but who are not eligible for any other type of payment. The rate of Special Benefit is discretionary but cannot exceed that otherwise payable to Newstart Allowance or Youth Allowance recipients. The payment is activity tested in some cases, and is paid subject to strict liquid assets test limits and any income is subject to a dollar for dollar income test. Special Benefit may be paid to newly arrived residents within the 104-week waiting period.
Payments closed to new entrants: Some recipients receive payments that are closed to new entrants. Recipients are not subject to participation requirements. These payments include:
- Mature Age Allowance is for people aged 60 years to Age Pension age receiving an income support payment for nine months or more with no recent workforce experience (closed to new entrants 20 September 2003, phased out by 20 September 2008).
- Partner Allowance is for partners of income support recipients born on or before 1 July 1955 with no recent workforce experience at the time of claim (closed to new entrants from 20 September 2003).
- Widow B Pension is paid to widowed, divorced or separated women aged 50 years and over on 1 July 1987, and women aged 45 years and over on 1 July 1987 who received Sole Parent Pension (or one of its forerunners) on or after that date and made a claim before 20 March 1997 (closed to new entrants from 20 March 1997).
- Wife Pension (Age) is a payment for female partners of recipients of Age Pension where those partners are not eligible in their own right for another pension (closed to new entrants from 1 July 1995).
- Wife Pension (Disability Support Pension) provides income support for female partners of people receiving Disability Support Pension who are not eligible for a pension in their own right (closed to new entrants from 1 July 1995).
Payments to veterans and their dependents
A service pension is paid to veterans on the grounds of age or invalidity, and to eligible partners, widows and widowers. The age service pension is paid to veterans who have qualifying service and the partner service pension is paid to eligible partners and widows. These service pensions are paid five years earlier than the Age Pension in recognition of the intangible effects of war. The invalidity service pension may be granted at any age up to age 65. The rate of service pension is indexed in the same way as Age Pension.
Disability pension is available to compensate veterans for injuries or diseases caused or aggravated by war service or certain defence service rendered on behalf of Australia before 1 July 2004. It is a non-taxable pension.
The War Widow's/Widower's and Orphan's Pension is paid to compensate widowed partners and dependants of veterans who have died as a result of war service or eligible defence service. War widow's/Widower's Pension is not affected by other income except from other compensation payments.
The Income Support Supplement (ISS) is a payment made in addition to a War Widows/ers' Pension to assist recipients who may not have any other source of significant income. It was announced in the 1994-95 Budget and introduced in March 1995 to rationalise and simplify income support arrangements paid in addition to a War Widows/ers' Pension. Instead of a recipient having to approach Centrelink and qualify for one of three or four different income support payments such as Age Pension or Disability Support Pension under the Social Security Act 1991, the person can claim the Income Support Supplement with the Department of Veterans' Affairs. To qualify for the Income Support Supplement, the person must be an Australian war or defence widow/er, and not be in receipt of another income support pension. From 1 July 2008, there is no longer an age requirement for the Income Support Supplement. War widow/ers who are under pension age (currently 63.5 for females, 65 for males) may access the Income Support Supplement as a tax-free payment if they are incapacitated. The Income Support Supplement, like the other income support payments, is income and asset tested but is capped at a lower ceiling rate, recognising that War Widows/ers' Pension is also paid and is counted as income.
In analysis the Service Pension and Income Support Supplement are treated as income support as they are both means tested payments.
Family Assistance Payments
This section outlines the broad eligibility criteria for family assistance payments in the Australian transfer system. Payment rates and income testing provisions as at 1 July 2008 are outlined at Appendix C.
Family Tax Benefit (FTB) Part A is a per child payment to assist families with the direct costs of raising children. It is available to parents who provide care of dependent children for 35 per cent or more of the time. FTB Part A also includes assistance for families with private rental costs for families with children aged under 16 (Rent Assistance), three or more children (Large Family Supplement), and multiple births with three or more surviving children of the one confinement (Multiple Birth Allowance). FTB Part A has two rates—a 'maximum' rate and a 'base' rate paid—both subject to income but not assets tests. Children aged 13 to 15 have a higher maximum rate than younger children because teenagers cost more. Lower rates of payment are available for children from 16 to 24, as Youth Allowance becomes available to children in low income families once a child turns 16. However, increases in the generosity of FTB rates and means testing arrangements for children aged under 16 relative to those applying to Youth Allowance now result in almost all families experiencing a reduction in government assistance when a child turns 16. The FTB Part A family income test does not apply if parent receives an income support payment. The maintenance income test applies to FTB Part A above the base rate (including Rent Assistance).
Family Tax Benefit (FTB) Part B is a per family payment, paid to single parents and couples with one main income earner with a dependent child aged under 16 or a qualifying full-time student aged 16 to 18. FTB Part B for couple families is paid subject to an income test on the second earner and only available to couple or single parent families with a primary earner with income of $150,000 per year or less. FTB Part B has a higher rate for families with a child aged under 5.
FTB is a paid as a fortnightly payment to most families based on an estimate of total family adjusted taxable income. Families can elect to wait until their adjusted taxable income is known and claim the payment as a lump sum. FTB supplements are available at the end of the tax year and can be used to offset any debt arising from an incorrect estimate of income. Where the care of a child is shared between two or more adults (each with more than 35 per cent of the care) who are not members of the same couple, FTB can be 'shared'. FTB is not subject to assets testing.
Baby Bonus is a lump sum payment of $5,000 paid on the birth or adoption of a child. From 1 January 2009 Baby Bonus will be paid as 13 fortnightly instalments and only available if family income in the six months following the birth or adoption of a child is $75,000 or less.
Double Orphan Pension is provided to a guardian or approved care organisation with the care and control of a child where both parents have died or one parent has died and the other parent is unable or unavailable to care for specific reasons.
Maternity Immunisation Allowance is a one-off lump sum payment for children who are aged 18 to 24 months and fully immunised (unless exempted). From 1 January 2009 it will generally be made in two payments: for children who have received the immunisations required for an 18 month old and a four year old. Family assistance payments are non-taxable.
Child Care Benefit (CCB) is available for families using child care provided by an approved child care service or registered carers. Approved services can include Long Day Care, Family Day Care, Outside School Hours Care, Vacation Care and some Occasional and In-Home Care. Registered care includes nannies, relatives or friends registered as carers. Families who are eligible for CCB for approved care can get up to 24 hours of CCB per child per week regardless of their work status. Families where both parents or a single parent are working, studying, training or looking for work for at least 15 hours a week (unless exempted) are eligible for up to 50 hours of CCB per child per week for approved care. CCB for registered care is paid only where both parents or a single parent are working, studying, training or looking for work at any time in the week. There is a weekly limit of 50 hours of CCB for registered care.
CCB for approved care is subject to a family income test. The maximum rate is payable if a parent is on income support, or if their family income is below the relevant income threshold. Most families using approved care choose to receive their CCB as a reduction in fees. The other option is as a lump sum after the end of the year. There is no income test for CCB for registered care.
Child Care Tax Rebate meets 50 per cent of the out-of-pocket child care expenses for approved care up to a limit of $7,500 per child per annum and can be paid quarterly or annually. To receive payment, the claimant must have been assessed as eligible for CCB and both parents or a single parent must be working, studying, training or looking for work.
Other Supplementary Payments
This section outlines the broad eligibility criteria for supplementary payments in the Australian transfer system as at 1 July 2008. Further detail is provided at Appendix D.
Rent Assistance (RA) is an increase in the rate of income support or FTB Part A for people available to eligible income support and FTB recipients paying private rent above minimum thresholds. It is paid at a rate of 75 cents for every dollar above the threshold until a maximum rate is reached. The maximum rates and thresholds vary according to a customer's family situation and the number of children. For singles without children, the maximum rate may also vary according to whether or not accommodation is shared with others. For families with children aged under 16 it is paid as part of the FTB Part A and subject to the family payment income test (unless receiving income support) and the maintenance income test. RA is withdrawn at the same rate as the primary payment, for example, 20 per cent for families receiving RA with FTB Part A, 60 per cent for allowance recipients and 40 per cent for pensioners (20 per cent for each partner). RA is non-taxable.
Remote Area Allowance (RAA) provides assistance to income support customers residing in defined remote areas, recognizing that many do not get the full benefit of tax zone offsets. RAA is a contribution towards some of the costs associated with living in particularly remote areas. It is paid in addition to the income support rate and is not reduced by the income or assets test.
Telephone Allowance (TAL) is a quarterly payment to assist with the cost of maintaining a telephone service. It is paid to pensioners, certain allowees and Commonwealth Seniors Health Card holders who are telephone subscribers. A higher rate of Telephone Allowance is payable for income support recipients of Age Pension age, Commonwealth Seniors Health Card holders, and Disability Support Pension and Carer Payment if a person or their partner have a home internet connection.
Utilities Allowance (UA) is a payment to assist with regular household bills. It is paid to people of age (or veteran) pension age in receipt of income support, and to recipients of Mature Age, Widow and Partner Allowances, Disability Support Pension, Carer Payment, Bereavement Allowance, Widow B Pension, Wife Pension, Invalidity Service Pension and Income Supplement. UA is paid quarterly. Eligibility test days are 20 March, 20 June, 20 September and 20 December.
Seniors Concession Allowance (SCA) is a similar payment to UA. It is paid to Commonwealth Seniors Health Card holders and DVA Gold Card holders of service pension age who do not already receive UA.
Pensioner Education Supplement (PES) is paid to students in approved study on: Parenting Payment Single, Disability Support Pension, Carer Payment, Special Benefit (in some circumstances), Widow Allowance, Widow B Pension and Wife Pension (in some circumstances), Newstart Allowance, Youth Allowance and certain other allowees transferred from Disability Support Pension or Parenting Payment Single who previously receiving PES.
Education Entry Payment (EdEP) is a lump-sum payment to assist with the cost of beginning approved study. It is available to PES recipients (available annually), and to recipients of Parenting Payment Partnered, Mature Age, Newstart Allowance, Partner and Widow Allowances if they have been on income support for at least 12 months.
Work for the Dole Supplement is a fortnightly supplement to help Newstart Allowance recipients and Youth Allowance recipients with the cost of participating in Work for the Dole programs.
Language, Literacy and Numeracy Supplement is a fortnightly supplement to help people on eligible income support payments with the costs associated with participating in the Language, Literacy and Numeracy program.
Pension Bonus Scheme pays a one-off lump sum to people who defer receipt of Age Pension and continue to work.
Pension Bonus Bereavement Payment is one-off lump sum to the surviving partner of a deceased Pension Bonus Scheme member who did not make their claim for a Pension Bonus before their death.
Crisis Payment is a one-off payment to help people who are in severe financial hardship. It is available to social security income support recipients forced to leave their own home due to extreme circumstances, such as a natural disaster, or who are victims of domestic violence, newly released prisoners or newly arrived humanitarian entrants.
Mobility Allowance is a non–means tested income supplement for people with disability aged 16 or over and unable to use public transport without substantial assistance. There are two rates of Mobility Allowance. A higher rate is paid to recipients of Disability Support Pension, Newstart Allowance and Youth Allowance (Other) working at least 15 hours a week or looking for such work, the lower rate is paid to other recipients.
Carer Allowance is for people who provide daily care and attention at home to a person with disability or medical condition who is: aged 16 or over with substantial functional impairment; or a dependent child under age 16 who needs substantially more care than child without disability. Child Disability Assistance Payment is available to recipients of CA (child) at 1 July each year.
Carer Bonus payments were made in June 2008 following the 2008-09 Budget (and in each of the preceding four Budgets). Carer Bonus payments included a one-off lump sum of $600 to Carer Allowance recipients and a one-off lump sum of $1,000 to recipients of: Carer Payment; DVA Carer Service Pension; or Wife Pension and Carer Allowance; or DVA Partner Service Pension and Carer Allowance.
Seniors Bonus payments were made in June 2008 following the 2008-09 Budget as a one-off lump sum payment of $500 to income support recipients of age (or service) pension age; recipients of Mature Age, Partner and Widow Allowances; people qualified for Seniors Concession Allowance, Wife Pension and Widow B Pension (regardless of age). Recipients eligible for both the Seniors and Carers Bonuses received both.
Concession Cards
Pensioners and specified allowance recipients (aged 60 and over and on income support for nine months or more, 'principal carers' and those assessed as having a 'partial capacity to work') are issued a Pensioner Concession Card. Other allowance recipients (excluding student payment recipients) and eligible FTB families are issued a Health Care Card. A low-income Health Care Card can be claimed, subject to an income test, by other low income families and individuals. Self-funded retirees of Age Pension age can claim a Commonwealth Seniors Health Card, subject to an income test. Concession Cards also remain available to certain income support recipients for a period if they leave payment due to employment income.
While all cardholders have access to low-cost pharmaceuticals and a concessional Medicare Safety Net threshold, holders of the Pensioner Concession Card may receive additional concessions provided by state, territory and local governments. Discounts can apply to: fares on public transport, rates (council and water), utilities (electricity), and motor vehicle registration charges. The level of these concessions and others available to cardholders vary between state, territory and local government. Further details on concession cards see Appendix H.
Appendix B: Payment costs and recipients, 2006–07 (A)
| Expense ($ million) |
Payment description/aim | Labour force criteria | Number of recipients and payment points | |
|---|---|---|---|---|
| Aged | ||||
| Age Pension | 22,598 | Income support for people who have reached Age Pension age. | None | 1,952,686 |
| Widow B Pension | 4 | Income support for previously partnered women born before 1 July 1937 or a single parent at age 45 born before 1 July 1942 (closed 20 March 1997). | None | 732 |
| Wife Pension (Age) | 161 | Income support for female partners of Age pensioners (closed 1 July 1995). | None | 14,045 |
| Age Pensioners–DVA | (b) | Age Pension paid to eligible service pensioners and their partners. It is paid by DVA as an agent of FaHCSIA. | None | 6,068 |
| Service Pension Veterans– DVA | 2,949 (b) | Income support for people who have reached service pension age. Similar to Age Pension paid by Centrelink. | None | 113,698 |
| Service Pension (partners)–DVA | (b) | Income support for wives of service pensioners. Similar to Wife Pension paid by Centrelink. | None | 96,864 |
| Utilities Allowance | 147 | Supplementary payment available to income support recipients aged over Age Pension age. | N/A | 2,000,000 |
| Seniors Concession Allowance | 226 | Supplementary payment available to Commonwealth Seniors Health Card holders (CSHC). | N/A | 302,583 |
| Telephone Allowance (CSHC only) | 12 (c) | Supplementary payment available to CSHC holders. (Also available to pensioners and selected allowance recipients and paid quarterly with income support payment). | N/A | 292,155 |
| Total | 26,097 | |||
| Working age | ||||
| Newstart Allowance | 4,494 | Income support for the unemployed aged between 21 and Age Pension age, including those regarded as unemployed, non-full time students available for and willing to undertake suitable work. Includes people with disability with a partial capacity to work and principal carers of older children (aged 6 of more if partnered or 8 or more if single). | Must satisfy an activity test by seeking and accepting suitable work or participating in agreed activities designed to improve employment prospects (unless exempted). People with a partial capacity to work have requirements that match their assessed capacity to work. Principal carers must seek at least 15 hours work per week (unless exempted). | 417,793 |
| Parenting Payment Partnered | 1,217 | Income support for the principal carer of a child aged under 6 (under 16 if granted payment before 1 July 2006). | Part-time participation requirements (see Newstart Allowance principal carers) if youngest child is over 6 (over 7 if granted payment before 1 July 2006). | 144,427 |
| Parenting Payment Single | 4,696 | Income support for the principal carer of a child aged under 8 years (or under 16 if granted payment before 1 July 2006). | Part-time participation requirements (see Newstart Allowance principal carers) if youngest child is over 6 (over 7 if granted payment before 1 July 2006). | 395,495 |
| Sickness Allowance | 85 | Income support for people who are temporarily incapacitated for work or study as a result of illness. | Must have a job or full-time study (if aged 25 plus) to return to. | 7,624 |
| Mature Age Allowance | 88 | Income support for people aged 60 years to Age Pension age receiving an income support payment for 9 months or more (closed September 2003, phased out by September 2008). | No recent workforce experience at time of claim. | 5,032 |
| Partner Allowance | 522 | Income support for partners of income support recipients (at time of claim) born on or before 1 July 1955 (closed 20 September 2003). | No recent workforce experience at time of claim. | 45,988 |
| Widow Allowance | 505 | Income support for older women (phased out from 1 July 2005 with new grants from that date limited to women born on or before 1 July 1955) who were widowed, divorced or separated prior to turning 40. | No recent workforce experience at time of claim. | 40,247 |
| Youth Allowance (Other) | 482 | Income support for young people aged 16 to 20 seeking or preparing for work or temporarily unable to work. | Must seek and accept suitable work or participate in agreed activities (unless exempted). | 68,698 |
| Exceptional Circumstances Relief Payment | 260 | Income support for farmers in drought affected areas. | None | 28,601 |
| Utilities Allowance | 7 | Supplementary payment paid to Mature Age, Partner and Widow Allowance recipients who are not of Age Pension age. (From March 2008 also paid to Carer Payment, Wife Pension, Disability Support Pension, Widow B Pension and Bereavement Allowance recipients). | N/A | n.a. |
| Pensioner Education Supplement | 73 | Supplementary payment for certain pensioners (and former pensioners) undertaking study. | Must be undertaking an approved course. | 44,802 |
| Education Entry Payment | 16 | Supplementary lump sum payment to assist with the cost of commencing an approved study course (available annually if continuing study and receive Pensioner Education Supplement). | Must be commencing or continuing (PES recipients) an approved course. | 76,394 |
| Mobility Allowance | 106 | Supplementary payment for people with disability who are aged 16 or over and who are unable to use public transport without substantial assistance. | None | 54,492 |
| Total | 12,551 | |||
| People with disability | ||||
| Disability Support Pension | 8,651 | Income support payment for people aged 16 and over (new entrants must be under Age Pension age) with a physical, intellectual or psychiatric impairment with at least 20 points on the Impairment Tables. Special rules apply for the blind. | Because of their impairment, unable to work or be reskilled to work, at least 15 hours a week (or 30 hours if on payment at 10 May 2005) at or above the minimum wage for at least the next two years. | 714,156 |
| Total | 8,651 | |||
| Carers of people with disability | ||||
| Carer Payment | 1,408 | Income support for a person providing constant care for an adult or child with disability or a medical condition, or who is frail aged. | None | 116,614 |
| Wife Pension (DSP) | 234 | Income support for female partners of Disability Support Pensioners (closed 1 July 1995). | None | 21,228 |
| Carer Allowance | 1,349 | Supplementary payment for people who provide daily care and attention at home to an adult or child with disability or a medical condition. | None | 393,263 |
| Total | 2,291 | |||
| Students | ||||
| Youth Allowance (Student) | 1,591 | Income support for full-time students aged 16 to 24 years in secondary or tertiary education or training and apprentices aged 16 to 24. | Must be undertaking an approved course of study. | 263,257 |
| Austudy | 218 | Income support for people aged 25 and over who are studying or training full-time. | Must be undertaking an approved course of study. | 28,269 |
| Abstudy | 156 | Income support for full-time secondary and tertiary students and apprentices who are Aboriginal or Torres Strait Islander. | Must be undertaking an approved course of study. | 34,134 |
| Total | 1,965 | |||
| Special | ||||
| Special Benefit | 67 | Income support for people who are not eligible for any other type of payment and who are in financial hardship. | As for NSA. | 6,244 |
| Bereavement Allowance | 1 | Income support for a recently widowed person following the death of their partner. Paid for up to 14 weeks. | None | 553 |
| Total | 68 | |||
| Families and children | ||||
| Family Tax Benefit Part A | 16,124(d) | Per child payment for dependent children aged under 16; and dependent young people aged 16 to 20 and 21 to 24 year old full-time students not in receipt of an income support payment. Includes Rent Assistance (children aged under 16), Large Family Supplement and Multiple Birth Allowance. | N/A | 1,769,091 |
| Family Tax Benefit Part B | Per family payment to single income families including single parents, subject to a primary earner income limit ($150,000) from 1 July 2008. | N/A | 1,376,917 | |
| Child Care Benefit | 1,478 | Payment to help with the costs of child care. | Work/study/training test applies depending on hours claimed. | 560,300 |
| Child Care Tax Rebate | 450 | In 2006-07 the CCTR met 30 per cent of the out-of-pocket child care expenses for approved care, up to a limit of $4,211 per child per annum. From 2008-09 the CCTR meets 50 per cent of the out-of-pocket child care expenses for approved care, up to a limit of $7,500 per child per annum. | Must be eligible for Child Care Benefit. | 586,674 |
| Baby Bonus | 1,162 | Lump sum payment on the birth of a newborn or adopted child. Subject to family income test and paid by instalments from 1 January 2009. | N/A | 286,770 |
| Maternity Immunisation Allowance | 56 | One-off lump sum payment for children who are aged 18 to 24 months and fully immunised (unless exempted). From 1 January 2009 payment will be made as two instalments. The first instalment will be made to children aged 18 months and 2 years. The second will be made to children aged between 4 years one month and 5 years. | N/A | 242,518 |
| Double Orphan Pension | 3 | Payment for guardian or approved care organisation with the care and control of a child where both parents have died or one parent has died and the other parent is unable or unavailable to care for specific reasons. | N/A | 1,330 |
| Total | 19,273 | |||
Appendix C: Income support payments as at 1 July 2008
| Rates (per fortnight) | Income test (per fortnight) | Assets test |
|---|---|---|
| Pensions — includes Age Pension, Disability Support Pension, Carer Payment, Parenting Payment Single, Bereavement Allowance, Wife Pension, Widow B Pension and Service Pension | ||
| Single: $546.80 Partnered: $456.80 (each) Single DSP under 21, no children (Youth Allowance plus Youth Disability Supplement of $100.60, total cannot exceed adult DSP rate): <18, at home: $295.10 18-20, at home: $334.50 16-20 independent: $456.00 Member of a couple: $456.00 Rates are adjusted each March and September in line with increases in the CPI. Single adult rates are also benchmarked against 25% of MTAWE, with a proportional flow-on to partnered rates. Pensions are taxable, except for DSP and Invalidity Service Pension paid to people under Age Pension age, and Carer Payment and Wife Pension spouse where the person being cared for or the spouse is receiving a non-taxable pension. |
Free Area: $138 (single) $240 (couple) plus $24.60 per child Taper: Singles: 40% of income above free area Couples: 20% of combined income above free area for each member of couple. Working Credit* available if aged under Age Pension age. Income test does not apply to a permanently blind person receiving Age, Service or Disability Support Pension. Some income types are subject to different arrangements (for example, compensation payments may be deducted directly from the rate otherwise payable). |
Homeowners for full pension: Single: $171,750 Partnered (combined): $243,500 Non-Homeowners for full pension: Single: $296,250 Partnered (combined): $368,000 Assets over the limit reduce pensions by $1.50 per fortnight for every $1,000 above the threshold. Homeowners for part pension: Single: $540,250 Partnered (combined): $856,500 Non-Homeowners for part pension: Single: $664,750 Partnered (combined): $981,000 (Amounts are higher if receiving RA or separated due to illness) For Parenting Payment Single, see Allowances. Assets test does not apply to a permanently blind person receiving Age, Service or Disability Support Pension. |
| Allowances — excluding student and youth payments. Includes Newstart Allowance, Parenting Payment Partnered, Sickness Allowance, Mature Age Allowance, Widow Allowance and Partner Allowance | ||
| Higher single rate: $472.80 Lower single rate: $437.10 Partnered: $394.40 Higher single rate applies to: a person with a dependant child; or a person aged 60 or more and on income support for at least 9 months; and to partnered people separated due to ill-health, infirmity or because the partner is in gaol. Lower single rate applies to singles not covered by the higher rate. Rates are adjusted each March and September in line with increases in the CPI. Payments are taxable. |
Free Area: $62 Tapers: 50% of income $62-$250, 60% of income above $250 Partner income test: Free Area: $751 Taper: 60% If partner is a pensioner, then a joint income test applies. Individual income is calculated as half the combined income of the couple. This amount is then subject to the person's individual income test. If partner is not a pensioner, a sequential income test applies. Individual income test is applied to own income. Partner income over the partner income free area is subject to a 60% taper. Working Credit* applies. |
Homeowners ineligible for allowance if assets exceed: Single: $171,750 Partnered (combined): $243,500 Non-Homeowners ineligible if assets exceed: Single: $296,250 Partnered (combined): $368,000 |
Family assistance payments as at 1 July 2008
| Payment type | Rate/s | Income test (no assets test) |
|---|---|---|
| Family Tax Benefit (FTB) | ||
| FTB Part A Must have a dependant child aged under 21 or qualifying dependant full-time student aged 21-24. Child is not a dependant child (not an FTB child) if they receive an income support payment; or they are a non-full time student aged 5-15 or aged 16-24 years with income at or exceeding the FTB Child Income Limit. Rent Assistance is paid as part of the maximum rate of FTB Part A for families with children under 16. Families eligible for the maximum rate of FTB Part A (prior to the application of the Maintenance Income Test) are also issued a Health Care Card. |
Maximum rate per fortnight: 0-12: $151 13-15: $196.84 Base rate per fortnight: Under 18: $48.30 18-24: $64.96 FTB Part A supplement per child: $686.20 per annum Large Family Supplement paid for third and each subsequent child: $10.36 per fortnight, $270.10 per annum Multiple Birth Allowance: Triplets: $125.58 per fortnight, $3,274.05 per annum Quads or more: $167.44 per fortnight, $4,365.40 per annum |
Maximum rate income test per annum: Lower income threshold: $42,559 Taper rate: 20% Base rate income test per annum: Higher income threshold: $94,316 Additional Child Amount: $3,796 Taper rate: 30% FTB Child Income Limit: $12,287 per annum FTB Part A income test does not apply if parent receives an income support payment. Income for the FTB Part A income test is the 'adjusted taxable income' (ATI)* of the person claiming payment and their partner for the financial year FTB is claimed. The Maintenance Income Test applies to FTB Part A above the base rate (including Rent Assistance). Maintenance income-free areas per year: Single parent, or one of a couple receiving maintenance: $1,292.10 Couple, each receiving maintenance: $2,584.20 For each additional child: $430.70 Maintenance over these amounts may reduce FTB Part A by 50 cents in the dollar, until the base rate of FTB Part A is reached. |
| FTB Part B Must have a dependant child (FTB child) aged under 16 or qualifying dependant full-time student aged 16-18. |
Maximum rate per fortnight: Under 5 : $128.80 5-18 years: $89.74 FTB Part B supplement per family: $335.80 per annum |
Second earner income test: Income threshold: $4,526 per annum Taper rate: 20% For couples, the second earner income test applies to the ATI of the lower income earner. The second earner income test does not apply to single parents. FTB Part B income limit: payment only available if primary earner ATI is $150,000 or less. |
| Baby Bonus | ||
| Paid following birth (including stillbirth) or adoption of a baby. From 1 January 2009 will be extended to the adoption of children aged under 16. Parents are required to formally register the birth of their child. |
$5,000 per child. Paid by 13 fortnightly instalments for claimants aged 17 and under. Others recipients can be paid as a lump sum, or a combination of lump sum and fortnightly payments. From 1 January 2009, all customers will be paid by fortnightly instalment paid from the date of claim. |
Baby Bonus income limit (from 1 January 2009) — family must have income of $75,000 or less in the six months following birth or adoption. |
| Maternity Immunisation Allowance | ||
| Paid for children aged 18-24 months who are fully immunised, or have an approved immunisation exemption. | One-off payment of $236.70. From 1 January 2009, payment will be made as two instalments - one made for children aged 18 months and 2 years, the other made for children aged between 4 years one month and 5 years. |
No income test. |
| Child Care Benefit | ||
| Child must attend approved or registered care. Claimant or partner must be liable for the payment of child care fees. Child aged under 7 must have age appropriate immunisation, or have an exemption. All families eligible for up to 24 hours of approved care per week paid subject to family income test. For approved care parents must meet work/study/training test during the week child care is used to receive more than 24 hours and up to 50 hours of CCB per child. For registered care, parents must meet the work/training/study test sometime during the week child care used to receive up to 50 hours CCB. Special rules apply to grandparents with the primary care of a grandchild(ren). |
Maximum rate — approved care: $3.47 per hour ($173.50 for 50 hour week) for a non-school child. Minimum rate — registered care: $0.581 per hour ($29.05 per week) for a non-school child. Rates for school children 85% of non-school rates. |
Income test on maximum rate: Income threshold: $36,573 Taper rates: One child: 10% Two children: 15% then 25% Three or more children: 15% then 35% Income test does not apply to families on income support. CCB for approved care no longer available when family income reaches, per annum: One child: $126,793 Two children: $131,457 Three children: $148,452 (plus $28,028 for each child after the 3rd) |
| Child Care Tax Rebate | ||
| Child must have attended approved care. Claimant must be assessed as eligible for CCB. Claimant and partner must have passed the CCB work/study/training test (for the purposes of the rebate). |
50 per cent of out-of-pocket child care expenses for approved care, up to $7,500 for 2008-09. Payment made quarterly from October 2008 (for July to September). |
No income test. |
Appendix D: Supplementary payments as at 1 July 2008
| Payment type | Payment rates | Other features |
|---|---|---|
| Supplements included as part of the maximum rate of income support | ||
| Rent Assistance (RA) is additional financial assistance to private renters paying private rent. RA is paid at the rate of 75 cents for each dollar of private rent above specified minimum rent thresholds until the maximum rate is reached. RA is paid as part of the maximum rate of income support for people without dependant children aged under 16. RA is paid as part of the maximum rate of FTB Part A for families with dependant children aged under 16. |
RA WITH INCOME SUPPORT Maximum rates Single: $107.20 pf Single, sharer: $71.47 pf Couple: $101.00 pf Rent thresholds Single: $95.40 pf Couple: $155.20 pf Maximum RA paid if rent is more than: Single: $238.33 pf Single, sharer: $190.69 pf Couple: $289.87 pf RA PAID WITH FTB PART A Maximum rates: One or two children: $125.86 Three or more children: $142.38 Rent thresholds: Single: $125.44 Couple: $185.64 Maximum RA paid if rent is more than: Single, 1,2 child: $293.25 Single, 3 or more: $315.28 Couple 1,2: $353.45 Couple 3 or more: $375.48 Taper rates RA is not separately income tested but is subject to the income test of the payment it is included in. This is 20% (FTB Part A), 40% (pension), 60% (allowance). (RA paid with FTB Part A can also reduced by receipt of child support — at a MIT rate of 50%). |
RA is not generally available for income support recipients aged under 25 (under 21 for DSP) living with a parent or guardian. To get RA you must be receiving an income support payment or more than the base rate of FTB Part A. Unless eligible to receive the Rent Assistance component of FTB Part A for a regular care child(ren) (that is, at least 14 % and less than 35% care). To receive RA, a level of proof of rent expenditures is required. People in retirement villages, aged care homes and community housing can receive RA (subject to a range of conditions). Government tenants are not eligible. Maintenance income can reduce RA paid with FTB Part A but not RA paid with income support. Disability Support Pension and Carer Payment recipients are not subject to the reduced sharers' rate, nor are people in some forms of group accommodation such as boarding houses. RA is non-taxable. |
| Supplements included as part of the maximum rate of income support | ||
| Pharmaceutical Allowance (PhA) is automatically paid to pensioners and recipients of Mature Age and Sickness Allowances. PhA can also be paid to other allowance recipients, depending upon their circumstances (see details in third column). |
PhA is paid at a rate of $5.80 per fortnight for single people (and illness separated) and $2.90 per fortnight for each eligible member of a couple. PhA is paid in addition to the base pension or allowance. Non-taxable. |
PhA can be paid to recipients of allowances if they are in certain special circumstances, such as: being temporarily incapacitated, or having a partial capacity to work, or being a single 'principal carer' of a dependant child, or being aged over 60 years in receipt of income support continuously for at least nine months. |
| Remote Area Allowance (RAA) provides additional assistance to income support customers residing in remote areas. It recognises that many customers do not get the full benefit of zone tax offsets. RAA makes a contribution towards some of the costs associated with living in particularly remote areas. | $18.20 per fortnight for a single person. $15.60 per fortnight for each eligible member of a couple. $7.30 per fortnight for each dependant. RAA is in addition to the relevant pension or payment. RAA is not indexed, and while it is not taxable, it does reduce the amount of any Tax Zone Offsets otherwise available. |
RAA is payable to pensioners and allowees (and Abstudy recipients) who usually reside in ordinary Tax Zone A (including, with certain exceptions, Special Tax Zone A) and Special Tax Zone B. RAA is not reduced under the income and assets tests, it is added to any pension or payment after the income and assets tests have been applied. |
| Supplements paid in addition to income support or concession card entitlement | ||
| Telephone Allowance (TAL) is a payment to assist with the cost of maintaining a telephone service. It is paid to pensioners, certain allowees and CSHC holders who are telephone subscribers. A higher rate of TAL is payable for income support recipients of Age Pension age, CSHC holders, and DSP and CP if a person, or their partner, has a home internet connection. |
$88.00 per annum ($22 per quarter) for singles and couples combined. The higher rate of TAL for home internet subscribers is $132.00 per annum ($33 per quarter) for singles and couples combined. Non-taxable. |
TAL is paid quarterly with the customer's regular income support payment. Eligibility test dates are 1 January, 20 March, 1 July and 20 September. TAL is adjusted annually for increases in the CPI. |
| Utilities Allowance (UA) is a payment to people of Age (or Veteran) Pension age in receipt of an income support payment, and to recipients of Mature Age, Widow and Partner Allowances, Disability Support Pension, Carer Payment, Bereavement Allowance, Widow B Pension, Wife Pension, Invalidity Service Pension and Income Supplement regardless of age. | $500 per annum ($125 per quarter) for singles. $250 per annum ($62.50 per quarter) for each eligible member of a couple. Non-taxable. |
UA is paid quarterly. Eligibility test dates are 20 March, 20 June, 20 September and 20 December each year. UA is adjusted twice a year for increases in the CPI. UA is intended to provide assistance towards regular household bills and is paid regardless of whether a person is liable for utilities bills. |
| Seniors Concession Allowance (SCA) is a similar payment to UA paid to Commonwealth Seniors Health Card and Department of Veterans' Affairs Gold Card holders of pension age are also eligible for SCA who do not already receive UA. | $125 per quarter for each recipient of SCA, whether single or partnered. | Similar to UA. |
| Pensioner Education Supplement (PES) is paid to the following income support customers if they are studying: Parenting Payment Single, Disability Support Pension, Carer Payment, Special Benefit (in some circumstances), Widow Allowance, Widow B Pension, Wife Pension (in some circumstances), Newstart Allowance/Youth Allowance (previously received PES while on Parenting Payment), and certain other allowees transferred from Disability Support Pension previously receiving PES. | PES is paid at two rates: $62.40 per fortnight or $31.20 per fortnight. Rate depends on study load and the person's income support payment. A person can get the $62.40 per fortnight rate if their approved study load is 50% or more of a full time study load; or they are a Disability Support Pensioner or an Invalidity Service Pensioner with an approved study load of at least 25%; or they are a War Widow(er) Pensioner with a dependant child with an approved study load of at least 25%. A person can get the $31.20 per fortnight rate if their approved part-time study load is at least 25% of a full-time study load. |
To receive PES, a person must be enrolled in an approved course of secondary or tertiary study. Part-time study load students can usually get the supplement for twice the minimum period it takes to finish their course as a full-time student. Fares Allowance is payable to tertiary PES students who live away from a partner or child to study. |
| Education Entry Payment (EdEP) is a lump-sum payment to assist with the cost of beginning approved study (available annually for continuing study if receiving PES). It is available to income support recipients who qualify for PES, and to recipients of Mature Age Allowance, Newstart Allowance, Parenting Payment Partnered, Partner Allowance and Widow Allowance if they have been on income support for at least 12 months. |
$208 | Only one EdEP payment per calendar year is payable. EdEP is a taxable payment. |
| Work for the Dole Supplement is a fortnightly supplement to assist Newstart Allowance and Youth Allowance recipients with the cost of participating in Work for the Dole programs. | $20.80 per fortnight. | |
| Language, Literacy and Numeracy Supplement is a fortnightly supplement to assist people on eligible income support payments with the costs associated with participating in the Language, Literacy and Numeracy program. | $20.80 per fortnight. | |
| Pension Bonus Scheme pays a one-off lump sum to people who defer receipt of Age Pension and continue to work. A number of qualification rules apply. | The maximum rate is $33,409.50 (singles) and $27,910.50 (each member of a couple). The maximum amount is paid if the person has accrued 5 full years of bonus periods and receives maximum rate of Age Pension when they eventually claim. |
Non-taxable. The scheme is funded through the Age Pension appropriation. |
| Pension Bonus Bereavement Payment is a one-off lump sum paid to the surviving partner of a deceased Pension Bonus Scheme member who did not make their claim for a Pension Bonus before their death. | See Pension Bonus Scheme. | Non-taxable. Commenced from 1 January 2008. Funded from the Age Pension appropriation. |
| Crisis Payment is a one-off payment to help people who are in severe financial hardship. It is available to social security income support recipients who are forced to leave their own home due to extreme circumstances, such as natural disaster, or who are victims of domestic violence, newly released prisoners or newly arrived humanitarian entrants. | Equivalent to one week's payment of the person's income support payment without add-ons. | Must claim within 7 days after the event leading to the Crisis Payment claim. |
| Other supplementary payments | ||
| Mobility Allowance is a non–means tested income supplement for people with disability who are aged 16 or over and who are unable to use public transport without substantial assistance. | There are two rates of Mobility Allowance. Basic rate: $75.90 per fortnight Higher rate: $106.20 per fortnight Non-taxable. |
Standard rate — must be engaged in approved activity for at least 32 hours every 4 weeks (combination of employment, voluntary work or vocational training). Higher rate — must be in receipt of DSP, NSA, YA (other) and working at least 15 hours a week or looking for such work. |
| Carer Allowance is for people who provide daily care and attention at home to a person with disability or medical conditions who is: aged 16 or over with substantial functional impairment; or a dependant child under age 16 who needs substantially more care than a child without disability. Child Disability Assistance Payment (CDAP) is available to recipients of CA (child) at 1 July each year. |
$100.60 per fortnight. Child Disability Assistance Payment: $1,000 per annum. Non means-tested. Non taxable. Carer Allowance is indexed annually. CDAP is not indexed. |
The child and the carer must live together in the same private residence, or if the child is hospitalised, there must be an intention for the child to return home to live with the carer. CDAP is intended to help with the purchase of support, aids, intervention, therapies or respite care. |
| Carers Bonus Payments Carer Payment — one-off lump sum paid to recipients of: Carer Payment; DVA Carer Service Pension; or Wife Pension and Carer Allowance; or DVA Partner Service Pension and Carer Allowance. Carer Allowance — one-off lump sum paid to Carer Allowance recipients. |
The Carer Payment Bonus is $1,000. The Carer Payment Bonus is $600. Non-taxable. |
Paid by June 30 after the following Budget speeches: 2004-05 2005-06 2006-07 2007-08 2008-09 |
| Seniors Bonus payments — eligible recipients vary between years. In 2008, eligible recipients include: income support recipients of Age (or Service) Pension age; recipients of Mature Age, Partner and Widow Allowances; and people who qualify for Seniors Concession Allowance. In 2008, the one-off payment was extended to recipients of Wife Pension and Widow B Pension. |
In June 2008, the Seniors Bonus payment was $500. Non-taxable. |
Bonus (or similar bonus) paid by June 30 after the following Budget speeches: 2006-07 2007-08 2008-09 |
Appendix E: Indexation
This appendix provides a brief history of indexation arrangements and discusses the different indexation arrangements that apply to pension and allowance payments.
Brief history of indexation arrangements
Indexation arrangements have varied over the years. In general, until the mid-1970s pension rates were increased on an ad hoc basis, although there were brief periods when pension rates were indexed annually to price movements. Twice yearly indexation in line with CPI increases was in place between 1976 and 1978 and restored in 1979.
In 1972 the incoming government commenced implementing a commitment to increase the pension level until it reached 25 per cent of average weekly male earnings. This benchmark was met for the first time in 1990.
In 1997 legislation was passed to benchmark the maximum single pension rate to at least 25 per cent of the MTAWE. The figure used for this benchmark is the Original, All Males, Total Average Weekly Earnings figure produced by the ABS as part of its AWE series. This figure was chosen because it measures the level of male wages across the workforce, including full-time, part-time, casual and junior employees. This broad spread was seen as reflecting community differences in male wages.
The combination of CPI indexation and linking pensions to growth in wages has delivered real increases to pension rates. Since 1970, the real value of the maximum single rate of pension has increased by 203 per cent, from $7,303 to $14,826 a year. The real rate of pension for a pensioner couple has increased by almost 186 per cent, from $12,902 to $23,950 a year over the same period.
Different indexation arrangements for different payments
Indexation arrangements vary between income support payments, according to the type of payment. The same indexation arrangements apply to all pension-type payments (Age Pension, Disability Support Pension, Carer Payment, Wife Pension, Widow B Pension, Parenting Payment Single, and payments to veterans such as Service Pension, War Widows and Widowers Pension, Income Support Supplement and Disability Pension).
In 1972, legislation was introduced to provide for common rates for all pensions and allowances. The common rate structure took effect in March 1973, and remained in place for pensions and allowance until November 1975 when the single allowance for those under 18 without dependents was 'frozen' (until 1982). The single allowance for people without dependents (single allowance (without child)) was introduced in November 1978 when it was excluded from indexation and was instead to be reviewed each budget. By May 1978 the rate was only 80.2 per cent of the single pension (and single allowance (with child)). Ad hoc increases to the single allowance (without child) rate improved the relativity to 93.4 per cent of the single pension by November 1989. Other allowance recipients continued to receive allowance payments paid at pension rates (couples, singles with children and from June 1990 the singles aged over 60 in continuous receipt of income support for nine months or more).
In 1997 when the MTAWE benchmark was legislated for pensions, it was decided it should not include the single allowance (with child or aged 60 and over long term income support) and the couple allowance, which had been aligned with pension rates since 1973. Just prior to the legislation benchmarking single pension rates to MTAWE the single allowance (without child) was 92.4 per cent of the single pension.
Since September 1997 wages growth has increased the real value of pension rates by around 20 per cent. In contrast, over the same period, allowances have remained unchanged in real terms. At March 2008 to 19 September 2008 the single allowance (with child or aged over 60 and over long term income support) was 86.5 per cent of the single pension and the couple allowance was 86.3 per cent of the couple pension. The single allowance (without child) was 80.0 per cent of the single pension.
Current indexation process
Different components of the income support system have different indexation regimes with the base rate of pension currently having a dual process of indexation by the CPI and benchmarking to 25 per cent of the MTAWE. Other pension add-ons and thresholds for means testing are indexed by the CPI only and some of these at different times and with different frequency. For example, add-on payments indexed to the CPI include the Pension Supplement, Pharmaceutical Allowance, Utilities Allowance and, where applicable, Rent Assistance, Telephone Allowance and Remote Area Allowance.
Base pension rates and the Pension Supplement are indexed twice yearly, on 20 March and 20 September. The mechanism for this is:
(a) the base rate is indexed by the percentage increase in the CPI over the preceding six months (for the March indexation this is the six months from the previous July to the previous December, and for the September indexation this is the six months from the previous January to the previous June);
(b) the new maximum single base rate of pension is then compared with 25 per cent of the MTAWE and increased if necessary to ensure that benchmark is met.
Future increases are built on the previously increased amount.
Increases in the maximum single base rate of pension flow on to the maximum partnered base rate of pension proportionally (that is, the partnered rate is maintained at around 83 per cent of the single rate).
At the same time the Pension Supplement, which was introduced to compensate pensioners for the impact of the GST, is indexed in line with CPI increases. It is paid on top of the rate that meets the MTAWE commitment.
Indexation of family assistance
Formal indexation provisions for family assistance were introduced in 1990. The value of FTB rates and thresholds are maintained by annual indexation to the CPI each 1 July.
The maximum rates of FTB Part A for families with children aged under 13 and aged 13-15, are also linked to wages growth through a link with the combined pension couple (CPC) rate which is in turn benefits from the benchmarking of the single rate of pension to 25 per cent of the MTAWE. The CPI indexed maximum rates of FTB Part A are compared to 16.6 per cent of the CPC rate for the under 13 rate and 21.6 per cent of the CPC rate for the 13 to 15 rate and if they are below these percentages the rates are increased to meet these benchmarks.
Appendix F: Historical trends in transfer payments
Before 1907, social security in Australia consisted of charitable relief provided by benevolent societies, sometimes with financial help from authorities.
In 1907, the Harvester Judgment established the concept of an arbitrated 'living wage'—a non-market wage paid to a 'breadwinner' wage earner for the support of themselves and dependents. This effectively introduced a model where welfare outcomes were pursued by way of wage-related benefits rather than transfer payments in cash and/or kind or tax assistance.
From 1 July 1909, an Australian Government Old-Age Pension replaced similar schemes operating in various states. This was followed by an 'invalid' pension scheme in 1910. These payment programs focussed assistance on those with no income and no capacity to work.
The first form of family assistance, a non-means tested maternity allowance, began in 1912.
The principles of these schemes set the Australian social security scene for 100 years: funded from general government revenue; based on circumstance 'categories', not past earnings; and means tested to direct assistance to those regarded as most in need.
The 1940s—the beginning of the modern social security system
The impact of the Second World War saw the expansion in scope of the social security system at the national level. The Australian Government also progressively took over and expanded state transfer payments. The period included the introduction of:
- Child endowment (1941), a family allowance paid at a fixed rate with no means test.
- Widows' pensions (1942) to provide support to those who could not reasonably be expected to work due to either the care of a child or their age.
- Allowances for the children of pensioners (1943) and allowees (1945).
- Unemployment and Sickness Benefits (1945), which formed part of the Government's commitment to achieving 'full employment'.
- Special Benefit (1945), to provide for people who had no other entitlement and were unable to provide for themselves. It was and is tightly means tested.
These changes formed a basic social security architecture the essential elements of which are discernible in the current income support payment structures.
The 1950s and 1960s—the modern social security architecture was consolidated
The Australian social security system continued to consolidate its position. The major changes included additional assistance for single pensioners paying rent (1958), Supplementary Assistance (1958); a higher rate of pension for singles to reflect the diseconomies of living alone (1963); Guardian Allowance for widow pensioners (1963) and other single pensioners with children (1965); and a major liberalisation of the means test on pensions (1969).
1973–1983—initial responses to an expanding 'safety net'
The slow down in economic growth in the 1970s saw unemployment and underemployment increased substantially, reflected in increased numbers of recipients of unemployment, sickness and other payments and longer with average duration of receipt.
The 1970s also saw the introduction of measures to abolish the means test for Age Pensioners aged over 70 (subsequently reversed); the commitment to increase the single pension to 25 per cent of male average weekly earnings; a common rate structure for pensions and allowances; and automatic indexation of adult income support rates to increases in the CPI. In 1972, the Australian Government provided its first funding for child care services. Child endowment and tax rebates for children were replaced by a 'universal' Family Allowance in 1976.
1983–mid 1990s—towards a more 'active' system of social protection
The Social Security Review was established in 1986, recognising that economic, social and demographic change had created the need for a review of the social security system to establish a long term perspective on the priorities and directions for change. The system's focus was broadened from a predominant focus on poverty alleviation, to a system that also encouraged and rewarded self-provision (through work and saving) that was better integrated with other social services and economic, labour market and tax policies.
The main changes from the Review aimed to improve payments for low income families with children; and encourage and facilitate economic and social participation of payment recipients—particularly people with disability, single parents, widows, partners of incomes support recipients and the long term unemployed through improved labour market assistance. The 'family payment benchmarks' were introduced (1987), met (1989) and later increased (1992 and 1996) as part of the Australian Government's pledge that by 1990 no child need live in poverty. The benchmarks represented the assistance a couple, without private income, required to raise a child and achieve a similar living standard as a couple without children.
The period 1987 to 1995 saw changes recognising the changing role of women in the labour force and the increased availability of part-time work. This included gradually increasing the Age Pension age for women (1995); the beginning of the phasing out of dependency based payments for women (Widow B (1987) and Wife Pensions (1995)); and individual entitlement to income support for partners of income support recipients (1995). The 1995 changes included the introduction of non-activity tested allowances for partnered parents with a child aged under 16 and older widows and partners of income support recipients with a labour market disadvantage. Other claimants were generally required to claim an activity tested allowance payment. Also occurring in 1995 was the liberalisation of the allowance income test. The 100 per cent taper was replaced by a 70 per cent taper to improve the reward for part-time work and allowance couples were subject to an income test designed to improve work incentives for second earners in a couple.
Other changes included: an increase in the coverage and level of Rent Assistance (1988-1993); the progressive introduction of 'deeming' income on financial investments (1988-1991); the introduction of an 'Earnings Credit' for pensioners (1987) and allowees (1994) to improve the rewards for part-time work; the implementation of the Child Support Scheme (1988 and 1989); and the introduction of child care fee relief (1984) and expansion (1990 and 1994).
Mid 1990s to today—increased assistance for pensioners and families and continued activation
From 1997, the benchmarking of the single pension to 25 per cent of male total average earnings was included in legislation. The 'pension supplement' introduced as part of the GST compensation measures in July 2000 increased the rate beyond
25 per cent of the MTAWE.
By the late 1990s, the Australian Government was concerned about the number of working age people receiving income support, particularly the growing number of pensioners not 'activated' into either looking for, taking up, or preparing for work. This led to the establishment of a Reference Group to consider and report on Welfare Reform. The Government's initial response to their report was the 'Australians Working Together' (2001) package that included a 'Working Credit', the closing of Mature Age and Partner Allowances to new entrants, and new or improved supports and services for parents, people with disability, mature aged workers and the long-term unemployed.
In 2005, building on the Australians Working Together changes, the Welfare to Work changes were announced. These saw the 'activation', through the imposition of obligations to work part-time or look for part-time work, of parents with older children and new entrants with disability with a partial capacity for work. New entrants to these groups are now paid Newstart Allowance rather than a pension. Single parents 'saved' on pension were to be activated by part-time activity requirements. 'Saved' people with disability on a pension with the capacity to work 15 to 29 hours a week were not. The allowance income test was also liberalised (70 per cent taper lowered to 60 per cent) to improve part-time work incentives.
In relation to family assistance, FTB (2000) increased the assistance for families with children. An ad hoc increase to FTB Part A maximum rates and a higher base rate provided additional assistance for the direct costs of children. FTB Part B increased assistance for single income families including single parents. The FTB supplements (2003–04 and 2005), more generous means testing (2000–06) and Maternity Payment (2004, renamed Baby Bonus in 2007) led to significant increases in family assistance outlays. After a period of tightening, assistance for child care was improved after 2000. In 2005 the Government accepted the main recommendations of the Ministerial Taskforce on Child Support. The recommendations have been progressively implemented and better align child support with community attitudes. A new child support formula was implemented from July 2008.
Retirement incomes policy has retained a strong focus. 'Extended deeming' of financial investments was introduced (1996) and changes were made to the treatment of retirement income stream products (1998). Other changes in the period included: extended support for carers of people with disability (1996–99); a lower rate of Rent Assistance for single people 'sharing' accommodation (1997); Youth Allowance replaced a range of payments for young people (1998); the use of 'one-off' lump sum bonuses for carers and seniors (2001 onwards); and the introduction of additional payment for utilities costs (2004 and 2005).
Appendix G: Lump sum 'one-off' payments made since 2004–05
| 2008–09 Budget | 2007–08 | 2008–09 | TOTAL | |
|---|---|---|---|---|
| Seniors bonus | FaHCSIA | 1,165.1 | 0.5 | |
| $500 to individuals in receipt of AP, veterans' pensions, Widow B Pension, WP, MAA, WA, PA and SCA. | DEEWR | 40.5 | ||
| DVA | 168.9 | |||
| TOTAL | 1,374.5 | 0.5 | 1,375.0 | |
| 2007–08 Budget | 2006–07 | 2007–08 | TOTAL | |
| Seniors bonus payment | FaCSIA | 11.3 | ||
| $500 to individuals of Age Pension age receiving UA or SCA, MAA, WA and PA recipients. | DEWR | |||
| DVA | ||||
| TOTAL | 1,300.0 | 11.3 | 1,311.3 | |
| 2006–07 Budget | 2005–06 | 2006–07 | TOTAL | |
| Older Australians one-off bonus | FaCSIA | 164.8 | ||
| $102.80 to each household with a person of age or service pension age eligible for Utilities Allowance. $102.80 for each recipient of MAA, PA and WA (groups newly eligible for UA). $102.80 for each recipient of SCA. |
DEWR | 8.0 | ||
| DVA | 27.7 | |||
| TOTAL | 200.5 | 200.5 | ||
| Over three years | 2,886.8 |
| 2008–09 Budget | 2007–08 | 2008–09 | TOTAL | |
|---|---|---|---|---|
| $1,000 to CP recipients. $600 to CA recipients for each eligible person in their care. | FaHCSIA | 426.7 | 1.4 | 428.1 |
| 2007–08 Budget | 2006–07 | 2007–08 | TOTAL | |
| $1,000 to CP recipients. $600 to CA recipients for each eligible person in their care. CA recipients in receipt of WP of DVA partner service pension also receive both payments. |
FaCSIA | 390.3 | 3.9 | 394.2 |
| 2006–07 Budget | 2005–06 | 2006–07 | TOTAL | |
| $1,000 to CP recipients. $600 to CA recipients for each eligible person in their care. CA recipients in receipt of WP of DVA partner service pension also receive both payments. |
FaCSIA | 354.4 | 3.6 | 358.0 |
| 2005–06 Budget | 2004–05 | 2005–06 | TOTAL | |
| $1,000 to CP recipients. $600 to CA recipients for each eligible person in their care. | FaCSIA | 313.7 | 3.2 | 316.9 |
| 2004–05 Budget | 2003–04 | 2004–05 | TOTAL | |
| $1,000 to CP recipients. $600 to CA recipients. | FaCS | 255.0 | - | 255.0 |
| Over five years | 1,752.2 |
Appendix H: Concessions provided by the Australian Government and selected pension concessions, as at 1 July 2008
| Description | Claim required | Income/assets tests | Primary Qualification |
|---|---|---|---|
| Pensioner Concession Card (PCC) provides access to cheaper pharmaceuticals and Medicare services. The Australian Government makes a contribution payment to the States towards the cost of core concessions for part-rate pensioners and certain allowance recipients– that is, for discounts on vehicle registration, rates (water and council), utilities (electricity), public transport and Australia Post services. Some concessions on Great Southern Rail and Australia Post. |
N/A Auto issued on receipt of primary payment. |
N/A Primary payment is means tested. |
Automatic issue to:
Income support recipients aged under Age Pension age in an 'employment nil rate period' or no longer receiving payment due to employment income may be able to retain their PCC for an extended period (up to 12, 26 or 52 weeks). |
| Health Care Card (HCC) auto issue provides access to cheaper pharmaceuticals and Medicare services. | N/A Auto issued on receipt of primary payment. |
N/A Primary payment is means tested. |
Automatic issue to:
Income support recipients in an 'employment income nil rate period' or no longer receiving payment due to employment income may be able to retain a HCC for an extended period (up to 12 or 26 weeks). |
| Foster Child Health Care Card Ex-Carer Allowance Health Care Card Provide access to cheaper pharmaceuticals and Medicare services. |
Yes | No | Foster child meeting the definition of an FTB child. Former holders of a Carer Allowance-HCC aged 16-25 in full-time study who held an HCC the day before their 16th birthday. |
| Low Income Health Care Card (LIC) provides access to cheaper pharmaceuticals and Medicare services | Yes | Yes Income in previous 8 weeks |
Income below certain limits in an 8 week period. |
| Commonwealth Seniors Health Card (CSHC) provides access to cheaper pharmaceuticals and Medicare services. Some concessions on Great Southern Rail services. |
Yes | Yes Adjusted taxable income |
Over Age Pension age, not receiving an income support payment, and income below $50,000 single or $80,000 couple. |
Appendix I: Data sources and notes
This paper draws upon a number of data sources. As a result, not all figures and definitions are consistent across tables and charts, nor is all data for the same time period. The main sources and comments upon these figures, definitions and data sources are identified below.
Administrative data
This background paper draws extensively upon a number of administrative data collections within FaHCSIA, as well as input from the DEEWR and DVA.
These collections include both 'official' statistics, including those published in the department's annual reports and in statistical publications, and internal analytical and research data collections. Results from these sources may differ for a range of reasons, including differences in timing and the extent to which point in time data is revised to take account of retrospective changes (for example late provision of data on income or a reversal of a suspension of a payment). These differences are rarely material but will result in some apparent inconsistencies.
While many tables include data on persons in receipt of the DVA Service Pension many do not. This is a consequence of payments being made through a different system. One result of this is that where one member of a couple is paid through FaHCSIA and another through DVA the records are not integrated.
Administrative data collections only contain data collected for administering payments. This may introduce some limitations, including:
- Information on incomes and assets reflect the specific rules of payments with regard to assessable and non assessable items, and as such do not necessarily reflect the total resources available to individuals. In other cases, such as Parenting Payment Partnered, where people are assessed on the basis of individual income only information on partner earnings is not available.
- Changes in program structures may result in changes in eligible populations.
- Very limited data are available on the characteristics and circumstances of income support recipients other than those needed for payment purposes.
Some data has been derived from the Longitudinal Data Set. This special data set, developed for research and related purposes, enables the experience of income support recipients over time to be analysed. In contrast to normal administrative data that focuses on individuals currently in receipt of assistance and their duration on their current payment, longitudinal data looks across payments.
This enabled duration of income support payment receipt over time to be considered in this analysis. This duration need not be continuous but rather based on the cumulative period a person has been on income support during the time in question. The time periods considered in the analysis are the experience over the past 5 years—which actually varies between 5 years and 5 years and 6 months—and a 10-year period that varies between 10 years and 10 years and 6 months.
As the LDS used in this analysis is only a sample it is subject to sampling variability. Estimates may not match as they would have had all records been counted.
Payment data
Data on payment rates are taken from Centrelink's publication A guide to Australian Government Payments, available at www.centrelink.gov.au/internet/internet.nsf/publications/co029.htm Historical rates data is available from The guide to social security law, available at www.fahcsia.gov.au/guides_acts/ssg/ssg-rn.html
Internal models have also been used to calculate the interaction of the tax transfer system and private income.
Survey data
It is important to note that survey data complements the administrative data—it is usually much broader in content and covers all households. When used for examining income support and income, however, it has some limitations, including:
- reliance on self-reporting. Many recipients do not accurately know the details of the payment they are in receipt of, or will refer to it by a common or former name. This is a particular problem for supplementary payments such as Rent Assistance, or when payment names are similar (such as Carer Payment and Carer Allowance). Others prefer not to tell interviewers they are receiving income support.
- household income is not always reported accurately. This is especially problematic at the top and the bottom of the income distribution. In analysis such as that of 'relative income poverty' this can pose particular problems as other analysis indicates that many apparently low-income households have levels of consumption and other characteristics suggesting they are much better off than their reported income.
The definitions used in surveys also often differ from those used for program purposes.
Most analyses presented in this paper have been derived from "Confidentialised Unit Record Files" which allow access to relatively detailed information at the household level and the extraction of specific tables. However to maintain confidentiality the data items are often amalgamated to ensure no person can be identified. This is especially the case with some smaller income support payments.
The main surveys used in this paper are:
The ABS's Survey of Income and Housing. This survey, currently conducted every two years, collects extensive information on the characteristics and income (and in the latest survey, wealth) of households.
The ABS's Household Expenditure Survey. This survey is similar to the Survey of Income and Housing although it is only conducted every six years. In addition to the items in the income survey it collects data on household expenditure and the ABS makes use of this, along with other survey details and their own internal modelling to obtain estimates of the value of non-cash transfers to households (including health and community services). Details are available in the ABS publication Government Benefits, Taxes and Household Income, Australia, 2003–04, available at http://www.abs.gov.au/AUSSTATS/abs@.nsf/productsbyCatalogue/B9B3916F5652BF79CA256AA80081F81F?OpenDocument
The ABS's Survey of Disability, Ageing and Carers. This survey was conducted in 2003 and provides a detailed data set on the experience of disability and caring. As has been noted in this background paper the definitions of caring and disability used in the survey do not equate to the criteria used for payment eligibility. For this reason—while the survey provides a very useful insight into the comparative caring and disability experience across the community as a whole, and is used here for comparing the experience across payments—it should not be used to draw more specific conclusions about the circumstances of persons on particular payments.
This is more so because there are some discrepancies between reported numbers on payment as reported in the SDAC and the number of people who receive payments. For this reason, a disjuncture between reported receipt of payments and reported caring or disability mean the data need to be interpreted with caution.
The Household, Income and Labour Dynamics in Australia (HILDA) Survey. HILDA is a longitudinal household survey conducted by the Melbourne Institute on behalf of FaHCSIA. Further information is available at https://melbourneinstitute.unimelb.edu.au/hilda
The ABS survey of Employee Earnings and Hours is a survey conducted every two years by the ABS to collect data from employers on the distribution of earnings of their employees. The data used in this paper relates to the earnings of full-time non-managerial workers.
Data terms used
Equivalised income: Equivalisation is a technique used to adjust income to allow more meaningful comparisons of income for different households to take account of differences in size and composition and hence needs. It involves dividing household income by an equivalence scale based on the characteristics of the household. The equivalence scale used is the 'modified OECD' scale. This gives a weight of 1 to the first adult in a households, 0.5 to other adults and 0.3 for children aged under 15 years. For example a couple family with two young children would have an equivalence weight of 2.1. All results are shown in terms of the equivalent value of a single person. To gain the value for a particular household type the values shown should be multiplied by the weighting.
Real income (and expenditure): Real levels of income and expenditure seek to take account of price changes over time. They are derived by taking account of the effect of inflation as measured by the CPI to adjust historical rates and expenditure to the equivalent purchasing power of the dollar.
Median: The median is the middle point of a distribution. For example, median income is the income point at which half the population has a higher income and half has a lower income.
Decile, percentile et cetera: These are calculated in the same way as the median but refer to different points in the distribution. They involve ranking the population on the basis of the variable—that is, income—and then dividing the population into equal sized groups. Deciles, for example, involve creating 10 groups with the lower decile being the lowest ranked 10 percent of the population. Percentiles involve splitting the population into 100 categories.
Notes on tables
Notes on charts
|
Chart title |
Detailed description |
|---|---|
|
Single Allowee no income (c) |
Single adult allowee with no private income |
|
Single 10th pctl FT NMA earnings (b) |
After tax income of a single adult with earnings equal to the 10th percentile of earnings of full-time non-managerial adult employees |
|
Single 25th pctl FT NMA earnings (b) |
After tax income of a single adult with earnings equal to the 25th percentile of earnings of full-time non-managerial adult employees |
|
Single Median FT NMA earnings (b) |
After tax income of a single adult with earnings equal to the 50th percentile (median) of earnings of full-time non-managerial adult employees |
|
Single Av FT NMA earnings (b) |
After tax income of a single adult with earnings equal to the average earnings of full-time non-managerial adult employees |
|
Couple 2 ch 100%/67% AWOTE (c) |
After tax income of a couple with two children aged 4 and 8 years, one member earning 100 per cent of Adult Weekly Ordinary Time Earnings (AWOTE) and the other 67 per cent of AWOTE |
|
Pension Cple 2 Child'n no income (c) |
Pensioner (Disability Support Pension) and allowee (Parenting Payment Partnered) couple with two children aged 4 and 8 years, with no private income |
|
Age Pen Cple + 25% AWOTE (c) |
After tax income of an Age Pensioner couple with one member earning 25 per cent of AWOTE from employment |
|
Age Pension Couple no income(c) |
Age Pensioner couple with no private income |
|
Single Pensioner no income (c) |
Single Age Pensioner with no private income |
|
Couple 2 Child 100% AWOTE (c) |
After tax income of a single breadwinner couple family with two children aged 4 and 8 years, with the employed person earning 100 per cent of AWOTE |
|
Single Parent 2 Chld'n no income (c) |
Lone Parent on PPS with two children aged 4 and 8 years, with no private income |
|
Low Inc H'hold Disp Income (a) |
Equivalised household disposable income for low income households as identified in the ABS Survey of Income and Housing |
|
Age Pen Cple + 50% AWOTE (c) |
After tax income of an Age Pensioner couple with one member earning 50 per cent of AWOTE from employment |
|
Av. Equiv. H'hold Disp Income (a) |
Equivalised average household disposable income from ABS Survey of Income and Housing |
Bibliography
Whiteford, P & Henman, P 1998, 'Assessing budget standards: conceptual issues in the treatment of durables', Social Security Journal, 1998/1, pp. 103-146.
Edwards, B, Higgins, D, Gray, M, Zmijewski, N & Kingston, M 2008, The Nature and Impact of Caring for Family Members with a Disability in Australia, Australian Institute of Family Studies, Canberra, p. 26.
Tibble, M 2005, Review of existing research on the extra costs of disability, Working Paper No. 21, Department for Work and Pensions, Leeds, United Kingdom.
Tables
Table 1. Income support and other payment recipients, June 2007
Table 2. Households unable to raise $2,000 in an emergency, 2003–04
Table 3. Payment recipients without a credit card, 2005–06
Table 4. Home and Community Care program, 2006–07
Table 5. Selection of CSTDA funded services 2006–07
Table 6. Income support recipients by duration on payment, 2007
Table 7. Housing tenure of recipients of transfer payments, September 2007
Table 8. Couple combinations of income support payments, September 2007
Table 9. Income support recipients' partner status, September 2007
Table 10. Living arrangements of single income support recipients, 2005–06
Table 11. Incidence of caring and disability (ABS SDAC definitions), 2003
Table 12. Reliance upon income support by household wealth decile
Charts
Chart 1. Illustration of the operation of the income test
Chart 2. Income support packages for selected single recipients, June 2008
Chart 3. Comparison of real rates of income growth over the past decade
Chart 4. Replacement rates – single allowee
Chart 5. Replacement rates – single pensioner
Chart 6. OECD – social assistance as a proportion of household income
Chart 8. Age Pension as a percentage of budget standards
Chart 9. Relative and real low income measures
Chart 10. Transfer reliant households: incidence of financial stress, 2006
Chart 11. International comparison of single–couple relativities
Chart 12. CPI and Age Pension Analytical Living Cost Index
Chart 13. Highly reliant income support recipients: value of bank accounts, 2005–06
Chart 14. Highly reliant households: components of final income, 2003–04
Chart 15. White Card clients: average expenditure, 2007–08
Chart 16. Proportion of the population aged 15 years and over on income support, 1901–2008
Chart 17. Real rates of selected pensions and allowances, 1970–2008
Chart 18. Australian Government expenditure on transfer payments, 1910–2008
Chart 19. Main income support payments by gender, June 2007
Chart 20. Levels and rates of receipt of income support by age and gender, June 2008
Chart 21. Age specific rates of receipt to age 65, June 1997 and June 2007
Chart 22. Disability Support Pensioners by medical category
Chart 23. Medical condition of carees of Carer Allowance recipients
Chart 24. Employment of income support recipients, 2005–06
Chart 25. Private weekly income by income support payment type, September 2007
Chart 26. Cumulative private income by income support payment, September 2007
Chart 27. Total income of Age Pensioners as a proportion of pension, September 2007
Chart 28. Income support recipients by net household wealth, 2005–06
Chart 29. Transfer reliant households: distribution of net wealth, 2005–06
Chart 30. Transfer reliant households: composition of wealth, 2005–06
Last updated: