Growing Up in Australia: the Longitudinal Study of Australian Children 2008-09 Annual Report
Table of contents
- Foreword from the Minister for FaHCSIA
- Director's report
- Overview
- Wave 3 data collection
- Wave 3 snapshot
- Breastfeeding and infants' time use
- How well are Australian infants and children aged 4 to 5 years doing?
- Stress and psychological distress in mothers of infants
- Key personnel
- Data users and website activities
- Publications and presentations
- Data access
Foreword from the Minister for FaHCSIA
For the Australian Government, the safety and wellbeing of all children is a national priority and a national responsibility. It is the right of every Australian child to have a safe, healthy and happy childhood. To achieve this we need strong, resilient families and supportive, inclusive communities.
We also need the flexibility to identify and adapt to the changing needs of families and children. This requires investing in high quality research to better understand the environment in which Australian children are growing up. We need this solid evidence base to develop and implement polices that are effective and targeted.
Growing Up in Australia: the Longitudinal Study of Australian Children, managed jointly by the Department of Families, Housing, Community Services and Indigenous Affairs, the Australian Institute of Family Studies, and the Australian Bureau of Statistics, is an important part of this evidence base.
The study collects a range of information about children and their families including children's academic ability, their health and emotional wellbeing, parenting, family functioning, early childhood care, and education and schooling. Since the study began in 2004, around 10,000 children and families have taken part in three main waves of interviews and three mail-out surveys.
The third wave of Longitudinal Study of Australian Children data was collected in 2008 and released in 2009. This data shows a very positive picture overall for most children and parents involved in the study. For example, teachers reported that over 80 per cent of children enjoyed school, preschool or child care and were eager to learn new things. Ninety-two per cent of mothers and 80 per cent of fathers often have warm, close times together with their child. And around three-quarters of eight to nine year-old children reported that they had fun with their family lots of times.
Naturally, not all findings from the study are good news. One area of concern is that more than one in five study children are overweight or obese, even though 87 per cent of parents believe that their children are of normal weight. Around a third of 8 to 9 year olds reported that other kids at school had treated them badly or picked on them. Although concerning, these findings will assist us in shaping our policies and programs to help deal with these problems.
Strong partnerships between policy makers and researchers can provide vital evidence to identify new opportunities for prevention and intervention, and to focus on what children need to have healthy, productive lives.
Of course, this research could not be possible without the support and enthusiasm of the parents and children participating in the study. To these parents and children, I would like to say thank you for your commitment and time. The contribution you are making will help achieve our national goal to give all Australian children the best start in life.
Jenny Macklin
Minister for Families, Housing,
Community Services and Indigenous Affairs
Director's report
Interest in human capital and capability formation focuses attention on the relationships between outcomes in adulthood and experiences in infancy, childhood and adolescence. Most countries in the Organisation for Economic Co-operation and Development (OECD) have commissioned large-scale, national longitudinal studies to provide solid evidence on children's progress in order to inform a range of policy priorities. Widening gaps in the development, health and wellbeing of children are of concern and understanding of the reasons for these is still limited. Increasing levels of childhood obesity, depression and anxiety, and learning and behavioural problems, are concerning. Addressing such concerns requires information both about the pathways that lead to adverse outcomes as well as the factors that protect children and promote their development, health and wellbeing.
Longitudinal studies can also cast light on the diversity of ways in which children's relationships and environments affect their prospects and progress. Societies differ in their cultural, environmental, economic, and social contexts and different systems have evolved for care, education, health and family support. Longitudinal studies such as Growing up in Australia: the Longitudinal Study of Australian Children (LSAC) provide valuable information to tailor policy and practice to the particular realities of life in contemporary Australia.
LSAC does this by capturing the rich diversity of the children's lives. As such, it addresses many questions about children's development based on its large, representative sample and the perspective of multiple reporters--mothers and fathers, carers and educators as well as the children themselves. High sample retention, equal if not better to similar studies in other countries, strengthens the validity of the data. Novel and engaging methods are used to collect data from parents and children including using computers (with headphones for children) to answer survey questions in the forthcoming wave. Collection of information on how children use their time is another unique feature of the study.
The team working on LSAC values links with other national longitudinal studies, such as the Millennium Cohort Study in the United Kingdom, the French Longitudinal Study of Children, and the Mother and Baby Study in Norway. The French study is closely linked with that country's census data. Conducted by the Institute of Public Health, the Norwegian study has a major focus on the collection of biomedical data from a sample of over 100,000 infants and their mothers and fathers. These cross-national links offer important collaborative research possibilities, including sharing knowledge of design, instruments and methodologies.
Harmonisation of the data, across national longitudinal studies, is also an increasingly valuable resource for comparative analysis of the similarities and differences in the development of children and how these relate to their family, community and societal contexts. Researchers at the OECD, for example, are increasingly interested in the possibilities for harmonising longitudinal data across national studies as a complement to their comparative work based on administrative data sets.
Conducted in a partnership between the Department of Families, Housing, Community Services and Indigenous Affairs, the Australian Bureau of Statistics and the Australian Institute of Family Studies, LSAC benefits greatly from the advice to the Institute on design and methodology from a consortium of leading scientists, from universities and research centres around Australia. Professor Stephen Zubrick chairs the Consortium Advisory Group, while Professor Ann Sanson is the Chief Scientific Advisor for the study.
LSAC is an excellent example of the value of researchers and policy makers working together to collect information that informs policy, enhances practice and advances scientific understanding. Like the children involved, with each year, LSAC becomes a more mature, richly developed resource. The use of the data increases and its findings are proving an invaluable source of information for child and family policy development.
Professor Alan Hayes
Director
Australian Institute of Family Studies
Overview
In 2004, the parents of over 10,000 children around Australia agreed to take part in Growing Up in Australia: the Longitudinal Study of Australian Children (LSAC). The study is designed to identify policy opportunities for improving support for children and their families and to inform intervention and prevention strategies. This longitudinal study involves two representative cohorts of children--approximately 5,000 infants aged approximately 0 to 1 years (B or infant cohort), and 5,000 children aged 4 to 5 years (K or child cohort), when the families agreed to take part in 2004.
The study addresses a range of key questions about children's development and wellbeing. Information is collected on the children's physical health and social, cognitive and emotional development, as well as their experiences in key environments such as the family, community, child care, preschool and school settings. Information is collected via a number of methods, including:
- face-to-face interviews with parents (and children from age 6 to 7 years)
- direct assessments of the children
- telephone interviews for parents living apart from the study child
- self-complete instruments for mothers and fathers, carers and teachers
- time use diaries completed by parents about their child's activities over two 24 hour periods (during the week and on a weekend).
During 2008-09, a number of important milestones for LSAC were achieved. The third data collection wave was completed and most of the processing undertaken so that the data could be released early in the 2009-10 year. As well, a third between-wave mail survey was undertaken, with surveys sent to families in June 2009. Preparations for the fourth main wave data collection in 2010 neared completion. In 2008-09 a large number of publications and presentations using LSAC data were produced, informing a range of social policy developments. Further highlights include the screening of the Life at 3 documentary and the establishment of a new Memorandum of Understanding (MOU) between the lead agencies managing LSAC over the next four waves.
Memorandum of Understanding
Throughout the first half of 2009, the Department of Families, Housing, Community Services and Indigenous Affairs (FaHCSIA), the Australian Institute of Family Studies (AIFS), and the Australian Bureau of Statistics (ABS) worked on the details of an MOU outlining the roles each organisation will play for the next four waves of LSAC. The MOU builds on the strengths each organisation brings to the development, collection and analysis of LSAC data. The agencies will continue to work together with expert child development researchers and policy makers to ensure that the study delivers high quality data on children and the contexts they are growing up in.
Key responsibilities under the LSAC MOU
FaHCSIA: overall management of LSAC on behalf of the Australian Government .
AIFS: design and content of the study and preparation of research and statistical reports.
ABS: data collection and delivery, instrument development and management of the LSAC sample.
Wave 3 data
The main activity in 2008-09 was completion of Wave 3 data collection, which commenced in late March 2008 and continued until early 2009. Interviewers successfully interviewed 8,718 families: 4,386 from the B cohort (aged 4 to 5 years in Wave 3) and 4,332 from the K cohort (aged 8 to 9 years in Wave 3). This represents a response rate of 89 per cent of available participants--an excellent result when compared to similar international studies.
An important development in Wave 3 was the use of telephone interviews for parents from separated families who were not living with the study child. Further details of the Wave 3 data collection and preliminary findings are covered in pages 9-23.
With the release of Wave 3 data, researchers can for the first time compare B cohort children with K cohort children when they were the same age in Wave 1. These cross-sequential comparisons enable researchers to gain a better understanding of how the context in which children are growing up may be changing over time.
Wave 3.5 data collection
The third between-wave mail-out survey (Wave 3.5) was developed during 2008-09 and sent to parents in June 2009. This short survey focuses on key areas of children's development that change rapidly and covers use of media and technology, health, transition to school for the younger cohort, and parental involvement in learning for the older cohort.
Wave 4 development
Development of the Wave 4 data items and methodology was a major activity for 2008-09. Measures and materials were finalised and pre-testing of new content and methodologies undertaken.
Several significant methodology changes are proposed for Wave 4. While the primary data collection method of a face-to-face interview with the child's main parent will continue, other data collection methodology changes will improve data quality, response rates, and privacy. These changes will ensure time spent with families is used efficiently and effectively. Optimal use of time with families is very important as both cohorts are now at school, many families have two working parents, and children are often involved in a variety of after school activities.
- Methodology changes include:
- collection of some basic household data during an initial phone call
- introduction of a computer-assisted self-interview with the child's main parent to replace a self-complete questionnaire
- introduction of an audio computer-assisted self-interview for the K cohort children.
Research publications and dissemination
Use of LSAC data and research continued to grow during 2008-09. Over 30 conference presentations and publications were produced (see pages 41-44). In addition, website visits to the Growing Up in Australia site have increased and there continues to be strong interest in a range of study products.
Extracts from selected publications are presented on pages 24-37. The first extract summarises research undertaken by Jennifer Baxter from AIFS using Wave 1 data to explore breastfeeding and children's time use. Next, research published in FaHCSIA's Social Policy Research Paper series, and conducted by the LSAC research consortium, explores how child outcomes vary depending on family circumstances and the developmental environment. Finally, an extract from research by Annemarie Nicol from FaHCSIA uses Wave 1 data to explore the relationship between stressful events and mothers' psychological distress.
Life documentary series
The LIFE documentary series follows 11 Australian families and interviews them every two years, as in LSAC. The documentary narrates the stories of these families and presents the latest research using LSAC data. During late September and early October 2008, the second instalment for the series, Life at 3, was screened on ABC TV following a re-screening of Life at 1. Over two episodes, Life at 3 continued the stories of the original families and explored the latest findings on two of the most significant issues in child development today--obesity and bad behaviour. FaHCSIA, AIFS and members of the LSAC Consortium Advisory Group continue to provide advice on the documentary, with a new agreement established for the Life at 5 series which commenced production in mid-2009.
Data Expert Reference Group
In late 2008, the Data Expert Reference Group was established to provide data management advice for LSAC. Professor Stephen Zubrick chairs the group which is made up of representatives from FaHCSIA, AIFS, ABS, external statistical experts and an experienced LSAC data user. The group will review data management processes and provide advice on issues such as data manipulation, variable derivation, weighting and treatment of missing data. The group is scheduled to meet three times per year with the first two meetings held in February and June 2009.
Continuation of LSAC and New Key Research Questions
The continuation of the study is important for understanding the long-term outcomes of childhood experiences in the Australian context. The first eight waves will enable researchers to better understand child development trajectories from infancy to early adulthood.
To ensure the study remains relevant as study children grow older and reflects the latest child development literature and policy changes, the study's Key Research Questions (KRQs) were reviewed and substantially revised. The new questions will help guide the LSAC research agenda as study children enter and move through adolescence. The new KRQs are available on the AIFS website <http://www.aifs.gov.au/growingup/>.
A range of new content areas are being considered for investigation in the teenage years. Topics include problem behaviours, such as antisocial behaviour, substance use, depression, and eating disorders. Also on the agenda are important areas of psychosocial development, such as identity formation, life satisfaction, relationships with parents and peers, civic engagement, and transitions into, through and from secondary school.
Wave 3 data collection
Fieldwork
Wave 3 data collection started in March 2008 and was completed in February 2009. Over this period, interviewers from the ABS interviewed 8,718 families, including 4,386 B cohort families (children aged 4 to 5 years in Wave 3) and 4,332 K cohort families (children aged 8 to 9 years in Wave 3).
Most of the interviews followed the standard procedure of a face-to-face interview in English with the child's primary care giver (usually the mother). The exceptions were:
- Eighty-seven telephone interviews for families living in remote areas. Most of these were in Western Australia and South Australia.
- Ninety-seven interviews conducted in a language other than English. Of these, 58 were interpreted by a family member or friend (of the study family), 31 were interpreted by an ABS interviewer fluent in the relevant language, and eight interviews involved a Translating and Interpreting Service (TIS) interpreter. The most common languages requiring an interpreter were Arabic, Vietnamese and Cantonese.
Children were measured and assessed and their other resident parent and teachers (or carer) completed questionnaires. Children in the K cohort were also interviewed face-to-face. Parents living apart from the child were interviewed by telephone.
The average time spent by interviewers in the home was approximately one and a half hours. This was shorter than the Wave 1 average of two hours but slightly longer than the one and one-quarter hours required for Wave 2. In Wave 3, the average time in the household for the B cohort was 91 minutes, compared with 98 minutes for the K cohort.
Wave 3 response
There were 8,718 interviews with the primary care giver in Wave 3, which represents 86 per cent of the Wave 1 sample and 89 per cent of the available sample in Wave 3 (the available sample excludes families who had permanently withdrawn from the study since Wave 1). Table 1 provides a summary of the sample loss since Wave 1, and shows the number and percentage eligible and who participated at the various main wave data collections.
Two hundred and sixty-eight families who did not participate in Wave 2 took part in the study again in Wave 3. Two-thirds of these families were unable to be contacted in Wave 2 (177 families) and one-quarter refused participation (65 families) in Wave 2. By continuing to take part in the study these families have helped maintain the sample size within LSAC.
| Sample |
B cohort |
K cohort |
Total |
||||||
|---|---|---|---|---|---|---|---|---|---|
| N | Response rate | N | Response rate | N | Response rate | ||||
| % Wave 1 |
% Available sample |
% Wave 1 |
% Available sample |
% Wave 1 |
% Available sample |
||||
| Wave 1 original | 5,107 | 100.0 | 4,983 | 100.0 | 10,090 | 100.0 | |||
| Wave 2 availablea | 5,047 | 98.8 | 4,913 | 98.6 | 9,960 | 98.7 | |||
| Wave 2 respondingb | 4,606 | 90.2 | 91.2 | 4,464 | 89.6 | 90.9 | 9,070 | 89.9 | 91.1 |
| Wave 3 availablea | 4,971 | 97.3 | 4,829 | 96.9 | 9,800 | 97.1 | |||
| Wave 3 respondingb | 4,386 | 85.9 | 88.2 | 4,332 | 86.9 | 89.7 | 8,718 | 86.4 | 89.0 |
Notes:
(a) Available sample excludes those who opted out of the study prior to the start of the wave. Some additional families also opted out permanently during the fieldwork process.
(b) Responding sample is those who participated in the home visit (or telephone interview for those in remote locations).
A total of 427 families refused to participate in Wave 3--including 257 families who refused to participate in this wave only and 170 who chose to permanently opt out of the study. Of those families who chose not to participate in Wave 3 only, the most common reasons given were: too busy (49 per cent); death or illness (10 per cent); and personal or family problems (14 per cent). Of those families who chose to opt out of the study permanently, approximately 30 per cent stated they were too busy and a further 29 per cent stated they were no longer interested.
Characteristics of non-participating families
Table 2 shows selected Wave 1 characteristics of Wave 3 respondents and non-respondents. Families in which the primary care giver's main language at home was not English, the study child was Indigenous, and the parental income was less than $1,000 per week were less likely to participate in the main study interview in Wave 3. Responding primary care givers were also older on average than non-responding primary care givers. These findings are consistent with patterns of non-response observed in Wave 2. To adjust for this, weights are provided with LSAC data for researchers to use when they are making estimates about the Australian population. These weights ensure the sample used for analysis is still representative of these groups.
| Wave 1 characteristics |
B cohort |
K cohort |
||
|---|---|---|---|---|
|
Responding |
Non-responding |
Responding |
Non-responding |
|
| Parent 1 main language spoken at home | ||||
| English | 87.4 | 74.3 | 86.3 | 72.1 |
| Other | 12.6 | 25.7 | 13.7 | 27.9 |
| Study child Indigenous status | ||||
| Indigenous | 3.4 | 11.2 | 2.9a | 9.7 |
| Non-Indigenous | 96.6 | 88.8 | 97.1a | 90.3 |
| Parent 1 | ||||
| Mean age in years (95% CIb) | 31.4 (31.2, 31.5) |
28.9 (28.5, 29.4) |
35.0 (34.8, 35.1) |
33.3 (32.8, 33.8) |
| Parental income | ||||
| <$1,000 | 43.9 | 61.6 | 38.9 | 58.6 |
| >=$1,000 | 56.1 | 38.4 | 61.1 | 41.4 |
| N | 4,386 | 721 | 4,331 | 652 |
Notes:
(a) N is 4,329 because two respondents didn't answer.
(b) 95 per cent CI refers to the 95 per cent confidence intervals around the mean. For example, we can be 95 per cent confident that the mean parental age of B cohort non-respondents lies between 28.5 and 29.4. Parent 1 is the nominated primary care giver who completed the main interview.
Response to other study instruments
The response rate for the other survey instruments (as a percentage of the instruments distributed to families or mailed out) is shown in Table 3.
| Survey instrument | B cohort Wave 3 response rate (%) | K cohort Wave 3 response rate (%) |
|---|---|---|
| Parent 1 | 87 | 88 |
| Parent 2 leave behind form | 71 | 72 |
| Parent living apart from the child | 67 | 67 |
| Time use diary | 68 | 69 |
| Teacher | 83 | 85 |
Notes:
Parent 1 is the nominated primary care giver who completed the main interview.
Parent 2 is a parent other than Parent 1 living with the child.
In Wave 3, a self-complete form was given to the primary care giver. Ideally, this form was completed during the home visit to maximise the response rate; however, some parents were not able to do so and kept it for completion at a later time. This form was completed by 88 per cent of respondents. A form left behind for the child's other resident parent was completed by over 70 per cent of these parents.
In Wave 3 a change in methodology was introduced for parents living apart from but in contact with their child. Where a primary care giver provided contact details, the other parent completed a telephone interview. The response rate from parents living apart from the child was very positive.. Most of the non-response was due to primary care givers not providing contact information or the contact information being inadequate. Of the 856 parents living apart from the child whom interviewers attempted to contact only 53 (6 per cent) refused an interview.
Teacher forms are sent to the school principal to pass to the child's teacher. Over four-fifths of teachers took part in Wave 3.
Final Wave 3 sample characteristics
Table 4 provides a summary of selected characteristics of the LSAC sample compared to Australian population data from the ABS 2006 Census of Population and Housing.
| Characteristics |
B Cohort |
K Cohort |
||||||||||
|---|---|---|---|---|---|---|---|---|---|---|---|---|
| Wave 1 | Wave 2 | Wave 3 | Wave 1 | Wave 2 | Wave 3 | |||||||
| LSAC % | ABS % | LSAC % | ABS % | LSAC % | ABS % | LSAC % | ABS % | LSAC % | ABS % | LSAC % | ABS % | |
| Gender(a) | ||||||||||||
| Male | 51.2 | 51.4 | 51.1 | 51.4 | 51.3 | 51.4 | 50.9 | 51.2 | 51.0 | 51.2 | 51.1 | 51.1 |
| Female | 48.8 | 48.6 | 48.9 | 48.6 | 48.7 | 48.6 | 49.1 | 48.8 | 49.0 | 48.8 | 48.9 | 48.9 |
| Family type | ||||||||||||
| Two resident parents/guardians: | 90.7 | 88.3 | 89.0 | 85.1 | 88.9 | 82.5 | 86.0 | 82.5 | 85.2 | 81.0 | 85.6 | 79.8 |
| - both biological | 90.1 | na | 88.0 | na | 85.9 | na | 82.9 | na | 81.3 | na | 78.8 | na |
| - step or blended family | 0.2 | na | 0.8 | na | 2.9 | na | 2.2 | na | 3.5 | na | 6.4 | na |
| - other | 0.4 | na | 0.2 | na | 0.1 | na | 1.0 | na | 0.4 | na | 0.4 | na |
| One resident parent/guardian: | 9.3 | 11.7 | 11.0 | 14.9 | 11.1 | 17.5 | 14.0 | 17.5 | 14.8 | 19.0 | 14.4 | 20.2 |
| - biological | 9.3 | na | 10.9 | na | 11.0 | na | 13.9 | na | 14.7 | na | 14.2 | na |
| - other | 0.1 | na | 0.1 | na | 0.1 | na | 0.1 | na | 0.1 | na | 0.2 | na |
| Siblings | ||||||||||||
| Only child | 39.5 | 39.4 | 19.3 | 24.4 | 10.4 | 13.4 | 11.5 | 13.4 | 9.1 | 11.0 | 8.2 | 9.8 |
| One sibling | 36.8 | 35.5 | 49.1 | 45.5 | 48.1 | 47.9 | 48.4 | 47.9 | 45.2 | 44.9 | 44.2 | 42.9 |
| Two or more siblings | 23.7 | 25.1 | 31.6 | 30.0 | 41.5 | 38.7 | 40.1 | 38.7 | 45.7 | 44.1 | 47.6 | 47.3 |
| Ethnicity | ||||||||||||
| Aboriginal or Torres Strait Islander | 4.5 | 4.3 | 3.9 | 4.3 | 3.4 | 4.5 | 3.8 | 4.5 | 3.4 | 4.5 | 2.9 | 4.4 |
| Parent 1 speaks a language other than English at home | 14.5 | 18.0 | 13.4 | 18.5 | 12.6 | 18.2 | 15.7 | 18.2 | 14.7 | 18.5 | 13.8 | 18.0 |
| Work status | ||||||||||||
| Both parents or lone parent work | 47.9 | nc | 56.9 | nc | 63.0 | nc | 55.5 | nc | 65.4 | nc | 72.8 | nc |
| One parent works (in couple family) | 40.8 | nc | 33.8 | nc | 29.7 | nc | 32.8 | nc | 26.1 | nc | 20.7 | nc |
| No parent works | 11.3 | nc | 9.3 | nc | 7.4 | nc | 11.6 | nc | 8.6 | nc | 6.5 | nc |
| Educational Status | ||||||||||||
| Mother completed Year 12 | 66.9 | nc | 69.0 | nc | 69.8 | nc | 58.6 | nc | 60.1 | nc | 61.4 | nc |
| Father completed Year 12 | 58.5 | nc | 59.7 | nc | 60.4 | nc | 52.7 | nc | 53.2 | nc | 54.0 | nc |
| State(a) | ||||||||||||
| New South Wales | 31.6 | 33.5 | 31.1 | 33.2 | 31.1 | 33.1 | 31.6 | 33.1 | 31.1 | 33.3 | 30.8 | 33.0 |
| Victoria | 24.5 | 24.5 | 24.3 | 24.7 | 24.6 | 24.3 | 25.0 | 24.3 | 24.3 | 24.2 | 24.4 | 24.2 |
| Queensland | 20.6 | 20.3 | 21.4 | 20.3 | 22.0 | 20.5 | 19.8 | 20.5 | 21.4 | 20.4 | 20.8 | 20.5 |
| South Australia | 6.8 | 6.8 | 6.7 | 7.1 | 7.0 | 7.1 | 6.8 | 7.1 | 6.7 | 7.2 | 6.9 | 7.3 |
| Western Australia | 10.4 | 9.8 | 10.6 | 9.8 | 10.3 | 9.8 | 10.2 | 9.8 | 10.6 | 9.8 | 10.2 | 10.0 |
| Tasmania | 2.2 | 2.3 | 2.3 | 2.3 | 2.4 | 2.4 | 2.7 | 2.4 | 2.3 | 2.4 | 3.0 | 2.4 |
| Northern Territory | 1.7 | 1.1 | 1.4 | 1.2 | 1.2 | 1.2 | 1.7 | 1.2 | 1.4 | 1.2 | 1.4 | 1.2 |
| Australian Capital Territory | 2.1 | 1.7 | 2.2 | 1.6 | 2.4 | 1.5 | 2.3 | 1.5 | 2.2 | 1.6 | 2.5 | 1.6 |
| Region | ||||||||||||
| Capital City Statistical Division | 62.5 | 64.9 | 61.9 | 64.4 | 61.8 | 62.8 | 62.1 | 62.8 | 61.6 | 62.1 | 61.4 | 61.4 |
| Balance of state | 37.5 | 35.0 | 38.1 | 35.6 | 38.2 | 37.2 | 37.9 | 37.2 | 38.4 | 37.9 | 38.6 | 38.5 |
| Number of observations | 5,107 | 4,606 | 4,386 | 4,983 | 4,464 | 4,331 | ||||||
Notes: ABS data for characteristics marked with (a) are based on the Estimated Resident Population for children aged 0 years (2004), 2 years (2006) and 4 years (2008) for comparison with the B cohort, and aged 4 years (2004), 6 years (2006), and 8 years (2008) for comparison with the K cohort. For all other characteristics,
ABS data is based on 2006 census counts for families with children aged 0 years (Wave 1, B cohort), 2 years (Wave 2, B cohort), 4 years (Wave 3, B cohort and Wave 1, K cohort), 6 years (Wave 2, K cohort), and 8 years (Wave 3, K cohort).
na=not available; nc=comparable data not available.
Wave 3 snapshot
The following information is based on Wave 3 unweighted data, where information refers to all children in the study who participated in Wave 3 unless specified otherwise. These percentages may differ slightly from the estimated proportions in the Australian population.
Working lives
As might be expected, more mothers were working as children got older. Three-quarters of K cohort mothers (with children aged 8 to 9 years in Wave 3) were working in paid employment compared with 63 per cent of B cohort mothers (with children aged 4 to 5 years). Working part-time was common among mothers with children from both age groups, with close to half of mothers engaged in part-time work. Approximately 2 per cent of mothers were looking for work.
In families where the study child lived with both parents, most fathers (93 per cent) were engaged in full-time employment and a further 3 per cent were in part-time work. Where parents no longer lived together, around 78 per cent of fathers were working full-time. Of those parents in paid work, 84 per cent of mothers and fathers said they were able to work flexible hours, and 84 per cent of mothers and 78 per cent of fathers agreed or strongly agreed that having both work and family responsibilities gave their life more variety. However, 62 per cent of fathers and 41 per cent of mothers also said that because of work responsibilities they have missed out on home or family activities in which they would have liked to have taken part.
Parenting and support
Many of the parents in the study felt positive about their parenting skills, with 36 percent of mothers and 43 per cent of fathers describing themselves as a better than average parent, and a further 26 per cent of mothers and 25 per cent of fathers describing themselves as a very good parent. In addition, 92 per cent of mothers and 80 per cent of fathers said they often or always had warm, close times together with their child. Parents seemed well supported by their community, with 75 per cent of mothers and 63 per cent of fathers saying they had someone to confide in either most or all of the time, and 77 per cent of mothers and 55 per cent of fathers in the study saying they had contact with their friends weekly or daily.
Grandparents
Grandparents continue to play an important role in the lives of the children in the study. As Figure 1 shows, of children living with both parents, two-thirds (66 per cent) saw their maternal grandparents at least once a month, and 57 per cent saw their paternal grandparents at least once a month. Three-quarters (74 per cent) of mothers say their own parents supported them sometimes or more often in raising their children.
Figure 1: Frequency of grandparent contact
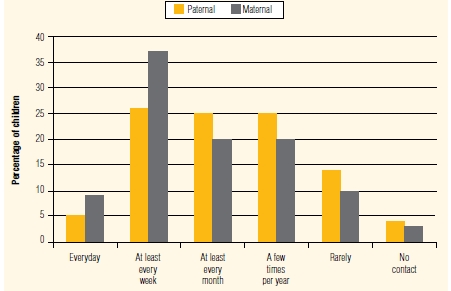
Source: LSAC K and B cohort, Wave 3.
Schooling
Carers or teachers reported that 88 per cent of B cohort children very often or always enjoyed school, preschool or child care. K cohort children also enjoyed school, with 84 per cent of their teachers saying that the children were often or very often eager to learn new things. Three-quarters (74 per cent) of these teachers reported that the children often or very often paid good attention in class.
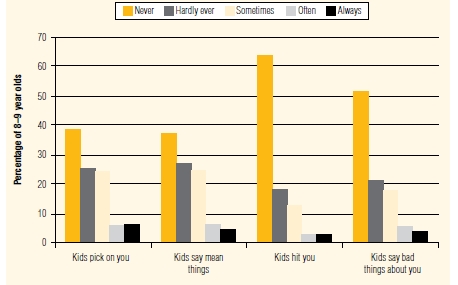
A substantial minority of K cohort children reported that other kids at school treated them badly. Figure 2 shows that approximately 36 per cent of K cohort children said that other kids sometimes, often, or always picked on them. A similar proportion said that other kids said mean things to them. Over 50 per cent of children stated that kids never said bad things about them. Approximately 18 per cent of K cohort children stated that other kids sometimes, often, or always hit them.
Figure 2: Eight to nine year-old ratings of frequency of poor treatment by other kids at school
Source: LSAC K cohort, Wave 3.
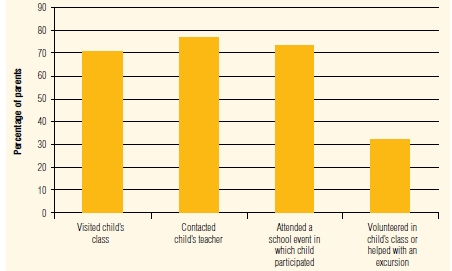
Many parents have contact with their child's school (see Figure 3), with around three-quarters having attended a school event, contacted their child's teacher or visited their child's classroom in the past year. Approximately one-third of parents had volunteered in their child's class or helped with an excursion in the past year.
Figure 3: Parent contact with child's school
Source: LSAC K and B cohorts, Wave 3.
Reading to children
Reading to children was a common activity among parents of 4 to 5 year olds. Over half (54 per cent) of children were read to by their parents almost every day and another quarter (26 per cent) were read to 3 to 5 days a week. Fewer parents read to their 8 to 9 year old children, with 12 per cent of children being read to nearly every day and 18 00000000per cent read to 3 to 5 days a week.
Family activities
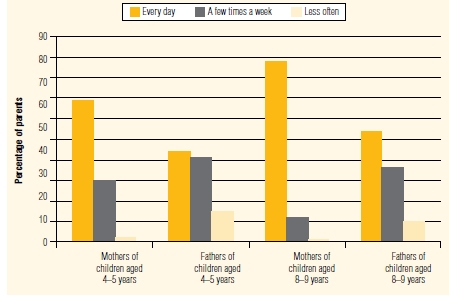
Children are often involved in everyday activities, such as cooking and caring for pets. Around 40 per cent of parents reported that their children helped with these activities nearly every day and 30 per cent had children who helped on 3 to 5 days per week. About four-fifths of mothers had their evening meal with their 4 to 5 and 8 to 9 year-old children every day (see Figure 4). This was less common among fathers (58 per cent of fathers of 4 to 5 year olds and 65 per cent of fathers of 8 to 9 year olds had their evening meal with their children).
Figure 4: How often parents have an evening meal with child
Source: LSAC K and B cohort, Wave 3.
Eight to nine year olds overwhelmingly reported enjoying family time: about three-quarters (76 per cent) of 8 to 9 year olds reported that they had fun with their family lots of times and a further one-fifth (21 per cent) reported having fun with their family sometimes.
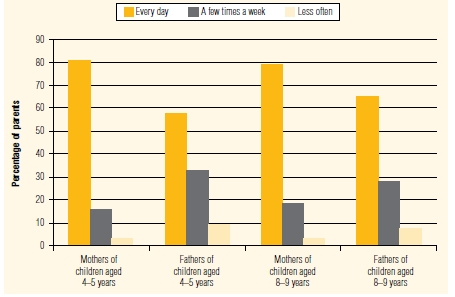
For children aged 8 to 9 years, 28 per cent of mothers and 7 per cent of fathers helped their child with homework every day, and a further 37 per cent of mothers and 40 per cent of fathers helped with homework a few times a week. Many mothers talked with their children about how school was going: 69 per cent of mothers with 4 to 5 year olds and 88 per cent of mothers with 8 to 9 year olds talked about this with their child every day (see Figure 5). While fewer fathers did this every day (58 per cent of fathers of 4 to 5 year olds and 65 per cent of fathers of 8 to 9 year olds), the great majority talked about school with their children at least a few times a week.
Figure 5: How often parents talk to children about school, pre-school or child care
Source: LSAC B and K cohort, Wave 3 data.
Nearly three-quarters (74 per cent) of K cohort children, aged 8 to 9 years, reported that they never or rarely spend time at home by themselves. However, 20 per cent and 6 per cent of 8 to 9 year olds respectively reported that they spent time at home by themselves sometimes each week and almost every day.
Approximately 17 per cent of K cohort children reported that their family yelled at each other often (13 per cent) or always (4 per cent). The remaining 83 per cent of K cohort children reported that their family yelled at each other only sometimes (40 per cent), hardly ever (34 per cent) or never (9 per cent).
Sleeping
Most B cohort parents reported that their child's sleeping habits/patterns were not a problem (70 per cent), as did 80 per cent of K cohort parents. Children's bedtimes became slightly less regular as they got older. Half (49 per cent) of the B cohort parents said that their children always went to bed at a regular time compared to 45 per cent of K cohort parents.
Child wellbeing self report
The overwhelming majority of K cohort children reported they were happy at least some of the time. Sixty-six per cent of 8 to 9 year olds said that they felt happy lots of the time and a further 32 per cent said they felt happy sometimes. Ninety five per cent of children reported that they hardly ever (46 per cent) or sometimes (49 per cent) felt scared or worried. A further 5 per cent reported feeling scared or worried lots of times. Similar proportions of 8 to 9 year olds reported feeling sad: hardly ever (43 per cent); sometimes (52 per cent); and lots of times (5 per cent).
Children's health
Nine in 10 parents (89 per cent) reported that their child was in excellent or very good health.
By the time children were aged 8 to 9 years 30 per cent had at some time been diagnosed with asthma by a doctor, compared with 20 per cent of 4 to 5 year olds. However, only half (52 per cent) of diagnosed 8 to 9 year olds had taken medication for asthma in the previous 12 months, compared with two-thirds (67 per cent) of diagnosed 4 to 5 year olds.
Skin and food allergies are two of the most common ongoing conditions experienced by the study children. Eczema affected 14 per cent of children aged 4 to 5 years and 11 per cent of children aged 8 to 9 years. Seven per cent of 4 to 5 year olds and 6 per cent of 8 to 9 year olds were allergic to certain foods.
Body Mass Index and body image
Study children have their height and weight measured during the main wave interview and from these measurements the Body Mass Index (BMI) can be calculated by dividing a child's weight in kilograms by their height in meters squared. After adjusting for their age, this index score can be used to classify children as underweight, normal weight, overweight or obese. The proportions of children within each weight status category from the infant and child cohorts is shown in Table 5. The majority of parents (87 per cent) believed that their children were of normal weight.
| Weight status, based on BMI | 4 to 5 year olds (%) | 8 to 9 year olds (%) |
|---|---|---|
| Underweight | 6.2 | 5.4 |
| Normal weight | 71.0 | 71.0 |
| Overweight | 17.3 | 17.4 |
| Obese | 5.5 | 6.2 |
Note: The calculation of weight status is based on BMI cut-offs from Cole et al. (2000, 2007).
Source: LSAC K cohort and B cohort, Wave 3.
K cohort children rated their perceived body image and desired body image on the scale shown in Figure 6 (for boys) and Figure 7 (for girls). The distribution of perceived and desired body image scores for children by weight status (based on their BMI) is shown in Figure 8. These findings show that overweight and obese children correctly typically perceive themselves to be heavier than children of normal weight and also desired to lose weight. Conversely, underweight children perceived themselves to be lighter than normal weight children and desired to gain weight. Interestingly, children of normal weight desired to be lighter than they perceived themselves to be. The pattern of results for boys and girls was very similar and therefore is not shown separately.
Figure 6 Body image scale, boys
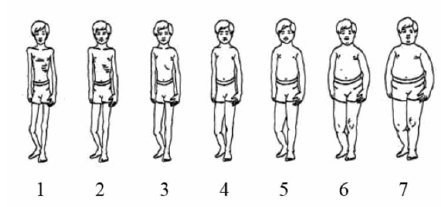
Figure 7 Body image scale, boys
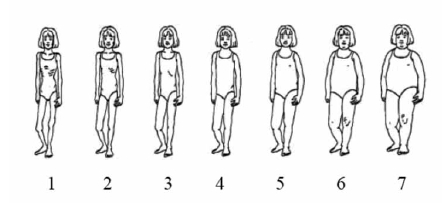
Figure 8: Distribution of perceived and desired body image ratings by weight status category (based on BMI), 8 to 9 year olds
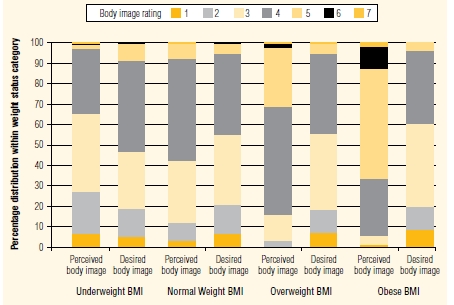
Source: LSAC K cohort, Wave 3.
Breastfeeding and infants' time use
This section is an edited extract from Baxter, J & Smith, J 2009 Breastfeeding and infants' time use, Australian Institute of Family Studies Research Paper no. 43, June 2009.
Being breastfed during infancy contributes to a child's nutrition, health and development. Expert guidelines for optimal infant feeding recommend that infants be exclusively breastfed for the first six months of life and, along with appropriate complementary foods, continue to be breastfed for up to two years and beyond. However, the reasons why breastfeeding is associated with improved developmental outcomes remain poorly understood. Breast milk is known to be important for brain development. In addition, breastfeeding may also co-occur with other early life experiences that are related to improved child wellbeing, for example, higher levels of maternal education. One possible, yet previously unexplored, explanation is that the days of breastfed infants are different to those not breastfed, such that breastfed infants are exposed to activities or contexts that may enhance their outcomes. Time use research provides a potentially useful tool for investigation of this issue.
This analysis uses data from Growing up in Australia: the Longitudinal Study of Australian Children, Wave 1 (2004) B cohort. The total infant cohort available for analysis comprised 5,045 infants aged 3 to 14 months (a small number aged over 14 months were excluded). Breastfeeding status was derived from mothers' reports, with 43 per cent of infants reported to be breastfeeding at the time that children's activities were recorded in time use diaries.
Parents were asked to report on their infant's time use by completing a diary for one weekday and one weekend day, on pre-specified dates. In the diary, each day is divided into 15 minute intervals, and parents mark infants' activities and the contexts in which the activities took place against the lists provided. Table 6 and Table 7 illustrate how these activities and contexts are used in this paper. Diaries were excluded if they had too much missing data, and only those children with two valid diaries were included, so that the weekday and weekend data could be combined to derive a weekly estimate of time spent in each activity. The number of children who met these criteria was 2,878. From the derived weekly data for these children, an average daily estimate of time in each activity was calculated, and these data form the basis of the findings reported.
Table 6 shows the percentage of infants who had engaged in the activity (on left), and the average amount of time spent on the activity by children who had engaged in it (on right). Not surprisingly, all or almost all infants were reported to spend time sleeping/napping, being bathed, having their nappy changed or other personal care. Activities that were less common were:
- organised activities, playgroup (19 per cent),
- colour/draw, look at a book, puzzles (26 per cent)
- breastfeeding (41 per cent).
The activities on which most time was spent were:
- sleeping, napping (on average 821 minutes per day)
- held, cuddled, comforted, soothed (on average 144 minutes per day)
- crawl, climb, swing arms/legs (160 minutes)
- other play, other activities (163 minutes)
- other eating, drinking or feeding (137 minutes)
- breastfeeding infants, breastfeeding (128 minutes).
| Percentage of infants who did the activity % |
Average daily duration on activity (SD) |
|
|---|---|---|
| Sleeping, napping | 100 | 821 (107) |
| Awake in bed/cot | 87 | 55 (54) |
| Bathe/nappy change, dress, hair care | 99 | 94 (44) |
| Breastfeeding | 41 | 128 (72) |
| Other eating, drinking or feeding | 98 | 137 (60) |
| Held, cuddled, comforted, soothed | 96 | 144 (119) |
| Crying/upset | 82 | 54 (52) |
| Destroy things, create mess | 40 | 52 (69) |
| Crawl, climb, swing arms/legs | 80 | 160 (124) |
| Read a story, talked/sung to | 73 | 121 (135) |
| Colour/draw, look at book, puzzles | 26 | 31 (37) |
| Watch TV, video or DVD | 59 | 61 (61) |
| Organised activities, playgroup | 19 | 54 (73) |
| Other play, other activities | 91 | 163 (109) |
Note: Activity duration is reported only for those who spent some time in this activity.
SD=Standard deviation.
Looking next at the contexts in which infants' activities took place (see Table 7), the people that infants were with during these activities is examined. For these analyses, the daily estimates are limited to times that infants were awake. Almost all infants (96 per cent) spent some time with their mother, and 93 per cent spent time with mothers when fathers were not present. A great majority of infants spent time with their father (89 per cent), but only 56 per cent spent time with their fathers only, when mothers were not there. Over half the infants spent some time with a grandparent or other adult relative, while only 13 per cent spent some time in child care.
| Awake and with ... | Percentage of infants % |
Average duration (SD) |
|---|---|---|
| Mother (others may have been present) | 96 | 510 (146) |
| Mother when father was not present | 93 | 314 (150) |
| Father (others may have been present) | 89 | 255 (140) |
| Father when mother was not present | 56 | 59 (68) |
| Grandparents or other adult relatives | 55 | 133 (130) |
| In child care | 13 | 88 (119) |
Note: Duration is reported only for those who spent some time in this context.
SD=Standard deviation.
Further analyses examined the factors related to differences in the amounts of time infants spent on particular activities or in different contexts. The analyses presented here focused on whether differences between breastfed and non-breastfed infants were evident when other characteristics were included. Characteristics taken into account were child age, birth order and sex, maternal age, education, hours worked, Indigenous status, country of birth, whether mothers smoked, fathers' employment status, parental income and whether a grandparent lived in the home.
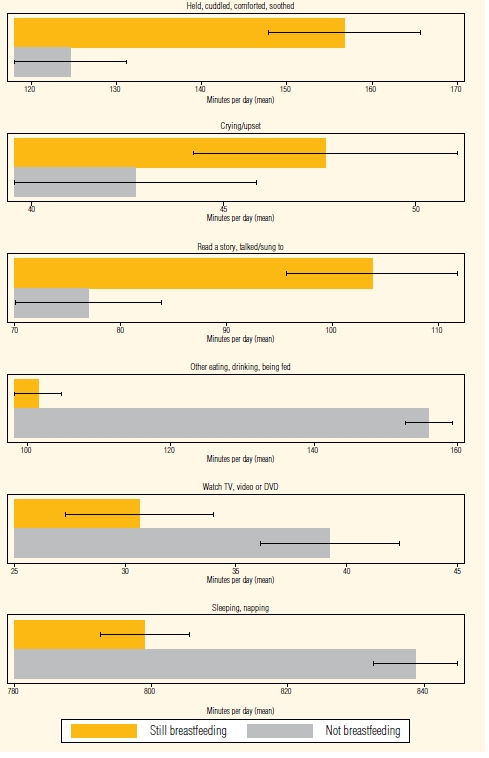
These analyses enabled estimates to be calculated of the predicted amount of time spent on activities by infants who were, or were not, breastfed.1 The predicted amount of time infants spent on selected activities is shown in Figure 9 and in selected contexts in Figure 10.
The results show that breastfed infants spent on average 32 minutes more per day being held, cuddled or soothed (157 minutes for breastfed compared with 125 minutes for non-breastfed infants), 5 minutes more crying or upset; and 27 minutes more being read, talked or sung to (Figure 9).
Figure 9: Infants' activities: predicted minutes per day on selected activities by breastfeeding status
Note: I--I indicate 95 per cent confidence intervals.
Breastfed infants spent on average 54 minutes less per day on other eating, drinking or being fed activities (101 minutes for breastfed infants and 156 minutes for non-breastfed infants); 9 minutes less per day watching television; and 40 minutes less per day sleeping or napping (Figure 9).
Being breastfed was not related to the amount of time spent on the following other activities: destroy things, create mess, crawl, climb, swing arms/legs, colour, draw, looks at book, puzzles, organised activities/playgroup or other play.
Summing up, on the positive side, breastfeeding was associated with more time being cuddled/comforted/soothed; read/talked/sung to; and less television watching, but also on the less positive side, less time sleeping/napping and more time crying or upset.
There were also significant differences by age of the child (for example, older infants spent less time sleeping and being cuddled/comforted/soothed and more time doing other play) but there were almost no differences by sex. Firstborn children were read, talked or sung to more, and spent more time doing various play-type activities. Children of older mothers and more highly educated mothers were read, talked or sung to more. Children of more highly educated mothers also watched less television.
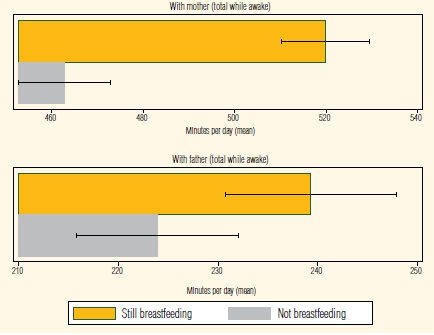
Looking at how infants' contexts varied according to whether or not they were breastfed, those still breastfeeding spent more time, on average with their mother (57 minutes more per day, Figure 10), and fathers (15 minutes more per day, Figure 10). Time with mother was largely time alone with mother (45 out of the 57 minutes extra for breastfed children), while the difference in time with father corresponded more to time that mothers and fathers were together (for 12 of the 15 minutes of extra father-time for breastfed children, the mother was also present).
The amount of time spent in child care or with grandparents or other adult relatives was not significantly related to whether an infant was still breastfed.
Other characteristics associated with differences in time infants spent in different contexts centred on parents' work commitments (work hours for mothers and employment status for fathers).
Figure 10: Infants' time with mother and with father: predicted minutes per day by breastfeeding status
Note: I--I indicate 95 per cent confidence intervals.
Conclusion
The findings reveal differences in the time spent by breastfeeding infants on various activities compared with non-breastfed infants of comparable age and other relevant characteristics. These findings show that time use data can provide valuable information on possible pathways to development for infants and young children.
How well are Australian infants and children aged 4 to 5 years doing?
This section is an edited extract from the Social Policy Research Paper no. 36, How well are Australian infants and children aged 4 to 5 years doing?, by Melissa Wake, Ann Sanson, Donna Berthelsen, Pollyanna Hardy, Sebastian Misson, Katherine Smith, Judy Ungerer, and the LSAC Research Consortium. The research uses data drawn from the B and K cohorts of the first wave of Growing Up in Australia.
This section reports on outcomes for infants and children from Wave 1 using an Outcome Index. This index provides an overall measure of how well Australian children and infants are functioning and is a composite of three domains of child functioning: health and physical development; social and emotional functioning; and learning and academic competency. Summary scores for each of these domains are calculated by combining a range of standardised measures. The domain scores are then combined into an overall Outcome Index.
The Outcome Index is a useful overall indicator of child outcomes, but has a range of limitations that need to be noted when interpreting results. First, the index can more sensitively measure outcomes at the 'problem' end of the scale compared to the positive end of the scale. This is less of a concern here as this section focuses on problem outcomes. Second, the index is a relative measure, where high and low levels refer to children's scores when compared to other children in the LSAC sample. The cut off points for determining high or low outcome scores are therefore arbitrary. Finally, there are fewer areas where it is possible or meaningful to collect outcome information on the infant cohort compared to the child cohort.
The findings also do not take into account the interrelationships among background characteristics that may contribute to or explain apparent associations. For example, although a higher proportion of children from families without a computer have low outcome scores, this result may be because families who do not own a computer are more likely to experience a range of disadvantages associated with a low socio-economic background. More generally, due to the cross-sectional nature of LSAC Wave 1 data, it is not possible to make causal links between Outcome Index scores and other variables.
Family characteristics
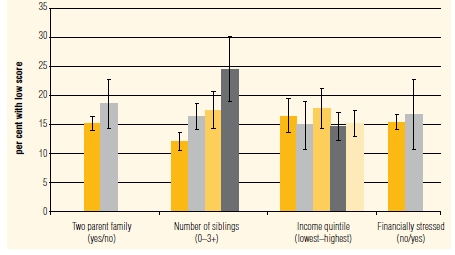
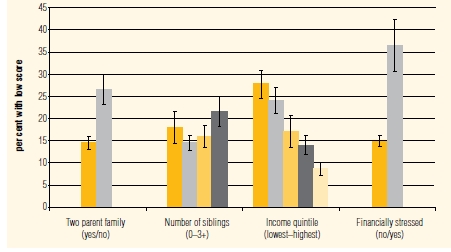
Figure 11 and Figure 12 show the respective proportions within the B and K cohort falling into the bottom 15 per cent of the overall Outcome Index distribution according to child and family characteristics.
Figure 11: Proportion of children (B cohort) with low outcome scores by family characteristics
Note: I--I indicate 95 per cent confidence intervals.
Source: LSAC B cohort Wave 1.
Figure 12: Proportion of children (K cohort) with low outcome scores by family characteristics
Note: I--I indicate 95 per cent confidence intervals.
Source: LSAC K cohort, Wave 1.
Research has consistently pointed to differences in outcomes across family types, although the causal relationships between them are unlikely to be direct. For young children, a salient distinction is whether there are one or two parents available in the home. For the purpose of LSAC, the primary parent was defined as the person who knows most about the child, and the secondary parent as anyone else with a parental relationship to the study child or a partner of the primary parent. By this definition, 11 per cent of infants from the B cohort and 15 per cent of K cohort children were in single-parent families. Figure 12 shows that in the K cohort 27 per cent of children from one parent households scored below the negative cut-off, compared to less than 15 per cent of K cohort children from two-parent families. In contrast, living in a family with one or two parents was not related to low Outcome Index scores for infants in the B cohort.
Siblings
While siblings can provide emotional support and socialisation for children, they can also lead to rivalry and make competing claims on parents' resources. The number of siblings was calculated by counting the number of people living with the study child who had a sibling relationship (including full, step, half, foster and adopted siblings) with the child. Nearly 40 per cent of the B cohort infants were an only child, compared to just 12 per cent of K cohort children. Two-fifths of both cohorts (41 per cent) were the oldest or an only child. As shown in Figures 11 and 12, a greater percentage of those with three or more siblings fell below the negative cut off than those with no or one sibling. Similarly, fewer infants who were the oldest child in the family (which in most cases indicates they were an only child) were below the negative cut-off (12 per cent) than those with older siblings. Being the oldest child was not related to negative outcomes in the K cohort.
Combined parental income and financial stress
Both low income and financial stress have negative and accumulating effects on children's development. Parents were asked what their combined present yearly income was, choosing among 16 categories which were subsequently aggregated for this report into approximate quintiles. In the B cohort, there was no relationship between household income and low outcome scores. However, for the K cohort, a higher proportion of children with low outcome scores came from families in the lowest income quintile (28 per cent) than from families in the highest income quintile (9 per cent).
Families were defined as being financially stressed if they reported experiencing four or more of seven different adverse financial situations in the last 12 months (for example, not being able to pay bills, skipping meals to save money), with 6 per cent of both the B and K cohort families being in this situation. Although financial hardship data paralleled the data on income quite closely, the disparities in K cohort outcomes were even more marked for financial stress--over one-third (36 per cent) of K cohort children from financially stressed households were below the negative cut off. Differences were not evident for the B cohort.
Differences between child and infant cohorts
Overall, in the B cohort, family characteristics had few associations with infant outcomes, whereas the associations were more pronounced in the K cohort. This may in part reflect how contextual factors impact on children's development in a cumulative process over time. This is also likely due to the fact that outcomes are more difficult to reliably measure in younger children and thus the comprehensiveness and robustness of the Outcome Index differs to some extent across the two cohorts in Wave 1. This needs to be taken into consideration when interpreting the B cohort data, including making comparisons with the K cohort.
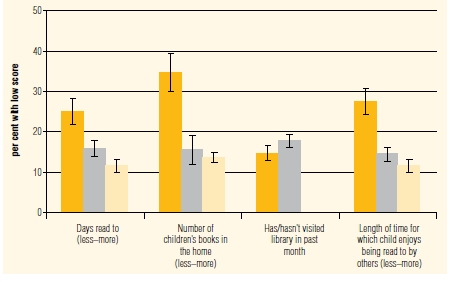
Early literacy and family learning environments in child cohort
Figure 13: Proportion of the K cohort with low outcome scores by early literacy experiences
Note: I--I indicate 95 per cent confidence intervals.
Source: LSAC K cohort, Wave 1.
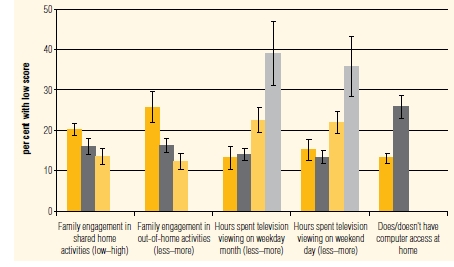
Figure 14: Proportion of the K cohort with low outcome scores by family learning characteristics
Note: I--I indicate 95 per cent confidence intervals.
Source: LSAC K cohort, Wave 1.
Figure 13 displays Outcome Index scores in relation to activities that promote early literacy. Children with less supportive early literacy environments were more likely to have low Outcome Index scores. These findings could have implications for promoting children's emergent literacy at home through drawing attention, in particular, to reading to children regularly and providing reading resources for children to access--although this would need further investigation after controlling for socioeconomic status.
Children were engaged with family members in a range of shared home activities. Figure 14 suggests that children with low engagement in shared home activities more often had lower Outcome Index scores than children with medium and high engagement. Similarly, children with lower engagement in out-of-home activities were more likely to have scores below the low Outcome Index cut-off point, suggesting that child outcomes are enhanced by shared participation of children with family members in a range of activities outside the home.
In line with previous research, the data from these analyses also suggests strong associations between high levels of television viewing and a negative Outcome Index score. A relationship between low child Outcome Index scores and access to a computer may relate to family resources.
Stress and psychological distress in mothers of infants
This section presents research by Annemarie Nicol using data from the B cohort of the first wave of Growing Up in Australia. A total of 4,240 mothers of infants were included in the analyses.
The capacity of individuals to deal with personal crises and setbacks is an important factor in their wellbeing and ability to participate fully in society. While the birth of a child is traditionally seen as a joyful event, some of the accompanying life changes may be negative, such as greater financial stress and possible income loss. In addition, a new mother also often experiences anxiety about her abilities and lowered self-confidence. The risk of psychological symptoms of distress during this time is particularly high.
Given that psychological distress of mothers has been repeatedly linked with poorer outcomes, both for the mother and her child, it is important to understand the contributors to high distress during early motherhood. This report analyses the relationship between stressful life events and high psychological distress among mothers of infants.
Psychological distress and the number of stressful life events
This analysis uses a self-report measure of behavioural, emotional and cognitive indicators of non-specific psychological distress known as the K6. The K6 was developed to identify persons with high distress--symptoms severe enough to cause moderate to serious impairment in functioning (those with a score of 10 or above, on a scale of 0 to 24). Respondents are asked the frequency of experiencing symptoms of psychological distress such as feeling: nervous; without hope; restless; everything is an effort; so sad that nothing could cheer you up; and worthless, over the past four weeks. A high distress score on the K6 is not equivalent to a diagnosis of clinical depression. In this report, mothers with a score below 10 were classified as experiencing low psychological distress.
On average, mothers who reported high psychological distress reported experiencing significantly more stressful events in the previous 12 months than mothers who reported low psychological distress.
After controlling for background factors (maternal characteristics, socioeconomic factors and social support), the number of stressful events a mother experienced significantly increased the likelihood of her also reporting high psychological distress. For each additional stressful event in a mother's life in the previous 12 months, she was approximately 1.3 times more likely to report high psychological distress.
Although the number of stressful events was a significant predictor of high psychological distress, many mothers who experienced only one or two stressful events in the previous year also reported high psychological distress (see Figure 15). This suggests that the number of events may not be the only contributor to high psychological distress, and that the nature of the stressful event may also relate to the likelihood of high distress.
Figure 15: Proportion of mothers who experience high and low psychological distress by number of stressful events in the last 12 months
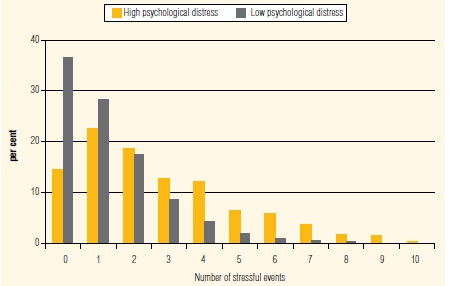
Source: LSAC, Wave 1 2004.
Figure 15 shows how the percentage of mothers experiencing high and low psychological distress varies depending on the type of the stressful event experienced. Compared to low distress mothers, a higher proportion of high distress mothers reported experiencing each particular stressful event. Most notably, experiencing a major financial crisis and having a serious problem with a friend, neighbour or relative were the two events most commonly experienced by mothers with high psychological distress.
These two events also had the largest difference between the percentage of low and high distress mothers who experienced them. Thirty-eight per cent of high distress mothers reported a financial crisis compared to 13 per cent of low distress mothers and 30 per cent of high distress mothers reported a problem with a friend or relative compared to 14 per cent of low distress mothers. While having a close family friend or relative die was experienced by the largest number of mothers overall, there was only a small difference between the percentage of high (27 per cent) and low (25 per cent) distress mothers who experienced this event.
Figure 16: Percentage of mothers experiencing high psychological distress and low psychological distress by type of stress
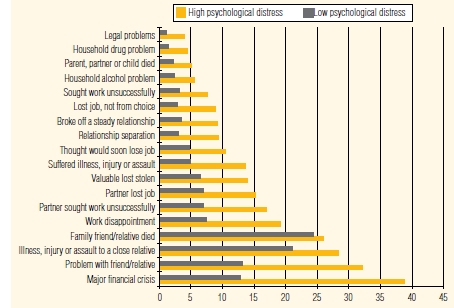
Source: LSAC, Wave 1 2004.
After controlling for interrelationships between stressful events, eight events remained significantly associated with an increased likelihood of a mother experiencing high distress. These were: experiencing a major financial crisis; having a parent, partner or child die; experiencing an illness, injury or assault; having a problem with a friend or relative; losing a job; experiencing a relationship separation; experiencing a work disappointment; and having something of value lost or stolen.
Further statistical analysis, whereby maternal characteristics, socioeconomic factors and social support characteristics were entered in steps, suggested that social support reduced the impact of three events on distress: the death of a parent, partner or child; having a problem with a friend; and losing one's job. Three events continued to be significantly associated with the likelihood of high psychological distress in mothers. These were: a relationship separation; a work disappointment; and a major financial crisis. However, the association between high psychological distress and a major financial crisis was reduced by controlling for socioeconomic factors and social support characteristics.
Key personnel
AIFS Management Team
Executive Project Director
- Dr Matthew Gray
General Manager
- Diana Smart
Project Manager
- Carol Soloff
Design Manager
- Linda Bencic (2008)
- Jacqueline Harvey (2009)
Data Manager
- Sebastian Misson
Data Administrator
- Mark Sipthorp
Research Officer
- Brigit Maguire (2009)
- Siobhan O'Halloran (2008)
Survey Officer
- Elaine Kong
- Suzanne MacLaren
FaHCSIA Management Team
Branch Manager
- Carol Ey
Section Manager
- Dr Helen Rogers
Research Officers
- Helene Shin
- Vicki Hagen
- Sam Hutchinson
- Megan Shipley
ABS Management Team
Director
- Celia Moss
Research Officers
- Kathryn McGrouther
- Joanne Corey
- Rebecca Cachia
- Nicola McGovern
- Jennifer Gallagher
- Karen Mornement
- Suzanne Spence
- Kym Byars
- Annabel Paralo
- Leesa McNaughton
- Byron Kemp
- Rob Swinton
- David Pryce
Consortium Advisory Group
- Professor Stephen Zubrick (Chair)
Telethon Institute for Child Health Research
- Professor Ann Sanson (Principal Scientific Advisor)
University of Melbourne
- Dr John Ainley
Australian Council for Educational Research
- Professor Donna Berthelsen
Queensland University of Technology
- Professor Michael Bittman
University of New England
- Dr Bruce Bradbury
University of New South Wales
- Associate Professor Linda Harrison
Charles Sturt University
- Associate Professor Jan Nicholson
Murdoch Childrens Research Institute
- Professor Bryan Rodgers
Australian National University
- Professor Michael Sawyer
University of Adelaide
- Professor Sven Silburn
Telethon Institute for Child Health Research
- Dr Lyndall Strazdins
Australian National University
- Professor Graham Vimpani
University of Newcastle
- Professor Melissa Wake
Murdoch Childrens Research Institute
Consultants
- Dr David Lawrence
Curtin University of Technology
- Professor John Carlin
University of Melbourne
- Dr Sheldon Rothman
Australian Council for Educational Research
Data Expert Reference Group
- Professor Stephen Zubrick (Chair)
Telethon Institute for Child Health Research
- Dr Ben Edwards
Australian Institute of Family Studies
- Stephen Horn
Department of Families, Housing, Community Services and Indigenous Affairs
- Sebastian Misson
Australian Institute of Family Studies
- Gerry Redmond
Social Policy Research Centre, University of New South Wales
- Dr Sam Rothman
Australian Council of Education Research
- Graeme Thomson
Australian Bureau of Statistics
Data users and website activities
At the end of the 2008-09 financial year there were 244 registered users of LSAC data. Thirty-two per cent of users are in the Australian Capital Territory, 26 per cent are in Victoria and 14 per cent are in New South Wales. There are also a small number of users based overseas and in all other Australian states except Tasmania.
The Growing Up In Australia website, <http://www.aifs.gov.au/growingup/>, was established in March 2002. There continues to be a steady increase in the number of website visits, as shown in Table 8. Website downloads indicate there is continuing, strong interest in publications from the study.
| Release date | 2004-05 | 2005-06 | 2006-07 | 2007-08 | 2008-09 | |
|---|---|---|---|---|---|---|
| 2004 Annual Report | 24 May 2005 | 501 | 10,831 | 9,024 | 5,183 | 2,747 |
| 2005-06 Annual Report | 11 December 2006 | 8,026 | 4,817 | 1,339 | ||
| 2006-07 Annual Report | 19 June 2008 | 2,938 | 4,122 | |||
| 2007-08 Annual Report | 3 December 2008 | 1,970 | ||||
| Discussion Paper 1: Introducing the Longitudinal Study of Australian Children |
27 March 2002 | 3,002 | 17,844 | 15,198 | 4,927 | 3,734 |
| Discussion Paper 2: Proposed study design and Wave 1 data collection |
22 September 2003 | 1,483 | 1,721 | 2,987 | 2,830 | 1,743 |
| Discussion Paper 3: Data management issues |
3 May 2004 | 10,317 | 10,389 | 9,471 | 9,104 | 1,574 |
| Discussion Paper 5: Wave 2 data management issues |
28 June 2007 | 196 | 2,182 | 1,573 | ||
| Technical Paper 1: Sample design |
26 September 2005 | 2,521 | 3,401 | 4,702 | 8,823 | |
| Technical Paper 2: Summarising children's wellbeing: the LSAC Outcome Index (PDF 1.4 MB) |
11 January 2006 | 2,322 | 1,960 | 1,945 | 1,454 | |
| Technical Paper 3: Wave 1 weighting and non‑response |
25 May 2006 | 103 | 1,351 | 1,188 | 1,165 | |
| Technical Paper 4: Children's time use in the Longitudinal Study of Australian Children |
July 2007 | 1,896 | 1,392 | |||
| Technical Paper 5: Wave 2 weighting and non‑response |
October 2007 | 671 | 1,210 | |||
| Newsletters | 160; | 7,928 | 8,257 | 12,431 | 18,589 | 20,699 |
| Data dictionary | 30 May 2005 | 150 | 2,237 | 2,625 | 1,931 | 2,374 |
| Total publication downloads | 160; | 23,381 | 56,225 | 66,670 | 62,903 | 55,919 |
| Total site visits | 160; | 57,227 | 85,966 | 107,890 | 155,144 | 182,263 |
Publications and presentations
Publications
Baxter, J 2008a, 'Breastfeeding, employment and leave: an analysis of mothers in Growing Up in Australia', Family Matters, no. 80, pp. 17-26.
Baxter, J 2008b, Timing of mothers' return to work after childbearing: variations by job characteristics and leave use, Research Paper no. 42, Australian Institute of Family Studies, Melbourne.
Baxter, J 2008c, 'Is money the main reason mothers return to work after childbearing? A quantitative analysis of reasons for return to work', Journal of Population Research, vol. 25, no. 2, pp. 141-60.
Baxter, J & Alexander, M 2008, 'Mothers' work-family strain in single and couple parent families: the role of job characteristics and supports', Australian Journal of Social Issues, vol. 43, no. 2, pp. 195-214.
Baxter, J & Gray, M 2008, 'Work and family responsibilities through life', Family Matters, no. 79, pp. 58-61.
Baxter, J & Smith, J 2009, Breastfeeding and infants' time use, Research Paper no. 43, Australian Institute of Family Studies, Melbourne.
Cole, TJ, Bellizzi, MC, Flegal, KM & Dietz, WH 2000, 'Establishing a standard definition for child overweight and obesity worldwide: international survey', British Medical Journal, vol. 320, pp. 1-6.
Edwards, B & Bromfield, L 2009, 'Neighbourhood influences on young children's conduct problems and pro-social behaviour: evidence from an Australian national sample', Children and Youth Services Review, vol. 31, no. 3, pp. 317-24.
Johnston, D, Nicholls, M, Shah, M & Shields, M 2009, 'Nature's Experiment? Handedness and early childhood development', Demography, vol. 46, no. 2, pp. 281-301.
Leigh, A & Gong, X 2009, Estimating cognitive gaps between Indigenous and non-Indigenous Australians [Abstract], Education Economics, vol. 17, no. 2, pp. 239-61.
Longitudinal Study of Australian Children 2009, Longitudinal Study of Australian Children: Key Research Questions, Department of Families, Housing, Community Services and Indigenous Affairs, Commonwealth of Australia, Canberra.
Quach, J, Hiscock, H, Canterford, L & Wake, M 2008, 'Outcomes of child sleep problems over the school transition period: Australian population longitudinal study', Pediatrics, vol. 123, pp. 1287-92.
Redmond, G 2008, Maternity Leave and Child Outcomes: Social Policy Research Centre, University of New South Wales, report prepared for Department of Families, Housing, Community Services and Indigenous Affairs, Commonwealth of Australia, Canberra.
Renda, J, Baxter, J & Alexander, M 2009, 'Exploring the work-family policies mothers say would help after the birth of a child', Australian Journal of Labour Economics, vol. 12, no. 1, pp. 65-87.
Smart, D, Sanson, A, Baxter, J, Edwards, B & Hayes, A 2008, Home-to-school transitions for financially disadvantaged children, report prepared by the Australian Institute of Family Studies for The Smith Family.
Wake, M 2008, Options for physical and biomarker augmentation in LSAC, Discussion Paper, prepared for the Australian Institute of Family Studies.
Wake, M, Hardy, P, Sawyer, MG & Carlin, JB 2008, 'Comorbities of overweight/obesity in Australian pre-schoolers: cross-sectional population study', Archives of Disease in Childhood, vol. 9, no. 6, pp. 502-07.
Wake, M, Sanson, A, Berthelsen, D, Hardy, P, Misson, S, Smith, K, Ungerer, J & The LSAC Research Consortium 2008, How well are Australian infants and children aged 4 to 5 years doing?, Social Policy Research Paper no. 36, Department of Families, Housing, Community Services and Indigenous Affairs, Commonwealth of Australia, Canberra.
Yamauchi, C 2008, The wellbeing of children with a disability and their parent's workforce participation', Social Policy Evaluation, Analysis and Research, Australian National University, report prepared for Department of Families, Housing, Community Services and Indigenous Affairs, Commonwealth of Australia, Canberra.
Conference Presentations
Baxter, J 2008, Parental time with children and children's activities: an analysis of Australian time use diaries of 4-5 year olds, paper presented at the 10th Australian Institute of Family Studies Conference, Melbourne.
Baxter, J 2008, Is money the main reason mothers return to work after child-bearing? A quantitative analysis of reasons by timing of return, use of leave and other factors, paper presented at the Australian Population Association Conference, Alice Springs.
Baxter, J, Renda, J, Alexander, M, Whitehouse, G & Baird, M 2008, What mothers want: exploring the policies mothers say would help after the birth of a child', paper presented at the 10th Australian Institute of Family Studies Conference, Melbourne.
Bencic, L & Parker, R 2008, How important is marriage to Australians' health, wealth and happiness?, paper presented at the Australian Population Association Conference, Alice Springs.
Bencic, L & Parker, R 2008, The health, financial and relationship well-being of Australian couples: does marriage matter?, paper presented at the 10th Australian Institute of Family Studies Conference, Melbourne.
Berthelsen, D, Nicholson, J, Lucas, N & Wake, M 2009, Australia and the early years: where are we at?, Early Years Forum, Communities for Children, Townsville, Australia.
Blakemore, T 2008, Capital in context profiling the developmental contexts of children across a socio-economic gradient, paper presented at the 10th Australian Institute of Family Studies Conference, Melbourne.
Brinkman, S, Silburn, S, Lawrence, D, Sayers, M, Goldfeld, S & Oberklaid, F 2008, Validity of the Australian Early Development Index (AEDI), paper presented at the 10th Australian Institute of Family Studies Conference, Melbourne.
Brown, J 2008, A balancing act: can competing family policy objectives be met?, paper presented at the 10th Australian Institute of Family Studies Conference, Melbourne.
Brown, J & Bittman, M 2008, Social gradient, lifestyle and overweight/obesity in four year old children, paper presented at the 10th Australian Institute of Family Studies Conference, Melbourne.
Brown, J, Nicholson, J, Broom, D & Bittman, M 2008, Do working parents grow couch potato kids?, International Association for Time Use Research, Sydney.
Gray, M & Baxter, J 2008, The labour market and financial consequences of relationship breakdown and re-partnering of mothers with young children, paper presented at the 10th Australian Institute of Family Studies Conference, Melbourne.
Hayes, A 2008, It's about time: new insights from Growing Up in Australia for getting it right for families, paper presented at the Family and Parenting Institute's Parent-Child 2008 Conference, London, England.
Harrison, LJ 2008, Measuring, quantifying, and establishing quality as a critical aspect of children's experience of early childhood education and care, paper presented at the Australian Association for Research in Education national conference, Brisbane.
Harrison, LJ & McLeod, S 2008, School adjustment and achievement in children identified as having speech and language impairment at age 4-5 years, paper presented at the Australian Association for Research in Education national conference, Brisbane.
Harrison, LJ & Ungerer, JA 2009, Infant-caregiver attachment in the context of a national system of quality improvement and assurance in child care, presented at the biennial meetings of the Society for Research into Child Development (SRCD), Colorado, USA.
Hosking, A, Whitehouse, G & Baxter, J 2008, Paternity leave and father's involvement in infant care: time diary evidence from Australia, paper presented at the 10th Australian Institute of Family Studies Conference, Melbourne.
Losoncz, I 2008, The relationship between child support compliance and its predictors: evidence from two waves of LSAC data, paper presented at the 10th Australian Institute of Family Studies Conference, Melbourne.
McLeod, S 2008, Sound management: working with children with speech impairment, invited 2 day session in each state Speech Pathology Australia National Tour Speaker, Melbourne, Sydney, Canberra, Brisbane, Adelaide, Perth, Launceston, Darwin.
McLeod, S & Harrison, LJ 2008, Teacher and parent concern about children's speech and language: prevalence, risk and protective factors identified in LSAC, paper presented at the Early Childhood Australia national conference, Canberra.
Misson, S 2008, Determining the effects of housing costs on the well-being of Australian families, paper presented at the 10th Australian Institute of Family Studies Conference, Melbourne.
Quach, J, Hiscock, H, Canterford, L & Wake, M 2008, The natural history and outcomes of child sleep problems across school transition: longitudinal population study, presented at the Australasian Sleep Association 20th Annual Scientific Meeting--Sleep on it, healthy function of sleep, Adelaide, Australia.
Quach, J, Wake, M, Canterford, L & Hiscock, H 2008, The natural history and outcomes of child sleep problems across school transition: longitudinal population study, Population Health Congress, Brisbane, Australia.
Romaniuk, H, Lucas, N, Nicholson, J & Whitehouse, G 2008, Parental leave and parenting: complexities of analysis, Parental leave: assessing impacts and refining policy directions, Brisbane, Australia.
Sciberras, E, Ukoumunne, O & Efron, D 2009, Predictors of Attention-Deficit/Hyperactivity Disorder in children aged 6-7 years: a national, longitudinal study, Royal Australasian College of Physicians, Sydney.
Smart, D & Sanson, A 2008, Do Australian children today have more problems than 20 years ago?, paper presented at the 10th Australian Institute of Family Studies Conference, Melbourne.
Smart, D, Sanson, A, Baxter, J, Edwards, B & Hayes, A 2008, Home-to-school transitions for financially disadvantaged children, Launch of Report at the Smith Family Annual General Meeting, Sydney.
Smart, D, Sanson, A, Baxter, J, Edwards, B & Hayes, A 2009, School readiness and vulnerable children, Resilient Families Need Resilient Workers Symposium, Melbourne.
Soloff, C 2008, Growing Up in Australia, the longitudinal study of Australian children: study methodology and background, paper presented at the Early Childhood Australia Biennial National Conference, Canberra.
Strazdins, L 2008, What does family friendly really mean, paper presented at the National Families Week, Canberra.
Wake, M, Canterford, L, Carlin, J, Mathers, M, Patton, G & Williams, J 2009, Relationships between underweight, overweight and BMI status vary by morbidity type and by age: population studies, paper presented at Physicians Week conference--Royal Australian College of Physicians, Sydney, Australia.
---- 2009, Relationships between underweight, overweight and BMI status vary by morbidity type and by age: population studies, paper presented at PAS (Paediatric Academic Societies) meeting, Baltimore, Maryland.
Wake, M, Sanson, A, Smith, K & Berthelsen, D 2008, Child & maternal health predictors of physical, social/emotional and learning outcomes in infants and preschoolers, paper presented at the 10th Australian Institute of Family Studies Conference, Melbourne.
Yap, M & Biddle, N 2008, Preschool education: Who is attending and does attendance influence early school performance?, paper presented at the 10th Australian Institute of Family Studies Conference, Melbourne.
Data access
Data from Growing Up in Australia: the Longitudinal Study of Australian Children is warehoused at the Australian Institute of Family Studies and available to researchers approved by the Australian Government Department of Families, Housing, Community Services and Indigenous Affairs. Prospective users must abide by strict security and confidentiality protocols and are required to complete a dataset application and read and sign a deed of licence.
Data from Waves 1, 1.5, 2, 2.5 and 3 are currently available. Application forms and deeds of licence are available on the study's website <www.aifs.gov.au/growingup>. A nominal fee is charged to cover the administrative costs of delivering datasets.
The Australian institute of Family Studies (AIFS) provides user support services. Datasets are accompanied by a user manual that includes a description of the sample design, how the study was conducted, details of weighting procedures and item derivations, and a listing of variable names, labels and response categories. User training sessions are conducted to expand upon the information provided in the user manual. Please contact the AIFS data manager if interested in attending a data user training session.
For data requests, contact
Growing Up in Australia Data Manager
Phone: (03) 9214 7803
Fax: (03) 9214 7839
Email: lsacweb@aifs.gov.au
More information on Growing Up in Australia can be found on the study website <www.aifs.gov.au/growingup>. People with an interest in the study can join the email alert group to receive regular information on the study.
To join, send the following email:
To: majordomo@aifs.gov.au
Subject: (leave blank)
In the body of the email, type: subscribe growingup-refgroup
For general enquiries contact:
Growing Up in Australia Project Manager
Phone: (03) 9214 7892
Fax: (03) 9214 7839
Email: lsacweb@aifs.gov.au
For Study participant enquiries contact:
ABS
Phone: 1800 005 508
Email: growingup@abs.gov.au
Last updated: