Physical activity and health in mid-age and older Australian women
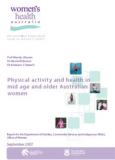
Table of contents
- Executive Summary
- List of Figures
- List of Tables
- Part A: Physical Activity and Health - Updating the Evidence for Women
- Part B: How Much Activity for Health Benefits in Women?
- Part C: How Active are Australian Mid-Age and Older Women?
- Part D: Relationships Between Physical Activity and Selected Health Outcomes in Australian Mid-age and Older Women
- Introduction
- Does Physical Activity Protect Against Menopausal Symptoms in Mid-Age Women?
- Does Physical Activity Protect Against Stiff or Painful Joints and Arthritis in Mid-Age and Older Women?
- Does Physical Activity Protect Against Anxiety and Depression in Older Women?
- Does Physical Activity Protect Against Memory Problems in Older Women?
- Does Physical Activity Protect Against Falls and Fractures in Older Women?
- Is There a Relationship Between Physical Activity and General Physical and Psychological Well-Being in Mid-Age and Older Women?
- Is There any Relationship Between Physical Activity and Healthcare Costs in Mid-Age and Older Women?
- Discussion
- References
- Appendices
- Appendix A: Population Based Studies of the Association Between Physical Activity and Coronary Heart Disease/Cardiovascular Disease
- Appendix B: Population Based Studies of the Association Between Physical Activity and Diabetes
- Appendix C: Population Based Studies of the Association Between Physical Activity and Gestational Diabetes
- Appendix D: Population Based Studies of the Association Between Physical Activity and Breast Cancer
- Appendix E: Population Based Studies of the Association Between Physical Activity and Colorectal Cancer
- Appendix F: Population Based Studies of the Association Between Physical Activity and Cancer (Excluding Breast and Colorectal Cancer)
- Appendix G: Population Based Studies of the Association Between Physical Activity and Mental Health
- Appendix H: Population Based Studies of the Association Between Physical Activity and Musculoskeletal Health
- Appendix I: Population Based Studies of the Association Between Physical Activity and Injury
- Appendix J: Population Based Studies of the Association Between Physical Activity and Reproductive Health
Executive Summary
Introduction
- The US Surgeon General's report was a landmark publication in the field of physical activity and health, but was constrained by a lack of evidence relating to women.
- This report examines the links between physical activity and health in mid-age and older women. It includes four parts:
- Recent evidence relating physical activity to the national public health priorities and reproductive health
- Consideration of the amount of physical activity required to obtain health benefits
- New data from the Australian Longitudinal Study on Women's Health on activity patterns, including relationships between changes in physical activity and life events, sociodemographic characteristics and health behaviours in mid-age and older Australian women
- New data from the Australian Longitudinal Study on Women's Health on the relationships between physical activity and menopausal symptoms, stiff or painful joints and arthritis, anxiety and depression, memory problems, falls and fractures, general physical and psychological well-being, and healthcare costs in mid-age and older Australian women
Physical Activity and Health – Updating the Evidence for Women
- A literature search was conducted to identify prospective population-based studies published from 1997 to January 2006.
- Measures of energy expenditure, derived from the frequency, intensity, and duration of physical activity, were more consistently associated with risk reduction than other self-report physical activity measures. Studies with comparatively large samples and a longer follow up period were more likely to demonstrate associations between physical activity and health.
- Fourteen of seventeen studies of physical activity and indicators of cardiovascular disease (CVD) indicated risk reductions ranging from 28 to 58%.
- Seven of eight studies of physical activity and type 2 diabetes indicated risk reductions ranging from 14 to 46%. Two studies on gestational diabetes (GDM) provided mixed evidence, with one reporting up to 76% risk reduction, and one reporting no association.
- Ten studies of physical activity and breast cancer provided mixed results. Six studies reported significant risk reductions with risk reductions ranging from 11 to 67%, two found non significant trends, and two found no relationship. Three studies indicated that the association between physical activity and breast cancer may be stronger for post-menopausal women.
- Three studies of physical activity and colon cancer were identified. One showed a significant risk reduction of between 31 and 46%, one found no association, and one was equivocal.
- Thirteen studies of physical activity and other cancers were identified. Physical activity provided a protective effect for bladder cancer (one study) and endometrial cancer (two studies). No association was found between physical activity and renal cell carcinoma (one study) or lung cancer (one study), and there were mixed results for pancreatic cancer (three studies), and all-cancer mortality (three studies). Two studies suggested a positive relationship between physical activity and increased risk of ovarian cancer.
- Ten studies of physical activity and mental health problems were identified. Two studies of depression provided mixed results. Two studies of emotional well-being both found a positive association. Five of six studies demonstrated that physical activity protects against cognitive decline and dementia.
- Five studies of physical activity and osteoarthritis were identified, with four finding no association. A fifth study suggested that active older people may be more at risk of osteoarthritis of the knee.
- Seven studies of physical activity and injury were identified and provided mixed evidence. Two studies demonstrated that higher levels of physical activity provided a protective effect against hip and vertebral fractures, with risk reductions up to 55%. Two studies found that low physical activity levels and sedentary leisure increased the risk of fractures. There was no association between physical activity and injury mortality (one study) or between walking and risk of second hip fracture (one study).
- Four studies of physical activity and reproductive health (menstrual and menopausal symptoms) were identified, and provided mixed results.
How Much Activity for Health?
- Australian guidelines recommend 30 minutes of moderate-intensity physical activity on most days of the week for health benefits, and suggest that more vigorous physical activity will confer greater health benefits. More physical activity is required for weight loss and preventing weight regain.
- The evidence reviewed here suggests that mid-age and older women gain few additional health benefits from vigorous physical activity over and above those achieved from walking or moderate intensity physical activity. For older women, vigorous physical activity may increase risk of fractures.
- Few studies have assessed the minimum duration and minimum frequency of physical activity required to obtain health benefits.
- While 150+ minutes of moderate intensity/week (600+ MET.mins) is associated with a range of health benefits, there can be significant protective effects against cardiovascular disease, diabetes, and mental health disorders, from only 60 minutes of moderate intensity physical activity/week (240 MET.mins/week). Greater amounts of physical activity may be necessary to prevent some conditions, including breast and colon cancer.
How Active are Australian Mid-Age and Older Women?
- Data are presented from the mid-age (45-60 years in 1996-2006) and older (70-85 years in 1996- 2006) cohorts of the Australian Longitudinal Study on Women's Health (ALSWH).
- The proportion of mid-age women meeting or exceeding the National Physical Activity Guidelines (ie active) increased from 2001 (45%) to 2004 (54%); this was primarily attributable to walking. Between 2001 and 2004, approximately one third were consistently active, 18% decreased their physical activity, and 26% increased their physical activity.
- Mid-age women who maintained or increased their physical activity were more likely than those who were sedentary to have at least high school education, to work part time, have a higher level of income, and to be a carer for someone with an illness or disability. They were less likely to be current smokers and non-drinkers, to have chronic health problems, and to be overweight or obese.
- Mid-age women who decreased their physical activity were more likely than those consistently active to have a lower level of education, to be a current smoker and non-drinker, to be obese, to have gained weight, and to have chronic health problems.
- Life events associated with mid-age women increasing their physical activity included a major personal achievement, retirement, and death of a spouse. Partner infidelity was associated with not decreasing physical activity.
- Mid-age women in part-time paid work (1–24 hours per week) and those in 'professional' occupations (eg teachers and nurses) tended to report higher levels of activity than women in full time work or in other occupation groups, respectively.
- The proportion of active older women declined from 34 to 30% between 1999 (when they were 73-78 years old) and 2005 (when they were 79-84 years old). The proportion of those who were sedentary increased from 31 to 44%. During this same period, 26% decreased their activity, and 16% increased their physical activity.
- Older women who maintained or increased their physical activity were more likely than those who were sedentary to have at least high school education, to have been born outside Australia, and to be single or widowed. They were less likely to be overweight or obese, and to be a current smoker, a non-drinker, a carer, or to have chronic health problems.
- Older women who decreased their physical activity were more likely than those consistently active to be obese, a current smoker, a non-drinker, and to have chronic health problems.
- Life events associated with older women decreasing their physical activity included having a major personal illness, injury or surgery. No specific life events were associated with older women increasing their physical activity, although there was a trend for women who reported death of a spouse not to decrease their physical activity.
Relationships between Physical Activity and Selected Health Outcomes
- Data are presented from the mid-age (45-60 years in 1996-2006) and older (70-85 years in 1996- 2006) cohorts of the Australian Longitudinal Study on Women's Health (ALSWH).
- Changes in physical activity were not related to menopausal symptoms in mid-age women.
- Physical activity did not protect against the development of new arthritis symptoms or arthritis in mid-age women. Among the older women, 75+ minutes of moderate-intensity physical activity/week was protective against the onset of stiff or painful joints over a three year period. Higher levels of physical activity (300+ min/week) were protective against the onset of arthritis over a three year period.
- Among the older women, very low, low, moderate and high levels of activity (75+ minutes per week) were associated with lower anxiety and depression scores. Women who reported the highest level of physical activity (300+ mins/week of moderate intensity physical activity) had the lowest anxiety and depression scores.
- Memory complaints were slightly less likely among older women who reported high levels of activity (ie an hour a day or more of moderate intensity physical activity). Low levels of health-related hardiness and overall mental health were better predictors of memory problems.
- High levels of physical activity were associated with reduced risk of falls, and of broken or fractured bones in older women who had not had a previous serious fall injury.
- Overall physical and mental well-being scores were significantly higher in mid-age and older women who were consistently active than in those who were consistently sedentary. These scores were as high among women whose physical activity increased over time, as they were among women who were consistently active, indicating that it is never too late to increase physical activity in order to gain health benefit.
- Physical activity was inversely associated with healthcare costs in both mid-age and older women, with the greatest differences being between sedentary women and those doing low levels of activity. For the mid-age women mean costs were 26.3% higher in those who were sedentary than in moderately active women. For older women mean costs were 23.5% higher in the sedentary women.
Conclusions
- Physical activity is very beneficial for women's health at the population level. Physical activity has a significant role in the primary prevention of cardiovascular disease, some cancers, diabetes, mental health problems, and musculoskeletal problems in women. Physical activity has also been shown to reduce healthcare costs. Importantly, there are benefits for women who become active later in life, even if they have been sedentary for a long time.
- There is a strong rationale for greater investment in the promotion of physical activity as a strategy for the primary prevention of a range of chronic health problems in women.
List of Figures
- Figure 1.1: Relative risk of cardiovascular disease outcomes by approximate quintiles of physical activity
- Figure 1.2: Relative risk of cardiovascular disease outcomes by approximate quintiles of walking
- Figure 1.3: Relative risk of cardiovascular disease outcomes by walking pace
- Figure 1.4: Relative risk of diabetes by approximate quintiles of physical activity
- Figure 1.5: Relative risk of diabetes by approximate quintiles of walking
- Figure 1.6: Relative risk of breast cancer by approximate quintiles of physical activity
- Figure 1.7: Relative risk of breast cancer by approximate quintiles of vigorous-intensity physical activity
- Figure 3.1: Timeline and ages of the women at each of the ALSWH surveys
- Figure 3.2: Proportions of women in each physical activity category in subsequent surveys at M2 (N=11,226), M3 (N=10,671), and M4 (N=10,163); and at O2 (N=9,123), O3 (N=8,052) and O4 (N=6,523)
- Figure 3.3: Box plots for physical activity by occupation category (M4 data; N=9241)
- Figure 3.4: Box plots for physical activity by hours of paid work (M4 data; N=10,041)
- Figure 3.5: Median and inter-quartile ranges for physical activity in the mid-age cohort at M3 (2001) and M4 (2004) (N=9,167) and in the older cohort at O2 (1999) and O3 (2002) (N=7,134)
- Figure 3.6: Median and inter-quartile ranges for time spent walking in the mid-age women (at M2, M3 and M4; N=8,693) and in the older women (at O2, O3 and O4; N=5,611)
- Figure 3.7: Changes in physical activity in the mid-age (N=9,167) and older (N=7,137) cohorts
- Figure 4.1: Mean menopausal symptoms scores by menopause transition (M3 to M4) and physical activity categories at M3 (N=3,330)
- Figure 4.2: Odds ratios (and 95% CI) for associations between physical activity at M3/O2 and often having (a) stiff or painful joints (mid-age N=4,780; older N=3,970) and (b) arthritis (mid-age N=7,217; older N=4,165) at M4 and O3 respectively
- Figure 4.3: Mean (SE) GADS scores at O3 for women in each physical activity category at O2 (N=4,228)
- Figure 4.4: Unadjusted and adjusted odds ratios for reporting a fall to the ground at O3, by O1 physical activity categories (N=6,468)
- Figure 4.5: Unadjusted and adjusted odds ratios (and 95% confidence intervals) for reporting a broken or fractured bone at O3, by O1 physical activity categories (N=6,468)
- Figure 4.6: Cross-sectional relationships between physical activity categories and SF36 PCS scores (left hand side) and MCS scores (right hand side) for (a) mid-age women at M1 (N=9,729) and (b) older women at O1 (N=7,984) in 1996 (mean and 95% CI)
- Figure 4.7: Mean (and 95% CI) PCS (left hand side) and MCS (right hand side) scores for each physical activity change category in (a) the mid-age women (M3 to M4; N=8,437) and (b) the older women (O2 to O3; N=5,416)
- Figure 4.8: Mean annual costs of Medicare rebateable health services by physical activity category for mid-age women in 2001 (pale bars; N=7,204; M3 survey) and older women in 1999 (darker bars; N=4161; O2 survey)
List of tables
- Table 3.1: Estimates of physical activity from consecutive surveys of mid-age women
- Table 3.2: Estimates of physical activity from consecutive surveys of older women
- Table 3.3: Summary of demographic and health-related variables associated with three categories of physical activity change in the mid-age women (N=7,721)
- Table 3.4: Summary of demographic and health-related variables associated with three categories of physical activity change in the older women (N=4,697)
- Table 4.1: Mean (SE) MAC-Q scores for women in each physical activity category (O3 survey; N=4,289)
- Table 4.2: Association between physical activity categories and MAC-Q score >29 in older women at O3 (N=4,298)
Part A
Physical Activity and Health - Updating the Evidence for Women
- Introduction
- Methods
- Cardiovascular Disease
- Type 2 Diabetes
- Cancer
- Mental Health
- Musculoskeletal Problems
- Injury
- Reproductive Health
- Discussion
Introduction
2006 marks the ten year anniversary of the landmark US Surgeon General's (USSG) Report on Physical Activity and Health (US Department of Health and Human Services, 1996). Released on the eve of the Centennial Olympic Games in Atlanta, the report espoused lifelong participation in moderate physical activity, rather than scaling Olympian heights to achieve health benefits.
The report documented the extent and strength of the evidence relating physical activity to health benefits, especially in the area of coronary heart disease, diabetes, hypertension, colon cancer, mental health, musculoskeletal health, and independence in older adults. A striking feature of the report's section on physical activity and cardiovascular disease was that only four of the thirty six cited studies included data from women. The largest of the early cohort studies which assessed physical activity included Morris's studies of London Transport workers (Morris, Kagan, Pattison, Gardner & Raffle, 1966) and British civil servants (Morris, Everitt, Pollard, Chave, & Semmence, 1980); Paffenbarger's studies of Harvard Alumni (Paffenbarger, Wing, & Hyde, 1978) and San Francisco longshoremen (Paffenbarger & Hale, 1975); Taylor's study of US railroad industry employees (Taylor, Klepetar, Keys, Parlin, Blackburn, & Puchner, 1962); Shaper and Wannamethee's (1991) British Regional Heart Study; and the Lipid Research Clinics prevalence survey (Ekelund, Haskell, Johnson, Whaley, Criqui, & Sheps, 1988), all of which only included men.
A tally of the studies linking physical activity with other health outcomes in the USSG report shows that fewer than 5% of all participants in these studies were women. Even in the area of cancer epidemiology, male participants in the studies of prostate cancer outnumbered the women involved in the breast cancer studies by two to one. It is therefore timely on this tenth anniversary of the USSG report to explore the evidence relating to physical activity and health in women. In the first part of this report, we review the recent evidence relating physical activity to the primary prevention of six of the national public health priority areas in women. The focus is exclusively on adults, and particularly on women aged 45 years and over, who are most at risk of developing health problems related to inactivity.
A focus on primary prevention
Since 1996 over one thousand papers have been published that discuss the health benefits of physical activity in women. Because of the sheer volume of this literature, and our belief that in order to improve population health outcomes there is a need to increase attention in the area of primary prevention, we chose to restrict this review to population-based primary prevention studies. The review therefore focuses on results from large cohort studies that consider the evidence for a role of physical activity in the prevention of those health conditions that cause most ill health and disability in Australian women – namely the six public health priority areas of cardiovascular disease, cancer, diabetes, mental health problems, musculoskeletal problems and injury (fracture). Asthma is not included as there is little evidence to suggest that physical activity has a role in the primary prevention of asthma, though it certainly has a role in asthma management.
We have not included studies of physical activity and risk factors for these conditions [eg blood pressure, blood lipids (for cardiovascular disease), elevated blood glucose (for diabetes), bone density or osteoporosis (for fracture)], focusing instead only on studies of physical activity and the six specific health outcomes. In light of its explicit relevance for women's health, we have however also included a short section on the evidence relating physical activity and several reproductive health issues.
Interpreting the data – The importance of the physical activity measure
For example, the University of Pennsylvania Alumni study, which was established in 1962, used questions based on those developed by Paffenbarger for the Harvard Alumni study.
Although physical activity is now widely accepted as an important factor in the secondary and tertiary prevention (ie management) of chronic disease, most of the evidence comes from rehabilitation trials that focus on exercise tolerance or psychosocial status and risk factors rather than on long term health outcomes. Few of these studies have had sufficiently long follow-up to assess long term health outcomes. Most of the studies have been conducted with convenient volunteer samples, and few have been translated for more widespread intervention.
In terms of secondary prevention it should however be acknowledged that there is now good evidence to support a role for physical activity in the secondary prevention of cardiovascular disease (eg through reducing high blood pressure and lipid levels) and diabetes (eg through reducing raised blood glucose and body mass index; Bauman, 2004). There is also strong evidence to support the role of physical activity in the tertiary prevention or management of cardiovascular disease, diabetes and injury, and growing evidence to support its role in the management of some cancers and mental health problems (Pedersen & Saltin, 2006).
A focus on primary prevention
A literature search was conducted to identify existing evidence on the effectiveness of physical activity for primary prevention. CINAHL, PRE CINAHL, PSYCHINFO, PSYCHLIT and MEDLINE electronic databases were utilised with the following search terms: physical activity, exercise, female, women, longitudinal, prospective, cohort, health, diabetes, cancer, arthritis, cardiovascular, coronary, musculoskeletal, injury, mental, psychological, cognitive, mortality. The search was limited to those studies published from 1997 to January 2006, and written in English. The titles and abstracts of identified articles were checked for relevance by two of the authors of this report (NB, WB).
Only prospective population-based studies, where physical activity was a primary study variable, were included. Evidence from clinical or small scale trials, or studies that assessed physical activity as a treatment or as an effect modifier, were not considered. Reviews and meta-analyses of the association between physical activity and the identified health conditions were also considered, as well as individual publications mentioned in these studies. Studies that included both men and women were included if results were stratified by gender. The reference lists of relevant articles were checked for additional papers.
Interpreting the data – The importance of the physical activity measure
In all the studies reviewed here, the relationships between physical activity and the outcome of interest vary significantly according to the method of measuring physical activity. For logistical reasons, few studies have included objective measures of physical activity, though the prospective studies conducted at the Cooper Clinic (Aerobics Centre Longitudinal Study) measured aerobic capacity as an indicator of fitness (Farrell, Braun, Barlow, Cheng, & Blair, 2002).
In a meta-analysis of heart disease risk factors, it was noted that, in general, studies which have measured fitness showed stronger relationships with health outcomes than those which rely on self report measures (Williams, 2001). However, the self report measure used in the US Nurses Health Study (NHS) has been validated and shown to have good measurement properties compared with detailed diary records of physical activity (Wolf, Hunter, Colditz, et al., 1994).
Most of the more recent large US cohort studies (beginning with the NHS which was established in 1976) have derived estimates of total energy expenditure from responses to questions about time spent in walking, and in moderate- and vigorous-intensity physical activity. The results of these studies have been used to assess the frequency, intensity and duration (or dose) of physical activity associated with specific health outcomes. In general, studies using measures of energy expenditure show more consistent estimates of risk reduction than those that rely only on measures of frequency or on responses to more generic physical activity questions.
Some studies have asked more detailed questions about specific forms of physical activity or participation in selected sports and recreational activities. For example, the University of Pennsylvania Alumni study, which was established in 1962, used questions based on those developed by Paffenbarger for the Harvard Alumni study which assess blocks walked, stairs climbed and participation in organised sports (Paffenbarger, Wing, & Hyde, 1978). The Pennsylvania alumni study did not however, find significant associations between physical activity and cardiovascular disease in women, except in women who walked more than 10 blocks per day (Sesso, Paffenbarger, Ha, & Lee, 1999). This may be because walking was reported more precisely than the other activities, or because the women did not typically engage in stair climbing or organised sports.
These questions were modified for the US Women's Health Study (WHS), a trial that began in 1992 and is assessing the effects of aspirin and vitamin E in the prevention of cardiovascular disease and cancer (Buring & Hennekens, 1992a, 1992b). Their questions focus on recreational activities typically undertaken by women, including walking and stair climbing. Although time in each activity is converted to an overall estimate of energy expenditure (kJ), this is one of few studies that is able to accurately assess participation in activities of different intensity, as it does not rely on responses to more generic questions about moderate and vigorous physical activity.
Few studies have focused on both occupational and leisure-time activity, and those that have, have mostly included only men. Recent exceptions are the Buffalo Health Study (Dorn, Cerny, Epstein, Naughton, Vena, Winkelstein, et al., 1999) and the Canadian Fitness Study (Weller & Corey, 1998) which included detailed questions about work-related as well as leisure time physical activity. Measurement of work-related physical activity has however proven to be especially challenging in women – particularly among women who do not have consistent patterns of physical activity in their paid and unpaid work. Although Canadian researchers have estimated that household work accounts for 82% of women's physical activity (Weller & Corey, 1998), it is not known whether contemporary household activities are carried out at an intensity that is sufficient to elicit health benefits (Brown, Trost, Ringuet, & Jenkins, 2001).
Studies that use global or single item self assessment of physical activity, those that emphasise participation in organised sport and work-related vigorous activity, and those that rely on individual perceptions of fitness, do not demonstrate strong relationships between physical activity and health outcomes in women. This is likely to be because the measures do not capture the true nature or volume of physical activity undertaken by participants. Because of the limitations imposed by these and other more generic measures, results from those studies with more detailed physical activity measures are specifically highlighted in this report.
Other methodological considerations
In considering the evidence presented here, it is also important to consider the age of participants at baseline and the duration of follow-up of the cohort. As the incidence of most health problems increases with age, it is more likely that there will be sufficient events for detection in the analyses if participants are older, and if there is a long follow-up period.
For rare events, such as bladder cancer, very large samples are required, such as those established for the NHS I (N=121,000), NHS II (N=116,000) (Colditz & Hankinson, 2005) and the Women's Health Initiative Observational Study (WHI) (N=74,000) (Manson, Greenland, LaCroix, Stefanick, Mouton, Oberman, et al., 2002). For studies with smaller numbers of women, such as the Pennsylvania Alumni study, smaller samples can show significant results when there is a long period of follow-up – in that case the cohort has now been followed for more than 30 years (Sesso et al., 1999). The NHS and WHI studies have published analyses based on data collected for between 6 and 16 years, allowing several hundred thousand person-years of follow-up, and providing ample power to detect the incidence of rare or less common health problems.
An important characteristic of the more recent large cohort studies is that the researchers are able to adjust for the effects of a range of potential confounders, including risk behaviours such as smoking and drinking alcohol, diet (fat, fibre, fruit and vegetables), use of menopausal hormones, body composition and size (body mass index, waist to hip ratio), body fat, other chronic diseases such as diabetes, and biological markers such as cholesterol and blood pressure. In most studies, inclusion of these confounders attenuates the relationships between physical activity and health outcomes.
Results with the highest level of adjustment have been selected for inclusion in the tables and figures in this report. This means that the estimates are conservative and do not take into account the additional favourable effects of physical activity on adiposity and other intermediate risk factors such as cholesterol and blood pressure (Manson et al., 2002).
Cardiovascular Disease
The USSG report found an inverse association and a dose-response relationship between physical activity or cardiorespiratory fitness and both cardiovascular disease (CVD) in general and coronary heart disease (CHD) specifically (US Department of Health and Human Services, 1996). The level of risk reduction with regular physical activity was noted to be similar to that of other behavioural risk factors such as not smoking. There were no conclusive data relating physical activity and stroke, and only 2% of participants in the reviewed studies were women.
For this review we found 17 new studies of physical activity and several different cardiovascular outcomes in women, published since 1997 (see Appendix A). Previous researchers have noted that the relationship between physical activity and CVD outcomes is less consistent in women than in men and have suggested that this could be explained by measurement error associated with assessment of physical activity in women (Sesso, Paffenbarger, Ha, & Lee, 1999).
The five new studies which focused on CVD or CHD mortality support this view, with one showing little or no relationship (Dorn, Cerney, Epstein, Naughton, Vena, Winkelstein, et al., 1999), and three finding significant associations between physical activity and CVD mortality (Gregg, Cauley, Stone, Thompson, Bauer, Cummings, et al., 2003; Kushi, Fee, Folsom, Mink, Anderson, & Sellers, 1997; Weller & Corey, 1998). One study found no relationship after 10 years (Haapanen, Miilunpalo, Vuori, Oja, & Pasanen, 1997), but then reported a significant association after 16 years (Haapanen-Niemi, Miilunpalo, Pasanen, Vuori, Oja, Malmberg, 2000).
In general, three of the studies, [the Study of Osteoporotic Fractures (SOF; 7553 women aged 65 years or more; Gregg et al., 2003); the Iowa Women's Health Study (40,417 post-menopausal women; Kushi et al., 1997); and the Canadian Fitness Study (6,620 women aged 30 years or more; Weller & Corey 1998)] had much stronger measures of physical activity. Importantly, both the SOF (Gregg et al., 2003) and Iowa (Kushi et al., 1997) studies reported that the risk reductions associated with walking or moderate intensity activity (mPA) were similar to those observed for total physical activity.
The Iowa researchers reported a significant inverse association between any regular physical activity and CVD mortality (RR=0.72, 95% CI 0.54, 0.95; Kushi et al., 1997). In the Canadian study, there was a significant reduction in risk of CVD mortality with non-leisure physical activity (Weller & Corey, 1998; see Table 1). This is one of the only studies to show that women's work-related physical activity may be linked to CVD risk in the same way as has been reported for men.
The SOF (which was set up to explore risk factors for fracture) also found that women who became active later in life had rates of CVD mortality similar to those of women who maintained their level of activity from baseline (Gregg et al., 2003). In this study, recent physical activity was a more significant predictor of longevity than past physical activity. It is possible that the higher levels of high density lipoprotein cholesterol (HDL-C) in pre-menopausal women confer an advantage in terms of heart disease risk, so that physical activity becomes even more important in terms of reducing heart disease risk in post-menopausal women, when HDL-C levels are lower.
New data from three of the large US women's cohort studies [the Women's Health Study with almost 40,000 women (Lee, Rexrode, Cook, Manson & Buring, 2001); the Women's Health Initiative (Manson, Greenland, LaCroix et al., 2002) and the Nurses' Health Study (Manson, Hu, Rich-Edwards et al., 1999), each with more than 70,000 women] have now shown significant associations between physical activity and reduced risk of incident coronary heart disease and coronary events (see Figure 1.1). These results suggest that participation in activities that expend the energy equivalent of as little as one to three hours a week of moderate intensity physical activity is associated with a 20-30% reduction in these cardiovascular health outcomes. Increasing the energy expenditure of physical activity (either through increasing intensity or activity time) results in further reductions in the risk of CVD (relative risk; RR as low as 0.47, 95% CI 0.33, 0.67; see Appendix A).
The US Surgeon General's report did not find a consistent relationship between physical activity and stroke (US Department of Health and Human Services, 1996). In contrast, data from studies of four large cohorts of women now provide strong evidence of a graded inverse relationship between physical activity and risk of ischaemic stroke in women (Ellekjaer, Holman, Ellekjar, & Vatten, 2000; Hu, Stampfer, Colditz, Ascherio, Rexrode, Willett, et al., 2000; Nakayama, Date, Yokoyama, Yoshiike, Yamaguchi, & Tanaka, 1997; Paganini-Hill & Barreto, 2001).
Data from several of these studies support the notion that the benefits of physical activity can be realised with brisk walking. Among women who do not do any other form of physical activity, as little as one hour of walking per week at a rate of only 3.2 – 4.8 km/hour is associated with a relative risk reduction for several CVD outcomes, including stroke, of 18-50% (Hu et al., 2000; Manson et al., 2002; Manson, Hu, Rich-Edwards, Colditz, Stampfer, & Illett, 1999). Compliance with national guidelines is associated with a further reduction in risk, with an average of relative risk of about 0.62 for 10 MET.hours per week of walking (2.5 hours) (see Figure 1.2 and Appendix A).
For women who walk, these studies also show that the speed of walking is important. The average relative risk for cardiovascular outcomes among women who walk at 3.2–4.8 km/hour is 0.78, while for those who walk faster (4.8–6.4 km/hour) the average relative risk for these cardiovascular outcomes (CHD, CVD, events and stroke) is about 0.60, compared with those who walk more slowly (see Figure 1.3 and Appendix A).
There is therefore now accumulating evidence which confirms the dose-response relationship between physical activity and several different cardiovascular health problems in women, with new evidence to show the importance of physical activity in preventing stroke. The risk reductions are around 20% for minimal compliance with guidelines and up to 58% for increased volumes (which can be through increased duration, frequency or intensity) of activity.
Figure 1.1: Relative risk of cardiovascular disease outcomes by approximate quintiles of physical activity.
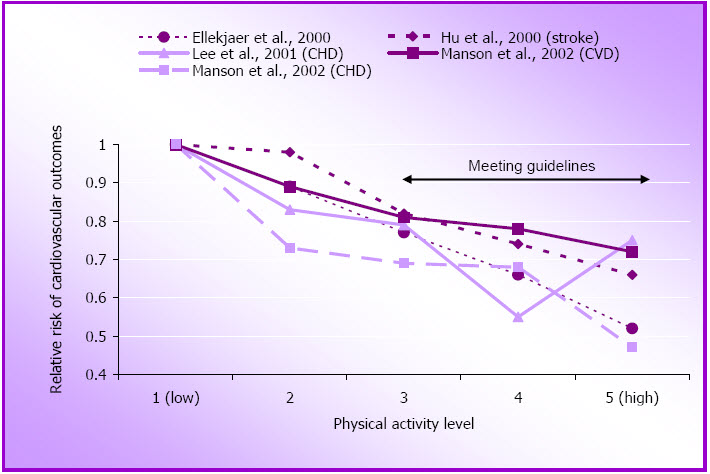
Figure 1.2: Relative risk of cardiovascular disease outcomes by approximate quintiles of walking.
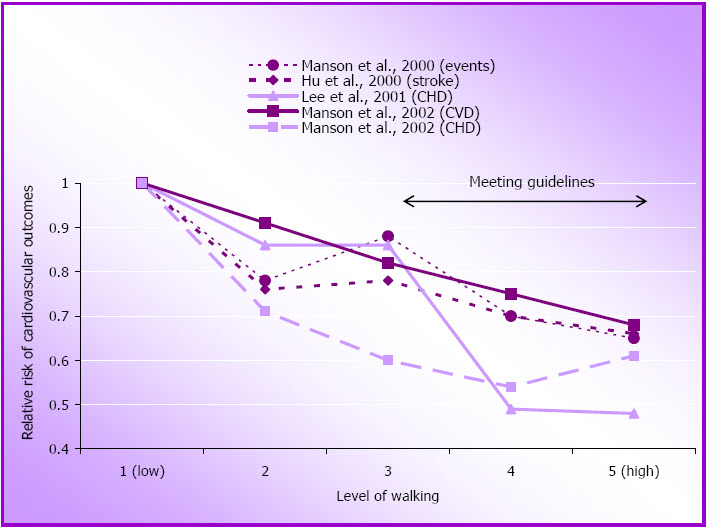
Figure 1.3: Relative risk of cardiovascular disease outcomes by walking pace.
Type 2 Diabetes
As was the case for cardiovascular disease, the US Surgeon General's report found that regular physical activity lowered the risk of developing non-insulin-dependent diabetes mellitus (NIDDM) (US Department of Health and Human Services, 1996). At that time, three large US cohort studies [the male college alumni study (Helmrich, Ragland, Leung, & Paffenbarger 1991); the male physicians study (Manson, Rimm, Stampfer, Coldtiz, Willett, Krolewski, et al., 1991); and the NHS (Manson, Nathan, Krolwewski, Stampfer, Willett, & Hennekens, 1992)] had provided good evidence of significant reductions in risk of NIDDM with quite small increments in physical activity.
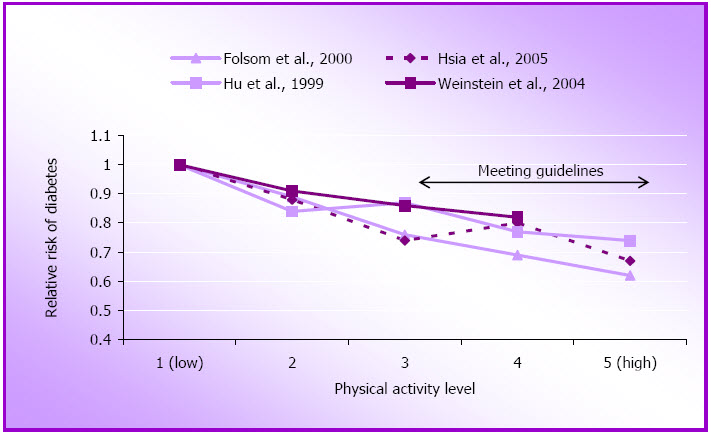
For this review we found eight new reports on the role of physical activity in the primary prevention of type 2 diabetes in women. (The term diabetes will be used here for type 2 diabetes as the term NIDDM is not now routinely used). The three large US women's cohort studies including the NHS (Hu, Li, Colditz, Willett, & Manson 2003; Hu, Sigal, Rich-Edwards, Colditz, Solomon, Willett, et al., 1999), the WHI (Hsia, Wu, Allen, Oberman, Lawson, Torrens, et al., 2005) and the Women's Health Study (Weinstein, Sesso, Lee, Cook, Manson, Buring, et al., 2004) have all reported independent associations between physical activity and incidence of diabetes (See Figure 1.4 and Appendix B).
Interestingly, the most recent report from the WHI found this relationship only in Caucasian women, and not in African-American, Hispanic or Asian/Pacific Islander women (Hsia et al., 2005). The researchers considered one explanation for this observation might be that the non-Caucasian women did not perform sufficient physical activity to reach a hypothetical threshold for benefit. While they confirmed that the African-American and Hispanic (but not the Asian) women were less active, when they compared women with equivalent levels of physical activity they could not find any compelling evidence for an association between physical activity and diabetes prevention in non-Caucasian women. It was stressed that these findings are provocative rather than definitive, and require further research.
Figure 1.4: Relative risk of diabetes by approximate quintiles of physical activity.
In another study involving a different ethnic group, Kriska, Saremi, Hanson, et al., (2003) found a significant association between total physical activity and incident diabetes in a group of Pima Indians in Arizona. The relationship was however attenuated after adjustment for age and body mass index. This smaller study (approximately 1000 women) is the only cohort study to have used an objective measure of diabetes (oral glucose tolerance test) instead of self-report. Both the NHS and the WHS have however, conducted sub-studies to verify self-report of diabetes. The NHS reported that 98% of their sub-sample of 62 women was confirmed to have diabetes (Manson et al., 1991) and the WHS confirmed the self report of diabetes in 91% of their sub-sample of 473 women (Weinstein et al., 2004).
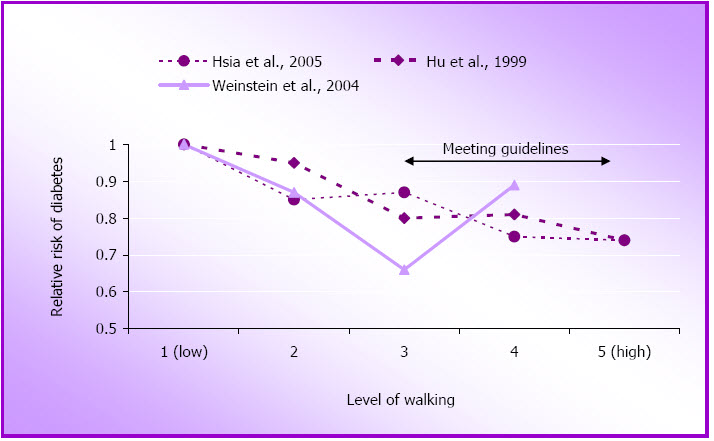
Since 1997 the NHS researchers have published several important papers on physical activity and diabetes. One focused on the potential benefits of walking for diabetes prevention (Hu et al., 1999). Using data from eight years of follow-up, the researchers found a significant inverse association between energy expenditure from walking and risk of diabetes, with increased risk reduction with faster pace of walking (see Figure 1.5 and Appendix B). The researchers concluded that equivalent energy expenditures from moderate and vigorous physical activity may confer similar benefits, with each additional hour per day of brisk walking associated with a 34% reduction in diabetes.
A second paper from the NHS, published in 2003, with data from six years of follow-up, reported that independent of exercise levels, sedentary behaviours, especially watching television, were associated with significantly increased risk of diabetes (Hu et al., 2003). Sedentary occupations (ie long hours of sitting or standing at work) were significantly associated with higher body mass index but not with diabetes, and even light activities, such as standing or walking around at home (household work) and brisk walking were each associated with significantly reduced risk of both obesity and diabetes.
The WHS has reported very similar findings to those from NHS. The WHS researchers also compared the relative contributions of body mass index and physical activity to diabetes risk reduction (Weinstein et al., 2004). They found that although physical activity and body mass index are both independent predictors of incident diabetes, the magnitude of the association with body mass index was greater than for physical activity, emphasizing the critical role of adiposity in the development of diabetes.
Figure 1.5: Relative risk of diabetes by approximate quintiles of walking.
A note about the secondary prevention trials for diabetes
In the area of diabetes prevention, it is important to note that, since publication of the USSG report (US Department of Health and Human Services, 1996), there have been several landmark studies of the role of physical activity in the secondary prevention of diabetes in at risk individuals (ie those with elevated blood glucose but not diabetes). These randomised controlled trials, which included both male and female participants, have shown reduced progression to diabetes with increased physical activity, and in most cases, weight loss. The Diabetes Prevention Program (which included 1043 men and 2191 women) found that lifestyle modification (including physical activity, dietary change and weight loss) was more beneficial than metformin in reducing the development of diabetes (Knowler, Barrett-Connor, Fowler, Hamman, Lachin, Walker, et al., 2002). An earlier randomised controlled trial in Finland (172 men and 350 women) also found that improvement in diet and exercise reduced the risk of diabetes, even if target weight loss goals were not reached (Tuomilheto, Lindstrom, Eriksson, Valle, Hamalainen, Ilanne-Parikka, et al., 2001) and the Da Qing study in China (283 men and 247 women) found similar risk reductions for both diet and physical activity intervention groups (Pan, Li, Hu, Wang, Yang, An, et al., 1997).
Gestational diabetes
In light of the evidence relating physical inactivity to the development of diabetes, there is increasing interest in the role of physical activity in gestational diabetes (GDM). The USSG report (US Department of Health and Human Services, 1996) did not include any consideration of gestational diabetes. Although exercise during pregnancy is not directly relevant to all mid-age and older women, this is an important issue because women who have gestational diabetes are more likely to develop type 2 diabetes.
The NHS II, which began in 1989, has explored determinants of GDM in their very large (N >116,000) cohort of female nurses (Solomon, Willett, Carey, Rich-Edwards, Hunter, Colditz et al., 1997). They found no association between pregravid total physical activity and GDM risk, and non-significant associations between both self reported pre-pregnancy vigorous physical activity and brisk walking and relative risk of GDM (see Appendix C).
In contrast, the smaller OMEGA study, (N=909) which was designed to explore risk factors for pre-eclampsia, found that women who were physically active both prior to and during pregnancy had a 69% reduced risk of GDM, even after adjustment for age, race, parity and pre-pregnancy body mass index (Dempsey, Sorensen, Williams, Lee, Miller, Dashow, et al., 2004; see Appendix C). These conflicting data suggest that more research is necessary to elucidate the role of physical activity in GDM, and the impact of post-pregnancy physical activity on the risk of developing type 2 diabetes in mid-age.
Cancer
The US Surgeon General's Report examined the evidence for relationships between physical activity and a range of cancers, and concluded that regular physical activity was associated with a decreased risk of colon cancer, but the relationship between physical activity and breast cancer was "inconsistent" (US Department of Health and Human Services, 1996).
Breast cancer
As the most commonly occurring cancer in Australian women (Australian Bureau of Statistics, 2001), the evidence relating to physical activity and the primary prevention of breast cancer is of particular interest. At the time of the USSG report there was insufficient evidence to support an association (US Department of Health and Human Services, 1996). Our review, however, identified ten new cohort studies with comprehensive measures of physical
activity published since 1997 and the results of these are summarised in Appendix D.
Both the Women's Health Initiative (WHI) (McTiernan, Kooperberg, White, Wilcox, Coates, Adams-Campbell et al., 2003) and the 16 year follow-up of the NHS reported significantly reduced risk of breast cancer in women with higher total (moderate and vigorous) physical activity. In the NHS, the cumulative average of physical activity (assessed biennially over 14 years) showed a reduction in risk of incident breast cancer over 16 years of 18% (RR=0.82; 95% CI 0.70-0.97), for women reporting >7 hours per week of moderate intensity physical activity and vigorous physical activity (Rockhill, Willett, Hunter, Manson, Hankinson, & Colditz, 1999).
An analysis of data from more than 40,000 women in the French E3N cohort also found a linear decrease in risk of breast cancer with increasing amounts of both moderate and vigorous recreational activity (Tehard, Friedenreich, Oppert, & Clavel-Chapelon, 2006). Women who reported more than five hours of weekly recreational physical activity had a relative risk of breast cancer of 0.62 (95% CI 0.49-0.78). The relationships were consistent in overweight women, those with a family history of breast cancer, and in hormone replacement therapy users. The risk reduction was greatest for nulliparous women. Although the measure was less comprehensive, the Norwegian study by Thune, Brenn, Lund, & Gaard (1997) also reported a significant association between both leisure-time physical activity (LTPA) and occupational physical activity, with decreased risk of breast cancer. The risk reduction was stronger in pre-menopausal women than in post-menopausal women, and in women younger than 45 years of age than those older than 45 years of age.
In contrast, both the US WHS (Lee, Rexrode, Cook, Hennekens, & Buring 2001) and the Iowa Women's Health Study (Moore, Folsom, Hong, Anderson, & Kushi, 2000) found that physical activity during mid-age is not significantly associated with decreased risk of breast cancer. There was a significant association between physical activity and breast cancer risk in women aged 55 years or more in the smaller Pennsylvania State Alumni study (Sesso, Paffenbarger, & Lee, 1998).
Figure 1.6: Relative risk of breast cancer by approximate quintiles of physical activity.
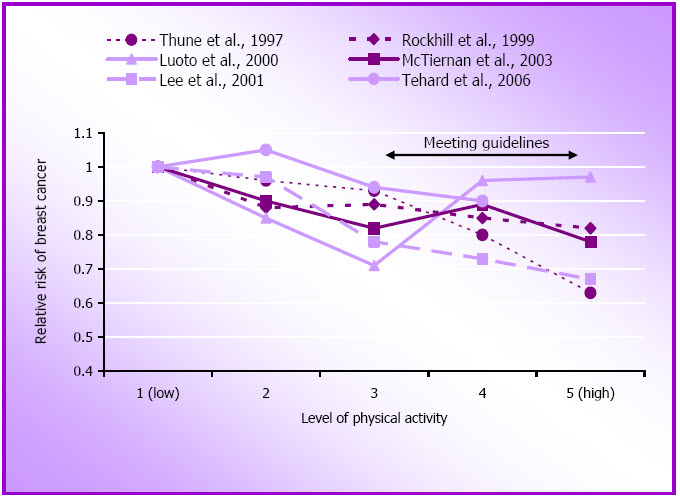
The majority of these findings confirm a modest inverse association between higher volumes of moderate intensity physical activity and vigorous physical activity and breast cancer risk, especially when a cumulative measure is used (see Figure 1.6). Although the NHS result using a cumulative measure (Rockhill et al., 1999) might imply that lifetime physical activity is important in the prevention of breast cancer, it is also possible that the cumulative measure simply gives a better indication of physical activity than a single one week recall, which would be more likely to result in misclassification of physical activity.
It is still unclear whether the relationship is stronger in post-menopausal than in pre-menopausal women though the WHS found this to be the case, with post-menopausal women who expended < 6300 kJ/week (equivalent to walking 24 km or about 6 hours/week) experiencing a risk reduction of 33% compared with those who expended ≥ 6300 kJ/week (Lee, Rexrode, Cook, Hennekens, & Buring, 2001). In her 2003 review of this evidence, Lee (2003) reported that the median relative risk for all studies published (including those prior to 1996) is about 0.8 for pre-menopausal and 0.7 for postmenopausal women.
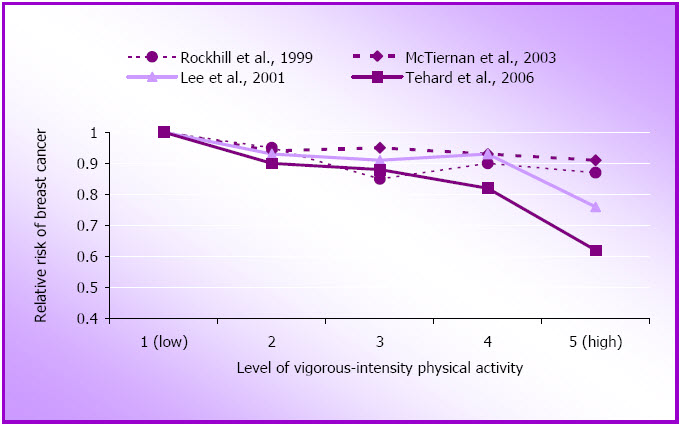
There is still debate about whether vigorous intensity physical activity is more likely to reduce risk of breast cancer than more moderate or mixed forms of physical activity. The results of several studies on vigorous activity and risk of breast cancer are presented in Figure 1.7. As very high levels of exercise and training can reduce the number of ovulatory menstrual cycles, it has been hypothesised that this might be the mechanism by which physical activity impacts on breast cancer risk. However, with the exception of data from the French E3N study (Tehard et al., 2006), the results reported here do not appear to support the argument that vigorous intensity is necessary for optimal risk reduction.
For example, in the NHS, the most popular form of physical activity was walking, (comprising more than 40% of all the moderate and vigorous physical activity reported) and the risk reduction in that study and in the WHI study was greater in the mixed group than in the vigorous only group (McTiernan et al., 2003; Rockhill et al., 1999). Moreover, the WHS, which ran a separate analysis for women who reported activities with an intensity > 6 METs, found no significant relationship between participation in vigorous activity and risk of breast cancer (Lee et al., 2001). In any event it is unlikely that exercise equivalent to daily athletic training is required to reduce the risk of breast cancer, as few of the women included in these large cohorts exercise at this level of intensity (McTiernan et al., 2003).
Figure 1.7: Relative risk of breast cancer by approximate quintiles of vigorous physical activity.
The mechanism of the association between physical activity and breast cancer risk is not clear. It is likely to involve energy balance and complex inter-relationships between fat metabolism and reproductive hormones. It is therefore important to acknowledge that these analyses have been adjusted statistically for potential confounders such as use of oral contraceptives and hormone replacement therapy, parity and menopausal status, and it is acknowledged that body mass index and weight change might be intermediate variables through which physical activity reduces the risk of breast cancer.
These data support a role for leisure-time physical activity as an independent and modifiable strategy for reducing the risk of breast cancer. Many studies have shown a clear dose-response relationship, with women who report at least one hour a day of physical activity having a 15-30% reduced risk of breast cancer. Most of the results point to the importance of avoiding obesity if physical activity is to have an optimal impact on risk of breast cancer (McTiernan et al., 2003; Thune et al 1997), and, importantly, the findings of the WHI and E3N studies suggest that physical activity can also reduce risk of breast cancer in women who are using hormone replacement therapy.
Colon cancer
As was the case for coronary heart disease, the evidence in the USSG report (US Department of Health and Human Services, 1996) about physical activity and colorectal cancer came predominantly from studies involving men. The largest cohort studies reviewed were the US alumni (Paffenbarger, Hyde, & Wing, 1987) and the health professionals' (Giovannucci, Ascherio, Rimm, Colditz, Stampfer, & Willett, 1995) studies. Fewer than 3% of the participants in all the studies reviewed were women. Both occupational and leisure-time physical activity had a protective effect on the risk of developing colon cancer, but not rectal cancer (US Department of Health and Human Services, 1996).
For this review we found three more recent large cohort studies that examined this relationship in women (see Appendix E). The NHS followed 67,802 women for six years and was the first study to report a significant inverse association between average weekly leisure time physical activity (based on moderate intensity physical activity and vigorous physical activity) and incident colon cancer in women (Martinez, Giovannucci, Speigelman, Hunter, Willett, & Colditz, 1997). This may be because previous studies had focused on colorectal cancer (eg Thune & Lund, 1996) or on occupational measures of physical activity which are problematic in women (Martinez et al., 1997). The NHS found that women who reported >21 MET.hours of physical activity per week (equivalent to about 5 hours of moderate physical activity) had almost half the risk of colon cancer, compared with the most sedentary women (Martinez et al., 1997).
For moderate physical activity only, the relative risk for those reporting an hour or more per day was 0.69 (95% CI 0.52-0.90) and for vigorous physical activity, the relative risk for those reporting more than 30 mins per day was 0.61 (0.43-0.86) (Martinez et al., 1997). Researchers working with the US Cancer Prevention cohort established in 1992 with almost 100,000 older women (50-74 years), also found a significant inverse association between risk of colon cancer and time spent in walking and other physical activity (Chao, Connell, Jacobs, McCullough, Patel, Calle et al., 2004). However among women who reported only walking, there was no significant association.
In contrast to these two US reports, the Norwegian study, which included almost 40,000 women who were followed for 10-12 years, found no independent association between physical activity and incident colon cancer, but noted that risk of colon cancer was associated with diabetes and high blood glucose in women (Lund Nilsen & Vatten, 2001).
Other cancers
Since the publication of the USSG (US Department of Health and Human Services, 1996) there has been more research into the relationship between physical activity and reproductive (ovarian and endometrial) cancers, but the relationships remain equivocal. For example, both the 15 year follow-up of the Iowa WHS (Andersen, Ross & Folsom, 2004) and the 16 year follow-up of the NHS (Bertone, Willett, Rosner, Hunter, Fuchs, Speizer et al., 2001) analysis found some suggestion of a positive relationship between physical activity and increased risk of ovarian cancer.
In contrast, data from the Swedish census study reported a trend towards increasing risk of endometrial cancer with decreasing levels of occupational physical activity in women aged 50-69 years (Moradi, Nyren, Bergstrom, Gridley, Linet, Wolk et al., 1998), and data from the Swedish Twin Registry showed markedly decreased incident endometrial cancer with increasing levels of physical activity (based on a very poor measure of physical activity) (Terry, Baron, Weiderpass, Yuen, Lichtenstein, & Nyren, 1999) (see Appendix F).
For this review we also found three recent studies of pancreatic cancer – none of which showed any significant relationships, although there was a trend towards decreasing risk of pancreatic cancer with increasing levels of moderate physical activity and walking/hiking in the combined analysis of data from the health professionals and nurses studies (Michaud, Giovannucci, Willett, Colditz, Stampfer, & Fuchs, 2001). In this study, individuals with a body mass index (BMI) >30 in the lowest tertile of exercise had twice the risk of pancreatic cancer of those in the healthy weight range in the highest tertile of physical activity, and the risk of pancreatic cancer was highest in obese individuals with glucose abnormalities. These findings also suggest a role for insulin resistance and hyperinsulinaemia in the relationship between physical activity and development of pancreatic cancer.
Neither of the studies of lung cancer or renal cancer included in Appendix F found any consistent relationships with physical activity. Data from the Iowa WHS do however suggest that physical activity may be protective against bladder cancer (which is also strongly associated with cigarette smoking in women) (Tripathi, Folsom, & Anderson, 2002).
Of the three studies that have reported on the relationship between physical activity and overall cancer mortality, the Iowa researchers reported "non-significant associations" (Kushi, Fee, Folsom, Mink, Anderson, & Sellers, 1997), the NHS researchers reported a "modest reduced risk of cancer mortality" and a non significant dose-response trend (Rockhill, Willett, Manson, Leitzmann, Stampfer, Hunter, et al., 2001) and the SOF researchers found that increasing physical activity was associated with decreased risk of cancer mortality (Gregg, Cauley, Stone, Thompson, Bauer, Cummings, & Esrud, 2003). It would appear therefore that the evidence relating to the potential of physical activity for the prevention of cancers other than breast and colon cancer remains equivocal for women, and more studies are required before definitive conclusions can be made.
Mental Health
At the time the USSG report was written there was equivocal evidence about the role of physical activity in the prevention and management of mental health problems (US Department of Health and Human Services, 1996). The report cited four prospective longitudinal studies that examined the relationships between physical activity and the primary prevention of depressive symptoms in the general population.
In the NHANES I study, men and women who reported little or no physical activity and few depressive symptoms at baseline were almost twice as likely to report depressive symptoms after eight years of follow-up (Farmer, Locke, Moscicki, Dannenberg, Larson, & Radloff 1988). Similar results were found in the Alameda County study in which 1799 men and women were followed for nine years (Camacho, Roberts, Lazarus, Kaplan, & Cohen, 1991), and in the Harvard Alumni study which followed 21,596 men for twenty years (Paffenbarger, Lee, & Leung, 1994). The fourth study however, found no relationship between physical activity at baseline and psychiatrist-diagnosed depression in a cohort of more than 1500 Bavarian men and women after five years of follow-up (Weyerer, 1992).
Since 1996, this area has received a great deal of research attention, with many reviews of the effects of physical activity on constructs such as depression, anxiety, self-esteem, affect and mood, resilience to stress and cognitive function. The Paluska & Schwenk review (2000) concluded that physical activity had not been shown to prevent the onset of depression. In contrast, another review in the same year found "convincing evidence" from cohort studies that maintenance of regular exercise can reduce subsequent risk of depression (Fox, 2000). Philips, Kirnan & King (2003) also reviewed nine cohort studies and found that most (eight) reported an inverse association between physical activity and depression.
For the present review we found three more cohort studies which have explored the relationships between physical activity and the primary prevention of mental health problems in women (see Appendix G). The Melbourne Women's Midlife Project found that changes in physical activity were positively associated with changes in well-being (Guthrie, Dudley, Dennerstein, & Hopper, 1997). A later report from this study (not included in the table) found that life satisfaction during the menopause transition was predicted by earlier exercise (Dennerstein, Dudley, Guthrie, & Barrett-Connor, 2000).
Two papers from the Australian Longitudinal Study on Women's Health have also reported short term prospective relationships between physical activity and mental health. The first reported that increases in physical activity over three years were associated with improvements in emotional and mental well-being among older women aged 70-78 years (Lee & Russell, 2003). The second reported that increasing levels of physical activity in mid-age women (age 50-60 years) were associated with decreases in depression scores, and that women who increased their physical activity by as little as one hour per week over three years had reduced risk of poor mental health at five year follow-up (Brown, Ford, Burton, Marshall, & Dobson, 2005). In contrast, the Rancho Bernado study found that exercise did not protect against future depressed mood. The physical activity measure used in this study was however very generic (Kritz-Silverstein, Barrett-Connor, & Corbeau, 2001).
Cognitive functioning
In recent years there has been growing interest in the relationships between physical activity and the prevention of cognitive decline in older people. For this review we found six new cohort studies, and all except one (Suutama & Ruoppila, 1998) reported associations between higher levels of physical activity and reduced cognitive decline (see Appendix G).
In their 2001 study of women enrolled in the Study of Osteoporotic Fractures (SOF), Yaffe, Barnes, Nevitt, Li-Yung & Covinsky (2001) found that the relative risk of cognitive decline decreased with increasing physical activity in women aged 65 and older. Both moderate (eg playing golf once a week, tennis twice a week or walking 1.6 km/day) and strenuous physical activity were associated with reduced risk of cognitive decline after six to eight years, and the effects were most marked among women aged 65-70 years. Similarly, researchers from northern Italy have reported that higher levels of physical activity in a small cohort of 70-75 year-old women were associated with less decline in cognitive function over 12 years (Pignatti, Rozzini, & Trabucchi, 2002).
Recent results from the NHS provide support for these findings. Both vigorous physical activity and walking the equivalent of 1.5 hours per week at an easy pace (21-30 min/mile) were associated with better cognitive performance after nine years (Weuve, Kang, Manson, Breteler, Ware, & Grodstein, 2004). After adjustment for multiple confounders, including chronic disease and functional limitations, women in the highest quintile of total physical activity (>26 MET.hours per week, or about an hour a day of brisk walking), were 20% less likely than women in the lowest quintile to experience cognitive decline over six to eight years (Weuve et al., 2004).
The Canadian Study of Health and Ageing has also reported on associations between physical activity and dementia and Alzheimer's disease. One study indicated that regular exercise was protective against the development of vascular dementia in women aged older than 65 years (Hebert, Lindsay, Werreault, Rockwood, Hill, & Dubois, 2000), but the measure of physical activity reported for this study was very weak. However, in another analysis of data from the same study, which used a composite measure of physical activity, the researchers found that physical activity was associated with lower risks of cognitive impairment, Alzheimer's disease and dementia (Laurin, Verreault, Lindsay, MacPherson, & Rockwood, 2001).
The results of these studies are sometimes seen to be controversial as there is a possibility of reverse causation in all of them. In other words, a pre-existing cognitive impairment could have caused a reduction in physical activity. However, both the SOF (Yaffe et al., 2001) and NHS (Weuve et al., 2004) results were adjusted for a wide range of potential covariates and the relatively long follow-up periods probably rule out this limitation. While the mechanism of the association between physical activity and cognitive function is unclear, the NHS researchers propose that physical activity may reduce cardiovascular risk factors and thereby ensure adequate vascular perfusion (Weuve et al., 2004). Alternatively there may be a relationship between physical activity, insulin resistance and the development of amyloid 13 plaques (which are a pathologic feature of Alzheimer disease) (Weuve et al., 2004).
Although the changes in cognitive function scores reported in the NHS were small (Weuve et al., 2004), subtle decreases in cognitive performance are a key predictor of dementia development. These new findings therefore provide an important new focus for physical activity research. Approximately 11% of those aged 80 to 84 years, and 24% of those aged 85 years and over have dementia, and it has been estimated that 65% of those over 80 have problems with reasoning and memory (Prime Minister's Science, Engineering and Innovation Council, 2003). As higher levels of physical activity, including walking, are associated with better cognitive functioning and less cognitive decline in older women in these cohort studies, it will be interesting to see if physical activity can slow cognitive impairment in randomised physical activity trials.
A note about secondary and tertiary prevention of mental health problems
A review of the secondary and tertiary prevention research (see page 3 for definitions) found that physical activity may play a role in the management of mild to moderate mental health problems such as depression and anxiety (Paluska & Schwenk, 2000). However, Lawlor and Hopker (2001) undertook a detailed systematic review of the role of physical activity in the management of depression, and found that no conclusion could be reached because of a "lack of good quality research on clinical populations with adequate follow-up" (p 1). It is clear from this review that much of the research is limited by small clinical samples, a focus on vigorous-intensity exercise, inadequate follow-up beyond 12 months, a lack of assessor and/or participant blinding, and self reported outcome measures.
In contrast, a 2003 review found that, although there was a need for more research with stronger methodology, the literature was generally supportive of the beneficial effects of physical activity and exercise on depression (Phillips, Kiernan, & King, 2003).
Musculoskeletal Problems
Osteoarthritis
The USSG report concluded that although there was no evidence that physical activity causes osteoarthritis, injuries sustained during competitive sports had been shown to increase the risk of development of osteoarthritis (US Department of Health and Human Services, 1996).
For this review we identified five new reports from large cohort studies which have assessed osteoarthritis as an outcome measure in women, and only one of these found a significant relationship between physical activity and the risk of incident osteoarthritis (see Appendix H). None of the large US women's cohort studies described earlier in this report has yet reported on osteoarthritis.
The Framingham study was established in 1948, with the aim of exploring risk factors for cardiovascular disease. In 1983, when the average age of participants was 70.5 years, the researchers began a sub-study with radiographic assessment of osteoarthritis. Using a measure of physical activity based on usual physical activity during each hour of a typical day, the researchers found the highest levels of physical activity were associated with increased risk of incident osteoarthritis in this elderly sample of women who did not have osteoarthritis at baseline (Felsen, Zhang, Hannan, Naimark, Weissman, Alibandi et al., 1997). Obesity, weight gain and (not) smoking were also associated with increased risk of incident osteoarthritis.
As in previous studies, Felsen et al., (1997) found that obesity and weight gain were associated with the development of osteoarthritis, particularly in women. While this may reflect increased joint loading on hips and knees, the relationship between obesity and hand osteoarthritis suggests that this is not the sole explanation. It is likely that systemic metabolic processes underlie the links between obesity and osteoarthritis. Notwithstanding the mechanisms, the evidence suggests that about 3% of mid-age women will develop radiological knee osteoarthritis every year, and confirms the importance of avoiding weight gain at this life stage as an important preventive measure against development of knee osteoarthritis (Hart, Doyle, & Spector, 1999).
The other studies did not confirm the Framingham findings. For example, in a subset of participants in the Aerobics Centre Longitudinal Study (ACLS) which began in 1970, Cheng, Macera, Davis, Ainsworth, Troped & Blair (2000) found that high levels of physical activity (running 20 miles per week or more) were associated with increased risk of osteoarthritis, but only in men aged <50 (after adjustment for BMI, smoking, alcohol and caffeine).
The lack of significant findings for women and older men may reflect the low numbers of women and older participants in the high physical activity category (there were only 45 women aged over 50 years in the high physical activity group, compared with 270 men; and only 166 younger women compared with 733 men). Among younger women, body mass index and caffeine consumption, but not physical activity, were associated with the development of osteoarthritis.
In a later study of the same cohort, the Cooper Clinic researchers created a physical activity joint stress variable based on physical activity volume and estimated joint stress imposed by participation in specific sports - values were highest for strenuous sports and weightlifting, and lowest for swimming and stretching (Hootman, Macera, Helmick, & Blair, 2003). The joint stress physical activity score was not associated with increased risk of osteoarthritis, and in the absence of joint injury, moderate physical activity, such as walking, cycling and swimming, did not increase the risk of incident osteoarthritis over a 12 year period. Older age, joint injury, previous joint surgery and high body mass index were confirmed as independent risk factors for hip/knee osteoarthritis in men, but only age and body mass index were independent risk factors in women (Hootman et al., 2003).
This research is important because it suggests that moderate-intensity physical activity is not detrimental to joint health. The researchers argue that moderate types and amounts of physical activity are imperative for developing and maintaining fitness and optimal body weight, and should not be discouraged because of concern about osteoarthritis. Previous reports do, however, suggest that men who play long term vigorous sports, such as various forms of football, and in particular those who sustain a serious injury, do have increased risk of developing osteoarthritis and should therefore be encouraged to adopt activities that place less load on the large weight bearing joints (Brukner & Brown 2005). To date there are no reports of long term participation in women's sport, such as netball, and development of osteoarthritis.
The two remaining studies included in Appendix H did not find any association between physical activity and osteoarthritis in women (Hart, Doyle & Spector, 1999; Seavey, Kurata, & Cohen, 2003). However, the UK Chingford study included younger women (mean age 54.1 years) and confirmed obesity as an important risk factor for osteoarthritis (Hart et al., 1999). In contrast, the Alameda County study, which was established in 1965, found a protective effect of physical activity (measured by frequency of participation in sports such as swimming, long walks, hunting/fishing, gardening and physical exercises) on osteoarthritis in men, but not in women, after 20 years of follow-up (Seavey et al., 2003)
Injury
For this review we have chosen to focus on the outcome of fractures as an example of injury. Although osteoporosis is now recognised as a health outcome in its own right as a condition characterised by low mass and structural deterioration of bone tissue, it leads to bone fragility and increased risk of fracture. It was, therefore, conceptualised as a risk factor and excluded from this review.
It is well known that weight bearing physical activity and resistance training maintain the normal structure and functional strength of bone, and increase bone mineral density (BMD), thereby decreasing the risk of fracture (Drinkwater, 1993). However, risk of fracture is complex and it is difficult to assess the independent role of physical activity in risk reduction as there are complex interactions between physical activity and muscle strength, balance, BMD, use of medications (including hormone replacement therapy), calcium intake, eyesight and falls, all of which have been shown to have a role in the aetiology of fracture.
It is also likely that the skeletal effects of physical activity differ in younger and older women, with evidence to suggest that exercise during periods of high growth (ie around the time of the adolescent growth spurt) is associated with greater increases in bone density than occur at any other stage of the life cycle (Bailey, 2000). This makes the evidence from prospective cohort studies of adults difficult to interpret, as we cannot be sure that adults who report lower levels of physical activity now are not protected against fracture by earlier efforts to get "bone in the bank" during childhood and adolescence (Bailey, 2000). Notwithstanding, the USSG report concluded that there was promising evidence to support the view that physical activity, including resistance training, is protective against falling and fractures among the elderly, as a result of increased muscle strength and improved balance (US Department of Health and Human Services, 1996).
For this review we found six new reports from cohort studies on the relationships between physical activity and fracture in women (see Appendix I). The French OFELY (Os des Femmes de Lyon) study tracked 672 healthy post-menopausal women for 5.3 years and found that low physical activity was independently associated with increased risk of hip fracture, after adjustment for smoking, alcohol, caffeine and calcium intake. (Albrand, Munoz, Sornay-Rendu, duBoeuf, & Delamas, 2003). Women who sustained a fracture had significantly lower BMD and grip strength and were likely to have had a previous history of fracture.
The US Study of Osteoporotic Fractures (SOF) followed a cohort of almost ten thousand women aged over 65 years for 7.6 years (Gregg, Cauley, Seeley, Ensrud, & Bauer, 1998). Physical activity was assessed using a modified version of the Harvard Alumni questionnaire. The researchers found that each increasing quintile of physical activity was associated with reduced relative risk of hip fracture; with the greatest risk reduction in women who reported participation in aerobics, tennis or weight training, or at least two hours of moderate/vigorous physical activity per week. There was also a significant reduction of hip fracture in women who reported ten or more hours of vigorous household chores each week. In this study physical activity was not associated with wrist or vertebral fracture.
In contrast, data from the Blue Mountains Eye Study (which was established to explore risk factors for eye disease, and therefore has an interest in fracture through the links between visual acuity and falls), found that women who reported doing no viorous physical activity had a reduced risk of wrist fracture (Ivers, Cumming, Mitchell, & Peduto, 2002). These somewhat surprising data confirm previous data from the SOF that suggest that wrist fracture occurs in women who are active and healthy and presumably participating in the type of physical activity that would predispose them to falling.
The remaining studies in Appendix I focus on hip fracture. The most comprehensive data are from the NHS, which found that, in their cohort of more than 61,000 post-menopausal women, risk of hip fracture declined by 6% for every hour per week of walking at average pace (Feskanich, Willett, & Colditz, 2002). The effects were seen in both lean and heavy women, but the heavier women had lower risk of fracture. This is hypothesised to reflect both the increased BMD which is associated with higher body mass index, and potential protective effects of adipose tissue around the hips (Chaperlat, Bauer, Nevitt, Stone, & Cummings, 2003).
The NHS researchers estimated that if all the women had exercised at 9 MET.hours per week (2.3 hours of brisk walking) or more, 23% of hip fractures could have been prevented (Feskanich et al., 2002). If all women were active for 24 MET.hours per week (6 hours per week, or an hour on most days) there would be a 42% reduction in risk of hip fracture. Importantly, women who only walked (ie reported no other form of activity) for 4 hours a week or more, had a 40% decreased risk fracture, and even those who reported standing at work for 10 hours or more each week had a 28-46% reduction in risk. This evidence suggests that occupations such as nursing and teaching that involve standing (rather than sitting) at work may decrease the risk of fracture, independent of body weight and time spent in leisure activities (Feskanich et al., 2002). The NHS researchers also reported that active women not taking oestrogen supplements had similar protection against hip fracture to that provided by hormone use (Feskanich et al., 2002). The Danish Nurse Cohort Study also found that hormone replacement therapy did not modify the beneficial effect of activity on hip fracture risk (Hundrup, Ekholm, Hoidrup, Davidson, & Obel, 2005; see Appendix I).
Reproductive Health
Although this area is not identified as a national public health priority, consideration of the effects of physical activity on gynecological and obstetric health are included in this report because these issues are of clear interest for women's health. Moreover, while not directly relevant to many older women, research into the impact of physical activity on the menstrual cycle has attracted significant interest, especially in light of the so called female athlete triad of amenorrhea, low body fat and eating disorders. At the "other end" of the reproductive life cycle, there has been some research into the effects of physical activity on the timing of and symptoms associated with menopause.
For this review, we found that very few of the large population-based women's cohort studies have explored any reproductive health issues. Most research has been conducted with relatively small self-selected non-representative groups of women (for example highly trained elite athletes), often with poor measures of physical activity, and difficulties with outcome measures such as reporting the exact timing of menopause.
In terms of menstrual symptoms, exercise scientists have focused their interest on training-related amenorrhea which is caused by complex interactions between training induced changes to female reproductive hormones and fat metabolism, and hypothalamic control of the menstrual cycle. Very high levels of training with reduced levels of body fat (such as is often seen in ballet dancers and endurance athletes) can lead to either shortened or lengthened menstrual cycles and eventually to complete cessation of menstrual periods. There has also been considerable interest in the relationship between physical activity and dysmenorrhea (painful periods) and several randomised trials (mostly with college students) have shown a protective effect in terms of decreased symptoms with a program of training (Golomb, Solidum, & Warren, 1998).
It is, however, difficult to isolate exercise-related improvements in mood from true improvements in symptoms, and there are significant methodological problems in most of these studies. None of the large women's cohort studies has reported on the relationship between physical activity and menstrual symptoms. Sternfeld, Jacobs, Quesenberry et al (2002) reported on the results of two smaller studies, both of which found a positive association between vigorous physical activity and cycle length. These findings lend some support to the hypothesis that vigorous physical activity can increase the length of the menstrual cycle (Sternfeld et al., 2000).
The Melbourne Women's Midlife Health Project has tracked approximately 400 women through the menopause transition (Guthrie, Dennerstein, Taffe, Lehert, & Burger, 2005). The researchers found that low exercise levels are significantly associated with increased reporting of hot flushes, and that women who never report hot flushes are more likely to be high exercisers. This relationship has not been consistently shown in previous studies, and there is a clear need for more cohort studies to report on relationships between physical activity and both menstrual and menopausal symptoms.
Again, while not directly relevant to mid-age and older women, the issue of exercise and pregnancy is included here, in the interests of mid-age and older women who have daughters who are pregnant or planning to become pregnant. There has been considerable debate in recent years about the impact of physical activity on health outcomes for both mother and baby if expectant women exercise during pregnancy (Sports Medicine Australia, 2002). In relation to exercise and pregnancy, most research has focused on pre-term birth, labour-related complications and birth outcomes such as birth weight. In 2002, a statement from Sports Medicine Australia which was based on a review of the current literature, found that healthy pregnant women could begin or maintain moderate intensity aerobic exercise programs with little fear of adverse effects on their unborn foetus, and that concerns about the potential ill–effects of exercise during pregnancy, such as hyperthermia, shortened gestational age and decreased birth weight were not supported by the most recent review papers (Brown, 2002; Sports Medicine Australia, 2002).
For this review we found two recent studies which followed prenatal patients throughout pregnancy and recorded physical activity during pregnancy and length of gestation (Hatch, Levin, Shu, & Susser, 1999; Misra, Strobino, Stashinko, Nagey & Nandy, 1998) (see Appendix J). There was no clear association in either study between moderate physical activity and duration of gestation. In the Pennsylvania and New York study, the researchers reported that heavier levels of exercise, especially among previously conditioned women, appeared to significantly reduce the risk of pre-term birth (Hatch et al., 1998).
Among the few women who delivered post-term, conditioned heavy exercisers delivered more quickly than non-exercisers (Hatch et al., 1998). In contrast, the Maryland study found that the odds of pre-term delivery were increased in women who reported stair climbing and purposive walking (Misra et al., 1998).
Discussion
The evidence included in Part One of this report supports the notion that there is an inverse dose dependent relationship between physical activity and cardiovascular disease, some cancers, diabetes, mental health problems, and musculoskeletal problems in women. Importantly, the results of some these studies, which followed women from mid-age, found benefits for women who became active later in life, even if they had been sedentary for a long time (Hu, 2000).
In 1996, the associations between inactivity and health problems appeared to be stronger for cardiovascular disease and type 2 diabetes, (which have intermediate metabolic and physiological risk factors such as blood lipids, blood pressure etc that were also recognised as being independently affected by activity). More recent studies have strengthened the evidence relating physical activity to the prevention of some forms of cancer. Links between physical activity and fat metabolism, hormones, growth factors and immune function may also underlie these relationships. There is also new evidence relating to physical activity and mental health problems. Most, but not all of this evidence suggests an inverse association between physical activity and the development of depression, and there is growing evidence of a role for physical activity in the prevention of cognitive decline in older women. For some musculoskeletal problems (eg osteoarthritis and fractures), the evidence suggests that there are clear health benefits of regular physical activity for women.
From the evidence reviewed here there is no indication that physical activity can be harmful for women's health at the population level. Although injury (from participation in vigorous competitive sport) is implicated in the aetiology of osteoarthritis in men, none of the recent studies of physical activity and osteoarthritis have confirmed this association in women.
The evidence presented in this review provides a strong rationale for greater investment in the promotion of physical activity as a strategy for the primary prevention of a range of chronic health problems in women.
Part B
How Much Activity for Health Benefits in Women?
- Introduction
- Intensity
- Duration
- Frequency
- Total Time and Volume of Activity: Duration, Frequency and Intensity
- Discussion
Introduction
In 1995 the US Centers for Disease Control and the American College of Sports Medicine recommendation for the dose of physical activity required for health benefit was for 30 minutes of moderate intensity physical activity on most days of the week (Pate et al., 1995). The Australian National Physical Activity Guidelines for Adults also recommend at least 30 minutes of moderate intensity physical activity on most, preferably all, days of the week to enhance your health (Commonwealth Department of Health and Aged Care, 1999). Vigorous activity is recommended for those who are able, and wish, to achieve greater health and fitness benefits, and should be carried out for a minimum of 30 minutes, three to four days a week.
However in light of the growing obesity problem, in 2005 the US Department of Health and Human Services and the Department of Agriculture endorsed the 30 minutes of physical activity recommendation, but called for a minimum of 60 minutes/day of moderate intensity physical activity for the prevention of weight gain, and 90 minutes/day for the maintenance of weight loss in formerly obese individuals (US Department of Health and Human Services and the Department of Agriculture, 2005).
Since then, two recent randomised trials have shown that the existing national guidelines are sufficient for weight loss in overweight people following a low-calorie diet (Jakicic, Marcus, Gallagher, Napolitano & Lang, 2003) and for the prevention of weight gain in the absence of dietary change (Slentz, Duscha, Johnson, Ketchum, Aiken, Samsa, et al., 2004). Recently published data from the Australian Longitudinal Study on Women's Health also support the notion that 30 minutes of moderate intensity physical activity can prevent weight gain in mid-age women (Brown, Williams, Ford, Ball, & Dobson, 2005).
Medical practitioners usually prescribe a specific dose of medication for management of health problems. This dose typically comprises concentration (eg 50, 100mg), frequency (eg three times per day), and duration (eg for 7 days) of use. Although the terms are not exactly congruous, the dose of physical activity required for prevention of a health problem can also be described in terms of:
- intensity (eg light, moderate, vigorous)
- duration (e.g. the length of each session) and
- frequency (eg number of times per week).
It is difficult however to consider each of these independently, as the overall dose or volume of physical activity is a combination of intensity, duration and frequency, which together contribute to the overall energy expenditure of the activity. The question of whether different methods of achieving a certain energy expenditure or physical activity dose (eg by walking for a long time, or running for a shorter period) contribute to differences in health outcomes, is considered below.
Intensity
Although both the USSG report (US Department of Health and Human Services, 1996) and the Australian Guidelines (Commonwealth Department of Health and Aged Care, 1999) suggest that vigorous physical activity will confer greater health benefits than moderate physical activity, it is not clear if this is the case for mid-age and older women. Almost all the large cohort studies use measures of energy expenditure for physical activity, and it is now evident that the risk of several health outcomes decreases as volume of physical activity increases. Since vigorous physical activity requires higher energy expenditure, it is sometimes assumed that those who report higher volumes of physical activity are engaging in vigorous activity, and this assumption underpins many public health recommendations for physical activity.
Data from three of the large US women's cohort studies now suggest however, that energy expenditure from walking can confer similar benefits, in terms of reducing the risk of several health problems, to those seen with vigorous physical activity. The Nurses Health Study for example has reported that, compared with sedentary women, those who walk briskly for three hours/week or exercise more vigorously for 1.5 hours/week, have a 30-40% reduction in risk of myocardial infarction (Manson et al., 1999). The Women's Health Initiative (WHI) has shown that walking briskly for 2.5 hours per week is associated with a 30% reduction in cardiovascular events, even after only 3.2 years, and that more vigorous physical activity is associated with similar risk reduction, after adjusting for total energy expenditure (Manson et al., 2002). Similarly, the Women's Health Study has reported that health professionals who walked for just one hour per week had a 50% reduction in risk of CHD, even if they reported no vigorous physical activity (Lee et al., 2001).
This raises the issue of whether light activities might also be associated with health benefits. For example, the NHS has reported significantly reduced risk of diabetes with only light household work (Hu et al., 2003), and the Australian Longitudinal Study on Women's Health found that just one hour a week of physical activity was associated with decreased risk of depressive symptoms (Brown et al., 2005). In the Women's Health Study, even in women who had additional risk factors (ie were overweight, had high cholesterol, or were smokers), light to moderate physical activity was associated with reduced risk of many health problems (Lee et al., 2001).
One problem with the evidence relating to intensity is that in most studies participants are asked to report time spent in moderate and vigorous physical activity, and it is highly likely that perceptions of intensity differ markedly with age and fitness. For example, swimming at 4 METs (which is considered to be moderate intensity) would require 33% of capacity for a fit young woman with a capacity to swim at 12 METs, and would be reported as moderate.The same speed of swimming would require 66% of capacity for a fit older woman with a capacity to swim at 6 METs, who might therefore report this activity as vigorous. The issue of recalling and reporting the intensity of activities is particularly pertinent among women who typically do not participate to the same extent as men in structured or organised sport/exercise. This is because time spent in less 'structured' moderate-intensity activities is less reliably reported (Brown, Trost, Bauman, Mummery and Owen, 2004) and the intensity of these activities is more difficult to assess (Ainsworth, 2000).
Notwithstanding the measurement problems, there is now accumulating evidence that for mid-age and older women, there is little additional benefit of vigorous activity, over and above that obtained from the same level of energy expenditure from moderate-intensity activity. This does not mean that vigorous physical activity should be discouraged for those who wish to do it; but rather that it is not necessary for mid-age and older women to be vigorously active to derive health benefits.
Duration
The question of whether several short (eg 10 minute) sessions of physical activity are as effective in influencing health outcomes as one longer (eg 30 minutes) session was explored in a review by Hardman (2001). As few of the cohort studies have collected information about the duration of individual sessions of physical activity, most of the evidence comes from small randomised controlled trials with biological (eg fitness, triglycerides etc) outcomes.
In terms of improving cardiorespiratory fitness, Hardman (2001) found that there was some (limited) evidence to support the view that several short sessions per day were as effective as one longer or continuous session, and for biological markers such as triglycerides, two short sessions of moderate/hard exercise were as effective as a single session of the same duration. As none of the large women's cohort studies has explored the relationship between shorter bouts of physical activity and health outcomes, it is not clear whether women should accumulate their daily physical activity in sessions shorter than 30 minutes a day. Further analysis of data from the large cohort studies is required before definitive statements on the minimum duration of physical activity sessions for health benefits in women can be made.
Frequency
Lack of time is a common reason for not participating in physical activity (Booth, Bauman, Owen, & Gore, 1997), especially among women who typically face the juggling time issues associated with paid and unpaid work (Eyler, Matson-Koffman, Vest, Evenson, Sanderson, Thompson et al., 2002). There may be, therefore, an advantage for women to compress their physical activity into one or two sessions each week, rather than to be active on most, if not all, days of the week. The health effects of this pattern of physical activity have not been widely researched.
Issues of frequency of physical activity have been explored in detail by I-Min Lee, who introduced the concept of the weekend warrior to describe patterns of physical activity seen typically in men, who might participate in organised sport, such as golf or tennis, only on weekends (Lee, Sesso, Oguma, & Paffenbarger, 2004). Using data from the male participants in the Harvard Alumni study, Lee et al., (2004) concluded that a physical activity pattern which utilises 1000 kcal/week or more was required for health benefit, and that this could be accumulated in only one to two sessions per week, provided no other risk factors (eg smoking, alcohol, diet etc) for ill-health were present. For those with additional risk factors, health benefits were only observed in those who were active three or more times weekly (Lee et al., 2004). There are not yet any comparable data from the large US women's cohort studies, but there is no reason to believe that similar results to those reported for men (Lee et al. 1994), would not also be seen in women.
Total Time and Volume of Activity: Duration, Frequency and Intensity
In Australia the National Physical Activity Guidelines for Adults recommend at least 30 minutes of moderate intensity physical activity on most, preferably all, days of the week (Commonwealth Department of Health and Aged Care, 1999). This study has interpreted this statement to mean a minimum of 5 sessions of 30 minutes per week, or 150 minutes of moderate intensity physical activity each week. If we assume an average moderate intensity physical activity to be 4 METs, this equates with 600 MET.mins per week. In the US, values are typically reported in MET.hours per week, so the equivalent target is 10 MET.hours per week.
From the evidence presented above, it is clear that achieving 150 minutes, or 600 MET.mins, of physical activity is associated with health benefits across a wide range of health outcomes. However, for some health problems, such as breast and colon cancer, it may be necessary to accumulate greater amounts of physical activity (say 1200 MET.mins per week). This need not necessarily be more vigorous physical activity, but could be achieved, for example, by walking for an hour a day, five days a week, or by jogging for 30 minutes a day at twice the intensity of walking.
For optimal bone health it may also be true that higher intensity physical activity has a more beneficial effect on bone mineral density and therefore on risk of fracture. However, for elderly women, vigorous physical activity may be associated with increased risk of falls-related fracture, so activities that improve balance and flexibility are important for reducing the risk of falling. At the same time, weight bearing and resistance training will increase muscle strength and mass, and may increase BMD, leading to reduced risk of fracture (Feskanich et al., 2002).
Notwithstanding this, it is also becoming clear that there can be significant health benefits in some areas (eg prevention of cardiovascular problems, diabetes, mental health problems and osteoarthritis) for women who walk briskly for as little as one hour per week (ie 60 minutes, or 240 MET.mins or 4 MET.hours per week). While more physical activity will confer greater benefit, this is good news for women who are, for whatever reason, unable to achieve the recommended 'dose' of 150 minutes each week.
Discussion
It is clear that there is a need for more research into the dose-response issues relating to physical activity and health to clarify the individual contributions of intensity, frequency, duration of physical activity to different health outcomes. Several groups of US researchers are now conducting randomised controlled trials which are exploring the effect of different combinations of duration, frequency and intensity on health outcomes in women (eg Morss, Jordan, Skinner et al., 2004; Dunn, Trivedi, & O'Neal, 2001). A major challenge with these studies is to find representative samples of women who will comply with the different physical activity protocols for long enough for the health outcomes to be explored.
What is absolutely clear from this review is that the so called Rose principle of improving population health holds true in terms of physical activity and health (Rose, 1992). If a large segment of population could be persuaded to adopt modest improvements in physical activity – even 15-30 minutes per day, every day – the overall reduction in disease burden would be greater than if a modest segment adopted larger changes. It is also clear from the evidence reviewed here that getting women who are currently sedentary to 'take' a small daily dose of physical activity would result in much greater health outcomes than getting those who are already active to double their dose of physical activity.
In light of the health benefits of being more active in mid-age, public health policy should now focus on getting the most sedentary women to become more active. Even 15 minutes of daily moderate intensity activity is associated with some health benefits. Mid-age and older women who are already meeting activity guidelines should be encouraged to maintain this level of activity for as long as possible as they age. The magnitude of this challenge is outlined using data from the ALSWH in the next section of this report.
Part C
How Active are Australian Mid-age and Older Women?
- Introduction
- The Australian Longitudinal Study of Women’s Health
- Prevalence and Patterns of Physical Activity
- Trends in Physical Activity Over Time
- Factors Associated with Physical Activity Changes Over Time
- Associations Between Life Events and Changes in Physical Activity
- Discussion
Introduction
This section will consider:
- The prevalence and patterns of physical activity and inactivity among mid-age and older participants in the Australian Longitudinal Study on Women's Health (ALSWH),
- Trends over time in physical activity,
- Factors associated with changes in physical activity in consecutive surveys.
The Australian Longitudinal Study of Women’s Health
physical_activity_c3.aspx
The information in this section of the report is based on data from the Australian Longitudinal Study on Women's Health (ALSWH). The ALSWH – widely known as Women's Health Australia - is a longitudinal population-based survey, funded by the Australian Department of Health and Ageing. The project began in 1996 when three large, national cohorts representing three generations of Australian women were established (Brown, Bryson, Byles, Dobson, Lee, Mishra, & Schofield, 1998).
- The younger women were aged 18-23 years when first recruited in 1996 (N=14,247). In 2007, they were aged 28-34 years, the peak years for relationship formation, childbearing, and establishing adult health habits (eg physical activity, diet) and paid and unpaid work patterns.
- The mid-age women were initially aged 45-50 years in 1996 (N=13,716). In 2007, they were aged 55-61 years, and most have now experienced menopause, as well as changes in household structure and family care giving. Some are now contemplating retirement and are adopting new health behaviours in preparation for a healthy old age. Others are showing early signs of age-related physical decline.
- The older women were aged 70-75 years when first recruited in 1996 (N=12,432). In 2007, they are now aged 81-86 years and facing the physical, emotional and social challenges of old age.
This report is based on data from the mid-age and older cohorts.
Features of the ALSWH study design
- Women were randomly selected from the Medicare Australia database and invited to participate in the longitudinal study in 1996.
- Women in rural and remote areas of Australia were intentionally over-sampled to ensure adequate numbers for statistical analysis, and to capture the heterogeneity of health patterns among women living outside the metropolitan areas.
- ALSWH uses a mail survey methodology, with some telephone follow-up.
- Following the initial surveys in 1996, women in the three age cohorts have been surveyed sequentially, one cohort per year, on a rolling basis since 1998. The notation used in this report for the surveys, the years the surveys were conducted, and the ages and numbers of women at each survey are shown in Figure 3.1.
What is included in the surveys?
The study was initially designed to explore factors that influence the health of women who are broadly representative of the Australian population. There is a strong focus on the social determinants of health and on the aetiology of chronic health problems in mid-age and older women. There are questions in every survey on
- Physical and emotional health (including well-being, major diagnoses, symptoms)
- Use of health services (general practitioner, specialist and other visits; access; satisfaction)
- Health behaviours and risk factors (physical activity, diet, smoking, alcohol, drug use, BMI)
- Time use (including paid and unpaid work, family roles, and leisure)
- Socio-demographic factors (location, education, employment, family composition)
- Life stages and key events (such as childbirth, divorce, widowhood).
The project provides a valuable opportunity to examine associations over time between aspects of women’s lives and their physical and emotional health. It provides an evidence base to the Australian Department of Health and Ageing, as well as other Australian and State/Territory Departments, for the development and evaluation of policy and practice in many areas of service delivery that affect women. An overview of the study and investigators, copies of the questionnaires, and abstracts of publications and presentations can be located on the website www.alswh.org.au.
Figure 3.1: Timeline and ages of the women at each of the ALSWH surveys.
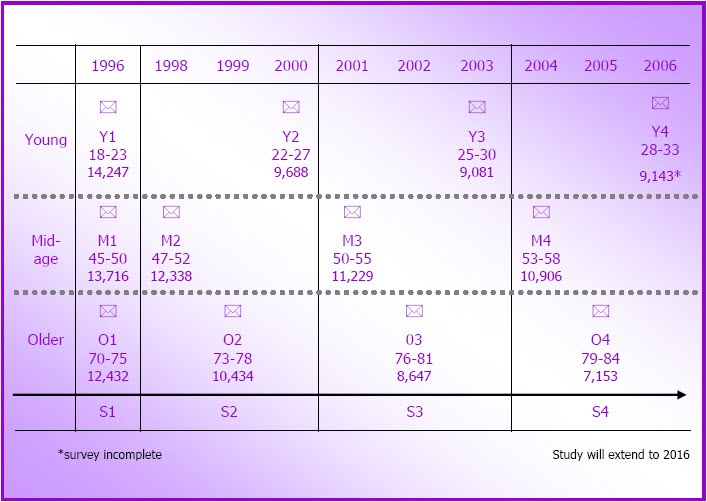
Response rates
Response rates to Survey 1 (1996) cannot be specified exactly as some women selected for the sample may not have received the invitation to participate. For example, deaths or changes of address may not have been notified to the Health Insurance Commission (now Medicare Australia). It is estimated that 53-56% of the mid-age women and 37-40% of the older women agreed to participate in the longitudinal study.
The project has retained a very high proportion of the original participants. In 1998, 91% of the 13,716 mid-age women who responded to Survey 1 also responded to Survey 2, and 84% responded to Survey 3 in 2001 and Survey 4 in 2004. Almost three quarters (72%, N=9,861) of the women in this cohort have responded to all four surveys, and a further 13% have completed three and 9% have completed two of the four surveys. The major reasons for non-response were that the research team was unable to contact the women (6%, 7% and 8% of eligible women at Survey 1, Survey 2 and Survey 3 respectively) and non-return of questionnaires by women who could be contacted (2%, 8% and 7% of eligible women at Survey 2, Survey 3 and Survey 4). The women who could not be contacted were more likely to be separated, divorced or widowed. Change of name and address, and failure to register these with the electoral commission, makes the tracking of these women difficult. Comparisons with Census data from 1996 and 2001 show that the mid-age respondents at Survey 1 (1996) and Survey 3 (2001) were broadly representative of the general population of women of the same age, but that there was some over-representation of women with tertiary education and under-representation of immigrant women of non-English speaking background and of women who were separated or divorced at both surveys.
Of the 12,432 older women who responded to Survey 1, 90% responded to Survey 2 in 1999, 85% to Survey 3 in 2002, and 84% to Survey 4 in 2005. Fifty four percent of the older women have completed all four surveys, 17% have completed three surveys and a further 16% have completed two. In this cohort, the major reason for non-response was non-return of the questionnaire (4% of eligible women at Survey 2 and 8% at Survey 3). These and other non-respondent women tended to report poorer self-rated health at Survey 1 than respondents to subsequent surveys, and, not unexpectedly in this age group, discontinuation was commonly due to death or frailty. Comparisons of the demographic characteristics of the older respondents at Survey 1 (1996) and Survey 3 (2002) with those of women of the same age in the Census in 1996 and in 2001 showed few differences. There was some under-representation of women from non-English speaking countries in the ALSWH sample at both surveys. The high level of missing data in the Census makes comparisons difficult for marital status and educational qualifications.
For this report, data are from the mid-age cohort at M1 (1996), M2 (1998), M3 (2001) and M4 (2004) and from the older cohort at O1 (1996), O2 (1999), O3 (2002) and O4 (2005).
Area of residence
Throughout this report, area of residence is classified according to the Rural, Remote and Metropolitan Areas classification scheme (Department of Human Services and Health, 1994). The classification uses postcode to derive seven categories (two metropolitan, three rural and two remote areas) that are based primarily on population numbers and an index of remoteness. All prevalence and incidence estimates in this report are weighted to correct for the intentional over-sampling of women from rural and remote areas.
Measurement of physical activity
Women in all three cohorts have answered questions about physical activity in all surveys. At Survey 1 in 1996, the questions used were those developed by the National Heart Foundation for the National Risk Factor Prevalence Surveys in 1980, 1983, and 1989 (National Heart Foundation, 1989). The two questions asked how many times in a normal week women engaged in vigorous exercise (eg aerobics, jogging) or less vigorous exercise (eg walking, swimming) lasting for 20 minutes or more. Responses were used to derive a physical activity score based on frequency of participation in vigorous (7.5 METs) and less viorous (4 METs) physical activity lasting at least 20 minutes. [PA score=∑{frequency * 20mins * 4 (less vigorous) + frequency * 20mins * 7.5 (vigorous)}]. MET.mins are units of energy expenditure – 600 MET.mins is equivalent to 150 minutes of moderate intensity (4 METs) physical activity per week (Brown, Mishra, Lee, & Bauman, 2000).
For all surveys since the first in 1996, physical activity has been assessed using questions based on those developed for the evaluation of the national Active Australia campaign in 1997, and for national monitoring of physical activity in Australia (Armstrong, Bauman, & Davies, 2000). The questions ask about the frequency and total duration of walking (for recreation or transport), and of vigorous (eg aerobics, jogging) and moderate intensity activity (eg swimming, golf) in the last week. The items used in all surveys since 1999 have been shown to have acceptable reliability and validity for population measurement of physical activity (Bauman & Merom, 2002; Brown, Trost, Bauman, Mummery, & Owen, 2004). (Note that the physical activity data from the second survey of the mid-age women are not directly comparable with those of subsequent surveys because gardening was included as an example of moderate activity; this may have inflated the estimates of activity in that survey). For all the analyses reported here, a physical activity score was derived from reported duration of time spent in each form of physical activity during the last week [∑ {(walking mins * 3.0) + (moderate mins * 4.0) + (vigorous mins * 7.5)} MET.mins] (Brown & Bauman, 2000). As the distribution of physical activity data is heavily skewed, continuous data are presented as medians and inter-quartile ranges (IQR).
Prevalence and Patterns of Physical Activity
The National Physical Activity Guidelines suggest that, for health benefit, all Australians should accumulate at least 30 minutes of at least moderate intensity physical activity on most, if not all, days of the week (Commonwealth Department of Health and Aged Care, 1999). The ALSWH researchers use a cut-off of 600 MET.mins per week (30 minutes * 5 sessions * 4 METs) to define whether women are active – that is, whether they are accumulating sufficient physical activity for health benefit. Data from Survey 1 are not included in this section as different physical activity questions were asked in Survey 1.
The proportions of mid-age and older women in each of five physical activity categories (none: < 40; very low: 40 - <300; low: 300 - <600; moderate: 600 - < 1200; hih: ~ 1200 MET.mins/week) are shown for Surveys 2, 3 and 4 in Figure 3.2.
In the mid-age cohort, the proportions categorised as being moderate and high active (ie those meeting or exceeding the National Physical Activity Guidelines, defined here as active) increased markedly from M3 (moderate 20.3%; high 24.5%) to M4 (moderate 22.8%; high 31.4%), while the proportions in the none, very low, and low categories (defined here as inactive) decreased. The overall prevalence of being active increased by 9.4% (from 44.8% to 54.2%) between these two surveys.
This remarkable increase in physical activity among the mid-age cohort between Survey 3 and Survey 4 resulted in the proportion categorised as active in this cohort at Survey 4 (in 2004 when they were 53–58 years old) being the same (54.2%) as that reported at Y3 for the younger cohort (54.6%) in 2003 when they were 25–31 years old. These data counter the much cited statistic that population levels of physical activity decline with age (Armstrong, et al., 2000). This increase was underpinned by increases in walking, which were observed in this cohort between M2 (1998) and M3 (2001) and continued at M4 (2004). The increase in walking is consistent for women living in urban areas, large and small rural centres and in other rural and remote locations, and probably reflects either an age or cohort effect of changing life circumstances of the mid-age women, which may be allowing some of them more time to walk (see below for further discussion of this point).
Among the older cohort there were increases in the proportions of women reporting no activity from O2 (3 1.3%) to O3 (39.7%) and from O3 to O4, so that by O4, 44.4% of this cohort were in this sedentary category. There was also a marked decrease in the proportion in the low activity group between O2 (20.9%) and O3 (12.1%). The prevalence of being active in this group was fairly constant between O2 (33.8%) and O3 (33%), but fell by 3% between O3 and O4 (29.9%).
While these data suggest that overall levels of physical activity in this cohort are declining, it was apparent that most of those who managed to remain active from O2 to O4 were still reporting similar amounts of time in physical activity in consecutive surveys. The overall decline was attributable to the increasing numbers of women in this cohort who were in the none category at O3 and O4. As the older women were aged 79-84 years at O4, it would not be surprising to find that increasing health problems underpin this decline (see below for further discussion of this point).
Figure 3.2: Proportions of women in each physical activity category in subsequent surveys at M2 (N=11,226), M3 (N=10,671), and M4 (N=10,163); and at O2 (N=9,123), O3 (N=8,052) and O4 (N=6,523).
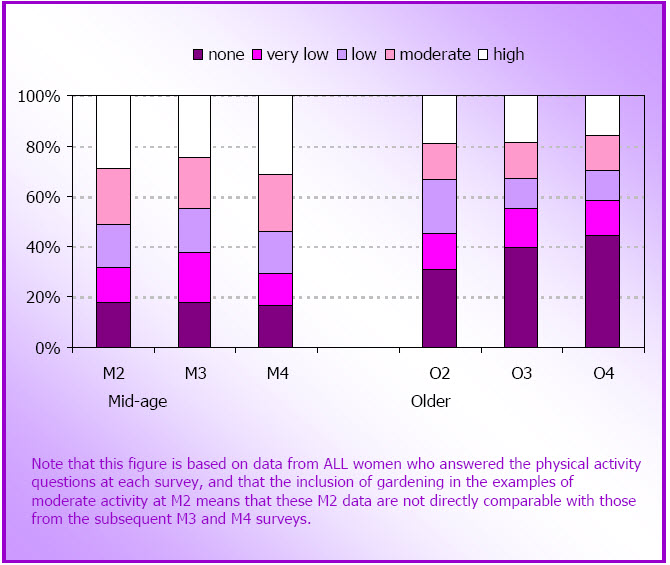
Patterns of physical activity
At M3 and M4, and at O2 and O3, the contributions of walking, moderate and vigorous activity to total physical activity differed slightly for each cohort. For the mid-age cohort the most common pattern of activity at M3 was only walking, (reported by 43.5%), with a smaller proportion reporting a combination of all three types of activity (35.5%). Few women reported only moderate (3.4%) or vigorous (1.4%) activity. Those who reported a combination of walking and other activities reported higher total physical activity time [M3 median 300 (180-480)] than those who reported only walking [M3 median 120 (60-240)], or only moderate (M3 median 120 (60-240)] or vigorous activity [M3 median 135 (70-240)]. Almost 16% of the mid-age women reported no walking, moderate or vigorous activity, but half of these did report some activity associated with house and yard work. Data on house and yard work are not included in these physical activity estimates because there are questions about the intensity of these activities (Brown, Trost, Ringuet, & Jenkins, 2001) and about the reliability of the time estimates that are reported (Ainsworth, 2000)
At M4 the proportions of mid-age women reporting each activity pattern (walking only 42.6%; mixed' activities 38%; moderate only 3.2%; vigorous only 0.9%) were essentially unchanged, but the median total activity time reported by women who only walked and by those who reported mixed activities increased by a median of 60 minutes per week [walking only: M3 median 120 (60-240); M4 median 180 (90-300); mixed: M3 median 300 (180-480); M4 median 360 (230-570)]. This is consistent with the overall increase in walking reported below.
Among the older women the most common pattern of physical activity was also only walking, with almost 40% reporting only walking at O2 [median time 120 (60-240) mins per week], while 21.2% reported mixed activities [median time 360 (25-595) mins]. Once again, women in this mixed group reported notably higher levels of physical activity. Almost 10% reported doing only moderate [8.6%, median time 240 (120-465) mins] or only vigorous [0.8%, median time 120 (60-180) mins] activities. In this older cohort 29.5% reported no activity in response to the walking, moderate and vigorous activity questions, and 60% of these women reported no house or yard work either. At O3, the proportion of older women reporting no activity increased to 37.3%, but for those women who continued to be active, activity times remained largely unchanged from O2.
Physical activity and paid and unpaid work
Median values for physical activity (MET.mins/week) by occupation categories are shown in Figure 3.3. These cross-sectional data were from the M4 survey in which women were asked to indicate their main occupation in terms of the Australian Standard Classification of Occupations (Australian Bureau of Statistics, 1986). There was a wide range of physical activity levels within each occupation group; the lowest median physical activity level was reported by women who identified as intermediate production or transport workers (category 7, which includes occupations such as machine operators and bus drivers). However, although strikingly low, this estimate was based on data from only 63 women.
The next lowest levels of physical activity were reported by women in the labourer or related worker category (category 9, includes cleaner, factory worker, kitchen hands, etc), followed by women in the advanced clerical or servicecategory (category 5, includes personal assistants, flight attendants) and those in the intermediate clerical, sales or service category (category 6, includes data entry operators, child care workers, hospitality workers etc) (see Figure 3.3).
Median values for physical activity (METmins/week) by hours of paid work are shown in Figure 3.4. The most active women were those who reported 1-24 hours of paid work per week.
Figure 3.3: Box plots for physical activity by occupation category (M4 data; N=9241).
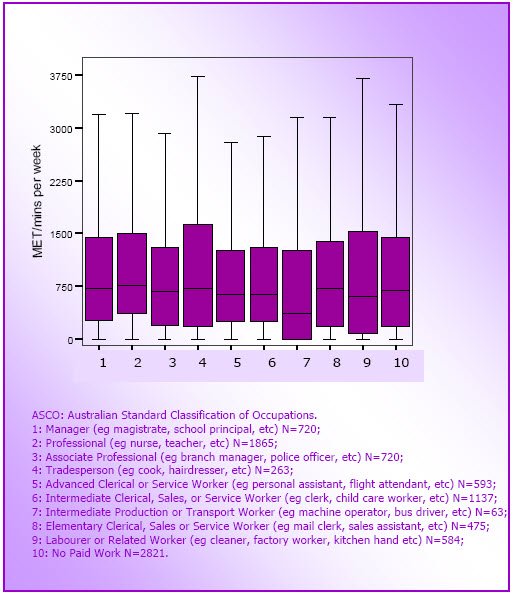
Figure 3.4: Box plots for physical activity by hours of paid work (M4 data; N=10,041).
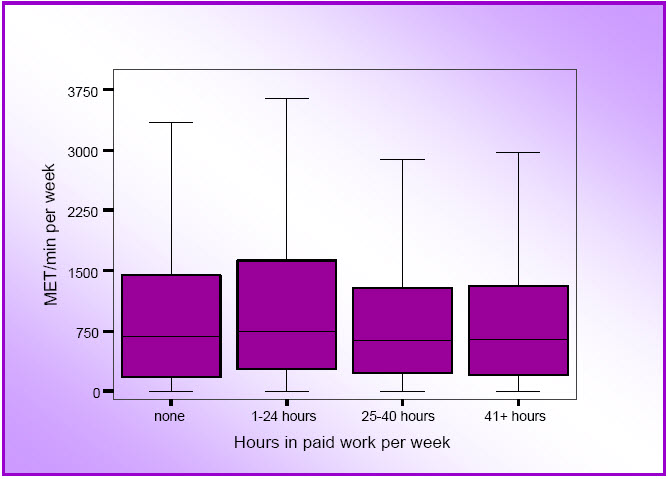
Trends in Physical Activity Over Time
In this section, changes over time are based only on data from women who answered the physical activity questions in two consecutive surveys: M3 and M4 for the mid-age cohort (N=9,167) and O2 and O3 (N=7,137) for the older cohort. As the physical activity questions asked in these surveys were identical, the data allow for exploration of changes in physical activity over time in the same subgroups of women at each survey.
As these women were more likely to be categorised as active at baseline than those women who did not answer the physical activity questions at all surveys, and those who did not continue responding to the surveys, it is likely that estimated levels of physical activity based on these data are greater than the true population levels.
Median values for total MET.mins of physical activity at M3 and M4 and at O2 and O3 are shown in Figure 3.4. It can be seen that physical activity levels were higher in the mid-age women in 2001, than in the older women in 1999 [M3 (2001): median 540 (Inter-quartile range, IQR, 135-1170]; O2 (1999): median 360 (IQR 0-1025)]. These data confirm previous cross-sectional findings of decreasing physical activity with increasing age (Armstrong et al., 2000).
However, rather than declining with age, among the mid-age women, physical activity increased in the three years between M3 and M4 [M4 median 720 (IQR 210-1440)]. In contrast, among the older women, median total MET.mins decreased in the three years between O2 and O3 [O3 median 210 (IQR 0-900)]. These overall patterns of increasing physical activity in the mid-age cohort and declining physical activity in the older cohort were largely consistent across geographic areas.
Figure 3.5: Median and inter-quartile ranges for physical activity in the mid-age cohort at M3 (2001) and M4 (2004) (N=9,167) and in the older cohort at O2 (1999) and O3 (2002) (N=7,134).
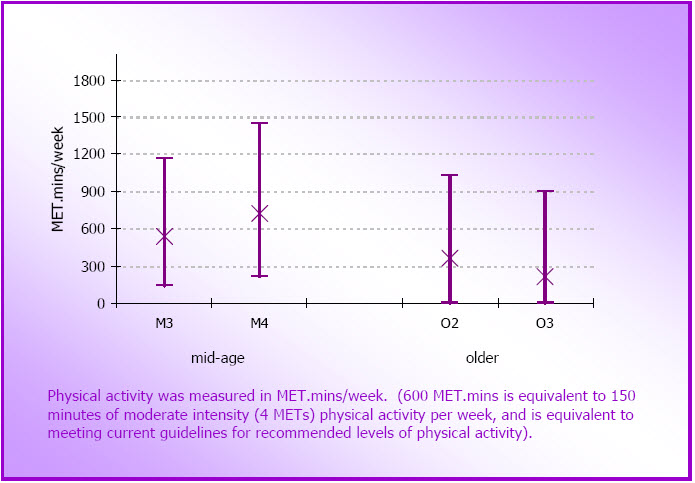
Trends in walking over time
Walking was reported by a large proportion of women in both cohorts, either as the sole form of physical activity, or in combination with other activity types. As such, it is useful to consider walking patterns in isolation from the more generalised physical activity score. Median times for walking at Surveys 2, 3 and 4 are shown in Figure 3.6. Data from M2 are included here for the mid-age women as they are unaffected by the different wording of the moderate activity question in that survey. In the mid-age cohort (N=8,693) there is a clear increase in time spent walking at each survey [M2 median 60 (0-150); M3 median 90 (25-200); M4 median 120 (30-240) mins].
In contrast, in the older cohort (N=5,611), walking time decreased, so that by O4 the median walking time was zero [O2 median 60 (0-180); O3 median 30 (0-150) mins, O4 median 0 (0-120)]. This was attributable to a decrease in the number of older women reporting any walking, rather than a decrease in time spent walking among those who continued to walk. When these walking data were considered by location, it was clear that the increase in walking in the mid-age cohort and the decrease in walking in the older cohort were seen consistently across areas of residence.
Figure 3.6: Median and inter-quartile ranges for time spent walking in the mid-age women (at M2, M3 and M4; N =8,693) and the older women (at O2, O3 and O4; N=5,611).
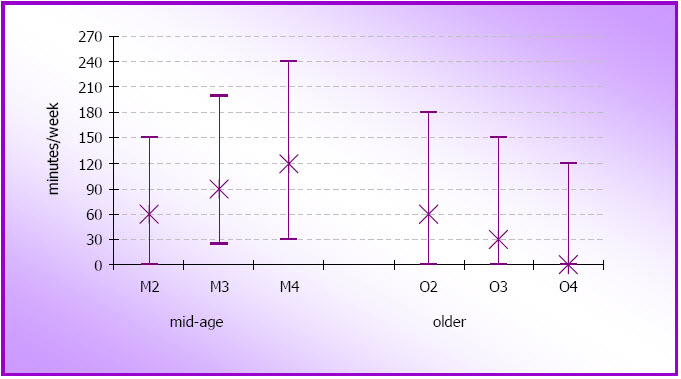
Changes in physical activity categories over time
Mosaic plots to show changes in physical activity categories for the mid-age (M3 to M4) and older (O2 to O3) women are shown in Figure 3.7. For simplification, the very low and low categories (see page 54) have been combined to form one low category and the moderate and high categories have been combined to form a single active category.
Between M3 and M4, just over half (56%) the mid-age women remained in the same physical activity category (mid-coloured bars in the mosaic plot in Figure 3.7), while almost one in five (17.6%) moved into a lower physical activity category (lighter bars), and more than one in four (26.4%) moved into a higher category (darker bars). These data are commensurate with the overall increase in physical activity in the mid-age group reported above (see Figure 3.7).
However, only about one third of the women were categorised as active at both times (ie meeting guidelines). This is in contrast with the point prevalence estimates of the proportions of women categorised as active at M3 (44.8%) and M4 (54.2%). About 15% of the mid-age women remained in the low category (ie they reported some activity, but insufficient to meet the guidelines) and only 7% remained in the none category, at both surveys (see Table 3.1).
The mosaic plot showing changes in physical activity categories for the older women from O2 to O3 is markedly different from that of the mid-age women (see Figure 3.7). Although a similar proportion (to that seen in the mid-age cohort, 56%) remained in the same category at both O2 and O3 (57.3%, mid-coloured bars in Figure 3.7), 26.1% of the older women moved into a lower category (lighter bars), while 16.6% moved into a higher category (darker bars). Note that these proportions are almost exactly opposite to those reported for the mid-age women, and are consistent with an overall decline in physical activity in this cohort between these two surveys.
In contrast with the point prevalence estimates from O2 (33.8%) and O3 (33.0%), the proportion of older women who were consistently active (ie meeting guidelines) at these two surveys was only 23.1%. The proportion in the low activity category at both surveys (13.0%) was similar to that seen in the mid-age cohort (15.5%). More than one fifth (21.2%) of this older cohort remained in the none category at O2 and O3 (see Table 3.2).
| Cross-sectional estimates based on data from all women at each survey | Prospective data from the same women at each survey | ||
|---|---|---|---|
| M3 N=10,671 % |
M4 N=10,163 % |
M3/M4 N=9,167 % |
|
| Active | 44.8 | 54.2 | 33.5 |
| Low active | 37.1 | 29.4 | 15.5 |
| Sedentary (none) |
18.1 | 16.4 | 7.0 |
| Increasers | - | - | 26.4 |
| Decreasers | - | - | 17.6 |
| Cross-sectional estimates based on data from all women at each survey | Prospective data from the same women at each survey | ||
|---|---|---|---|
| O2 N=9,123 % |
O3 N=8,052 % |
O2/O4 N=7,137 % |
|
| Active | 33.8 | 33.0 | 23.1 |
| Low active | 35.0 | 27.3 | 13.0 |
| Sedentary (none) |
31.3 | 39.7 | 21.2 |
| Increasers | - | - | 16.7 |
| Decreasers | - | - | 26.0 |
Figure 3.7: Changes in physical activity in the mid-age (N=9,167) and older (N=7,137) cohorts.
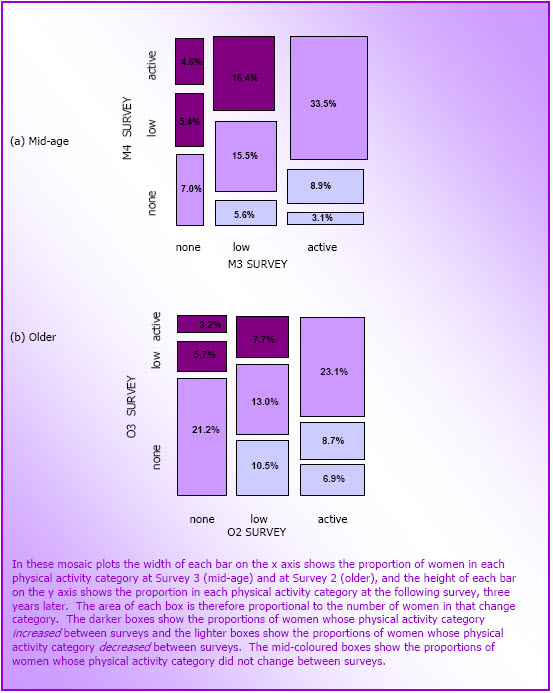
Factors Associated with Physical Activity Changes Over Time
Mid-age women
Analyses were conducted to see whether demographic characteristics (eg area of residence, education, country of birth, marital status, income, hours in paid work), other health behaviours (eg smoking, alcohol use), weight variables (eg body mass index and weight change) and indicators of illness (number of chronic health problems), stress (number of life events experienced) and caring responsibilities (for children under 16 years or for a person with a long tem illness, disability or frailty) were associated with changes in physical activity category in the mid-age cohort.
A summary of the results of logistic regression analyses using data from women who were active at both M3 and M4, and from women whose physical activity category increased or decreased between these two surveys are shown in Table 3.3. Area of residence, country of birth and marital status were not associated with changes in physical activity in any of the analyses.
The analyses found that women who were categorised as active at both surveys (ie those in the active category at the top right of the mosaic plot in Figure 3.7, N=3,058) were more likely than those in the none category at both these surveys (at the bottom left of the mosaic plot, N =642) to have at least high school education, to have household income of at least $500 per week, to work up to 34 hours per week in paid work, to have experienced at least three stressful life events, and to provide care for someone with a long-term illness, disability or frailty. They were less likely to care for children under 16 years, to be current smokers, non-drinkers or high-risk drinkers, and to report two or more chronic health problems. In relation to weight, women in this group were less likely to be underweight, overweight or obese, and less likely to be in any of the weight gain categories, than the sedentary women (see Table 3.3).
| Active-Active N=3,058 |
Increasers N=2,414 |
Decreasers N=1,607 |
|
|---|---|---|---|
| Education (higher) | +++ | +++ | ―― |
| Income (higher) | + | ++ | ns |
| Paid work (1-34 hours) |
++ | + | ns |
| Smoking | ――― | ――― | +++ |
| Alcohol | ――― | ―― | + |
| Body mass index (obese) |
――― | ―― | +++ |
| Weight gain | ― | ― | +++ |
| Stressful life events | + | + | ns |
| Provide care (child under 16 years) |
― | ns | ns |
| Provide care (adult) | + | + | ns |
| Number of chronic health problems |
――― | ― | ++ |
| +++ or ――― ++ or ―― + or ― ns |
p <0.001 p <0.01 p <0.05 not significant |
Women whose physical activity increased between M3 and M4 (ie those depicted by the darker rectangles of the mosaic plot in Figure 3.7; N=2,414) had similar characteristics to those in the consistently active category, in that they were more likely than the women who remained sedentary to have at least high-school education, to be in a higher income bracket, to work up to 34 hours per week in paid work, to have experienced at least four stressful life events, and to provide care for someone with a long-term health problem. As was the case for the consistently active women, the increasers were less likely than women who remained sedentary to be smokers or non-drinkers, to have two or three chronic conditions, to be underweight, overweight or obese, or to be weight gainers (see Table 3.3).
Women whose physical activity decreased between M3 and M4 (ie those included in the lighter bars of the mosaic plot in Figure 3.7; N=1,607) were characterised by significant associations with six of the variables shown in Table 3.3. Compared with women who were active at both surveys, the women whose physical activity category decreased were less likely to have completed high school. They were more likely to be current smokers and non-drinkers, to be obese, to be weight gainers (low or moderate) and to report three chronic conditions (see Table 3.3).
Older women
Analyses were also conducted to see whether demographic characteristics (eg area of residence, education, country of birth, marital status, ability to manage on income), other health behaviours (eg smoking, alcohol use), weight variables (eg body mass index and weight change), and indicators of illness (number of chronic health problems) and caring responsibilities (for a person with a long tem illness, disability or frailty) were associated with changes in physical activity category in the older cohort. In general, more of these variables were associated with the physical activity change categories in the older women than in the mid-age group. The results of multivariate analyses are summarised in Table 3.4.
The women who were categorised as active at O2 and O3 (ie top right hand box of the mosaic plot in Figure 3.7, N=1651) were characterised by significant positive associations with four variables, and significant negative associations with seven variables. Compared with women who remained sedentary, they were more likely to have at least high school education, to have been born outside Australia in an English-speaking country, to be widowed, and to report that managing on their income was easy. They were less likely to live in an other rural or remote area, to be current or former smokers, to be non-drinkers, and to have caring responsibilities. In terms of weight change, the women who were active at both surveys were less likely than those who remained sedentary to be weight losers, moderate or high weight gainers, or overweight or obese; they were also less likely to report any chronic health problems (see Table 3.4).
Women whose physical activity increased from O2 to O3 (ie those in the dark boxes in the mosaic plots in Figure 3.7, N=1,189) were similar to those who were consistently active in several respects. They were more likely than the women who were consistently sedentary to have had a high school education, to have been born outside Australia, and to be single (separated, divorced, never married or widowed). They were also less likely to be current smokers, non-drinkers, to have caring responsibilities and to report two or more chronic conditions. In relation to weight, they were less likely to be in the weight loser or moderate weight gainers categories and less likely to have a body mass index in the overweight or obese categories (see Table 3.4).
As was the case for the mid-age women, fewer factors were associated with the decreasing physical activity category between O2 and O3. The women whose physical activity category decreased (ie those included in the lighter bars in the mosaic plot in Figure 3.7, N=1,857), were more likely than the women who were consistently active to be smokers and non-drinkers and to report two or more chronic conditions. They were also more likely to be in the weight loser or high gainer category and to have a body mass index in the obese range (see Table 3.4).
| Active-Active N=1,651 |
Increasers N=1,189 |
Decreasers N=1,857 |
|
|---|---|---|---|
| Education (higher) | +++ | +++ | ns |
| Area of residence (rural/remote) |
― | ns | ns |
| Country of birth (other English) |
++ | + | ns |
| Marital status (widowed/single) |
++ | ++ | ns |
| Manage on income | + | ns | ns |
| Smoking | ――― | ―― | + |
| Alcohol | ――― | ――― | + |
| Overweight/obese | ――― | ――― | +++ |
| Weight gain | ――― | ――― | ++ |
| Provide care (adult) (yes) |
― | ―― | ns |
| Number of chronic health problems |
――― | ――― | +++ |
| +++ or ――― ++ or ―― + or ― ns |
p <0.001 p <0.01 p <0.05 not significant |
Associations Between Life Events and Changes in Physical Activity
Analyses were conducted to assess whether any of the life events reported by women were associated with changes in physical activity between M3 and M4. The complete list of life events included in the analyses for the mid-age women (and the proportion of women who reported each one) was:
- birth of a grandchild (43.8%);
- going through menopause (20.8%);
- major decline in health of other close family member or friend (20.5%);
- major decline in health of spouse or partner (9.2%);
- major personal illness (10.6%); major personal injury or surgery (5%);
- major surgery (not including dental work) (10.9%);
- major personal achievement (11.9%);
- starting a new personal relationship (6%);
- infidelity of spouse /partner (4.8%);
- break up of close personal relationship (7.3%); divorce (5.2%);
- major conflict with children (8.3%); child/others leaving home (15%);
- death of spouse or partner (2.1%); death of a child (2.2%);
- death of close family member (21.3%) or friend (14.5%);
- changing hours/conditions type of work (15.4%);
- retirement (9.2%); spouse/partner retiring (9.6%);
- spouse/partner made redundant (7.3%); decreased income (18.1%);
- moving house (15.8%);
- natural disaster or house fire (4.7%); major loss/damage to property (3.4%):
- being robbed (7%); legal troubles or court case (7.1%);
- being pushed, grabbed, shoved etc (3.4%); forced into unwanted sex (2.6%);
- arrest or jail of family member or close friend (3.4%);
- self or family member involved with problem gambling (4.7%).
Only four of these life events were significantly associated with changes in physical activity. After adjustment for area of residence, age, education, country of birth, income and weight change in each model, the odds of increasing physical activity (ie being in any of categories depicted by the darker bars in Figure 3.7), compared with maintaining physical activity at current levels (ie being in the mid-coloured bars in Figure 3.7) were significantly higher for women who reported:
- a major personal achievement (OR=1.19; 95% CI -1.01,1.39);
- death of spouse (OR=1.61; 95% CI 1.13, 2.31); or
- retirement (OR=1.29; 95% CI 1.08, 1.53)
than for women who did not report these events.
The only life event that was significantly associated with decreasing physical activity was
- infidelity of spouse or partner (OR=0.57, 95% CI 0.40-0.80)
Women who reported this were less likely to decrease their physical activity category than those who did not.
Older women
Analysis of associations between life events and changes in physical activity were also conducted for the older women. Life events included in these analyses (and the proportion of women who reported each one) were
- major personal illness or injury (11.2%);
- major surgery (not including dental work) (11.4%);
- major decline in health of spouse or partner (9.3%);
- major decline in health of other close family member or friend (14.1%);
- death of spouse or partner (7.4%);
- death of a child (1.9%);
- death of other close family member or friend (15.1%);
- decreased income (5.1%);
- moving house (8.3%);
- being robbed (2.7%);
- moving into an institution (1.1%); and
- spouse or partner moving into an institution (1.1%).
Few of these life events were associated with changes in physical activity. Not surprisingly, after adjustment for area of residence, age, education, country of birth, income source, and weight change in each model, the odds of decreasing physical activity (ie being included in the lighter bars in the mosaic plots in Figure 3.7) compared with maintaining current level of physical activity (ie being included in the mid-coloured bars in the mosaic plots in Figure 3.7) were greater in women who
- reported a major personal illness or injury (OR= 1.66; 95% CI: 1.41, 1.96) and in
- women who reported major surgery (OR=1.33; 1.13, 1.58)
than in women who did not report these events.
No life event was significantly associated with increases in physical activity; there was however a trend for women who reported death of their spouse or partner to have higher odds for being in this category [OR= 1.24 (0.98, 1.56); p=0.076]. As there was also a tendency for death of spouse/partner to be associated with less likelihood of decreasing physical activity (OR=0.83; 95% CI: 0.67-1.04; p=0.11), we conclude that this life event is an important correlate of changing physical activity levels in older women, and may reflect the increased discretionary time available to women after the death of their partner, especially if they had had a significant caring role (Byles, Feldman, & Dobson, 2006).
Discussion
Overall, these data suggest that, while notable proportions of women in both cohorts changed their physical activity category over consecutive surveys, on a population basis, overall levels of physical activity are increasing in mid-age women at this age (early fifties) and decreasing in older women (in their late seventies). In both cohorts, demographic characteristics (eg education, income) and health variables (eg smoking, drinking, chronic illness) were associated with the physical activity change categories. Women who were consistently active over two surveys, or who became active, tended not to be smokers, but reported drinking safe amounts of alcohol. They also worked part-time and had fewer chronic health problems than consistently sedentary women. This is important, because in the older cohort major illness and surgery were the main factors associated with decreasing physical activity. These results underscore the importance of preventing chronic illness in the middle-years by maintaining a healthy lifestyle which includes physical activity.
Interestingly, providing care or assistance to someone with a long-term illness, disability or frailty was associated with being or becoming active in the mid-age cohort, but the active older women were less likely to be a carer for someone with these problems. It is unclear why the active mid-age women were more likely to report these caring duties, but previous analyses of data from the mid-age ALSWH cohort have shown complex relationships between caring and hours in paid work, and it is possible that women who reduce their hours of paid work in order to cope with caring duties may then have more time for physical activity. Analyses of the complex time course relationships between changes in caring, hours of paid work and physical activity are ongoing. In light of the increasing numbers of older people in the population, keeping mid-age women sufficiently fit and healthy (through physical activity) for potential increased caring roles may be another reason why governments should invest more in promoting physical activity to this population group.
Finally, marital status was not associated with physical activity in the mid-age women, but in the older cohort, not being married and being single were associated with remaining or becoming active. In the life events analyses, death of spouse or partner was associated with increasing activity in both the mid-age and older women. Previous analyses of the ALSWH data have shown that, in younger adult women, getting married is associated with decreasing levels of physical activity (Brown & Trost, 2003).
This finding, and the finding that marriage was the most significant predictor of time spent in paid and unpaid work in 1991 (Bittman, 1991), suggest that at least some of the time pressures faced by women who try to fit physical activity into their day are caused by their increased contribution to unpaid tasks in the household, which are attributable to having a spouse. However, more recent data from the HILDA survey (Headey, Warren, & Harding, 2006) suggest that, while women still do the majority of housework, the total hours that men and women spend in paid and unpaid (household) work is very similar (about 60 hours a week) when couples are in full-time employment. However, women in part-time paid work (20 hours per week on average) report spending more than twice as much time in household tasks (19.1 hours per week) as men who work comparable part-time hours (7.4 hours per week in household work). In the ALSWH survey women who report 1-34 hours of paid work appear to find more time for physical activity, perhaps reflecting the more flexible nature of their paid and unpaid working roles.
Part D
Relationships Between Physical Activity and Selected Health Outcomes in Australian Mid-age and Older Women
- Introduction
- Does Physical Activity Protect Against Menopausal Symptoms in Mid-Age Women?
- Does Physical Activity Protect Against Stiff or Painful Joints and Arthritis in Mid-Age and Older Women?
- Does Physical Activity Protect Against Anxiety and Depression in Older Women?
- Does Physical Activity Protect Against Memory Problems in Older Women?
- Does Physical Activity Protect Against Falls and Fractures in Older Women?
- Is There a Relationship Between Physical Activity and General Physical and Psychological Well-Being in Mid-Age and Older Women?
- Is There any Relationship Between Physical Activity and Healthcare Costs in Mid-Age and Older Women?
- Discussion
Introduction
Part one of this report provided an update of the epidemiological evidence relating to physical activity and the primary prevention of six health problems which have been identified as national health priorities for Australia ie cardiovascular disease, diabetes, cancer, mental health, musculoskeletal health (osteoarthritis) and injury (falls). The limited evidence on relationships between physical activity and reproductive health was also reviewed.
In a report for the Australian Government Department of Health and Ageing in March 2006, we confirmed some of the associations between physical activity and these health outcomes in the mid-age and older cohorts of the Australian Longitudinal Study on Women's Health. For example, among the mid-age and older women, the prevalence of hypertension and both prevalence and incidence of heart disease were statistically significantly higher among mid-age and older women who reported low levels of physical activity, compared with those who reported at least the moderate level of physical activity which is commensurate with meeting the physical activity guidelines (ie 30 minutes on most days each week). Similarly, the prevalence of diabetes, osteoporosis, and arthritis were significantly higher among women who reported little or no physical activity, compared with those achieving at least moderate levels. This was particularly true for the older cohort, presumably because the numbers of mid-age women reporting these health problems is, as yet, too small to demonstrate significant associations with physical activity.
In contrast, the numbers of women reporting symptoms and conditions that are indicative of the development of some of the health problems reviewed in Part One has been relatively high, ever since the first survey in 1996. Therefore, for the final part of this report, prospective associations between physical activity and the reporting of selected symptoms and conditions are examined and discussed. The symptoms were selected on the basis of their potential to build on the information presented in Part One of this report, and to contribute to our understanding of the wider health benefits of physical activity. The selected symptoms/conditions and their related national health priority areas are:
- menopausal symptoms in mid-age women (women's reproductive health)1
- stiff or painful joints and arthritis in mid-age and older women (musculoskeletal health)
- anxiety and depression in older women (mental health)
- memory problems in older women (ageing, cognitive decline)
- falls and fractures in older women (injury).
The report concludes with data on the relationships between physical activity and general physical and mental well-being, as measured by the SF36 (which provides indicators of eight dimensions of health and well-being, including: physical functioning; the role of physical functioning in performance of work and daily activities; bodily pain; general health; vitality; social functioning; the role of emotional problems on work and other daily activities; and mental health) and on the relationships between physical activity and health service use and costs, in both the mid-age and older women.
Does Physical Activity Protect Against Menopausal Symptoms in Mid-Age Women?
For mid-age women, going through menopause is an important transition, which can be accompanied by many health problems and decreased quality of life (McVeigh, 2005; Utian, 2005). At this time, women typically complain about three types of symptoms; vasomotor symptoms (hot flushes and night sweats), somatic symptoms (such as joint pain and headaches), and psychological symptoms (such as mood and sleep disturbances) (Greene, 1998). These symptoms may begin 5 to 10 years before cessation of the menstrual cycle, and may last 10-20 years after menopause (Berg, Gottwall, Hammar, & Lindgren, 1988).
There is conflicting evidence about the role of physical activity in ameliorating menopausal symptoms, with some intervention studies showing some positive results (Kemmler, Lauber, Weineck, Hensen, Kalender, & Engelke, 2004; Slaven & Lee, 1997) and others showing no effects of physical activity (Aielle, Yutaka, Tworoger, Ulrich, Irwin, Bowen, et al., 2004). The relationship between physical activity and menopausal symptoms is therefore equivocal, and may be different for vasomotor symptoms, somatic symptoms or psychological symptoms (Greene, 1998). The Australian Longitudinal Study on Women’s Health presents an opportunity to track changes in these menopausal symptoms in women who are at different stages of the menopause transition, and to see whether physical activity ameliorates any of the common vasomotor, somatic or psychological symptoms in menopause.
The aim of this analysis was to assess the relationship between changes in physical activity (M3 to M4) and self-reported vasomotor, somatic and psychological symptoms at M4. Data were excluded from the analyses if the women reported difficulty walking 100 meters, if they had a menopausal score of 14 or above at S2, if menopause had been induced (due to hysterectomy or oopherectomy) or was unable to be classified at any survey, if they were taking antidepressants or oral contraceptives, if they were taking hormone replacement therapy at S2, and if they did not answer the physical activity questions at S2, S3, or S4.
Responses to questions about the frequency of hot flushes, night sweats, depression, severe tiredness, stiff or painful joints, headaches/migraines, and feeling nervous were used to create a menopausal symptoms score (ranging from 0 to 21), with sub-scores for vasomotor symptoms (hot flushes and night sweats; range 0 to 6), somatic symptoms (stiff or painful joints and headaches/migraines; range 0 to 6), and psychological symptoms (depression, severe tiredness and nervousness; range 0 to 9).
Menopausal status was defined for M3 and M4 on the basis of self-report of menstrual bleeding: no menstrual bleeding in the last 12 months (post-menopause); menstrual bleeding in the last 12 months, but not in the last 3 months or with different menstrual frequency compared with the previous year (peri-menopause); and menstrual bleeding in the last 3 months and in the last 12 months and with the same frequency as in the previous year (pre-menopause) (Dudley, Hopper, Taffe, Guthrie, Burger, & Dennerstein, 1998). Five menopause transition categories were defined: pre-menopause at both times (pre–pre); transition from pre-menopause to peri-menopause (pre–peri); peri-menopause at both times (peri–peri); transition from pre- or peri-menopause to post-menopause (pre/peri–post); and postmenopause at both times (post–post).
Menopausal symptoms at M4, by each menopause transition category (M3 to M4) and by physical activity category at M3 are shown for 3,330 women in Figure 4.1. Women who were undergoing the menopause transition (eg pre-peri, peri-peri, pre/peri-post) and women who were postmenopausal had higher scores than women who remained pre-menopausal. This was particularly true for the vasomotor symptoms. Total menopausal symptoms score was slightly higher in sedentary women, which was mainly due to a higher reporting of psychological symptoms in this group compared with the more active women (see Figure 4.1).
The relationship between changes in physical activity (M3 to M4) and menopausal symptoms at M4 was examined using regression analyses, with adjustment for history of depression, highest educational qualification, area of residence, smoking status, body mass index, change in weight between surveys, and menopause transition category. Increases in physical activity were associated with a very small reduction in somatic symptoms [B=-0.003 (-0.005, -0.001)]. In other words, an increase in moderate physical activity of one hour per week was (240 MET.minutes) was associated with a reduction of less than one unit on the menopause score. It is unlikely that this finding would have any clinical significance.
Figure 4.1: Mean menopausal symptoms scores by menopause transition (M3 to M4) and physical activity categories at M3 (N=3,330).
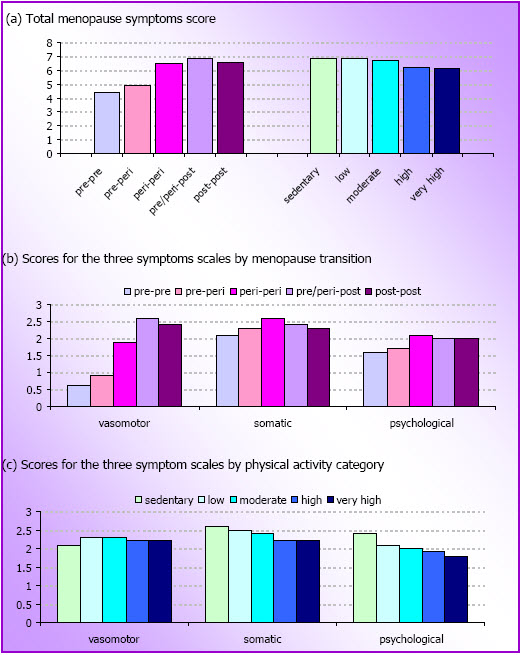
Changes in weight were more strongly associated with vasomotor and somatic symptoms, but not with psychological symptoms. Women who gained more than 5kg between surveys reported more vasomotor symptoms than women whose weight remained stable [(B=0.29 (95% CI=0.12, 0.47)]. Women who lost more than 5kg reported fewer vasomotor [(B=-0.34 (-0.55, -0.13)] and somatic [(B=-0.19 (-0.36, -0.02)] symptoms than women whose weight remained stable. Women with a history of depression were also more likely to report more somatic [(B=0.26 (0.11, 0.40)] and psychological symptoms [(B=0.56 (0.39, 0.74)] than women without a history of depression. A history of depression was not related to vasomotor symptoms.
In summary, changes in physical activity were not independently related to vasomotor symptoms or psychological symptoms. Somatic symptoms were marginally reduced by increases in physical activity, particularly in women who did not lose or gain more than 5kg. For women who lost or gained weight, the change in weight was strongly associated with a decreased frequency of vasomotor and somatic symptoms, respectively. For women who gained weight, this change was related to a higher frequency of vasomotor symptoms. The exact role of weight change on menopausal symptoms now merits further investigation, preferably in combination with objective physical activity measures.
Does Physical Activity Protect Against Stiff or Painful Joints and Arthritis in Mid-Age and Older Women?
Arthritis is a leading cause of pain and disability in Australia (Australian Institute of Health and Welfare, 2006), affecting 17% of the population (Access Economics, 2005). As is also the case in the United States, more Australian women than men have arthritis (Access Economics, 2005; Centers for Disease Control and Prevention, 1997), and the incidence and prevalence of arthritis increase with age (Centers for Disease Control and Prevention, 1997; Seavey, Kurata, & Cohen, 2003). Mid-age and older women are therefore, at particular risk.
In prospective population-based studies (Cheng, Macera, Davis, Ainsworth, Troped, & Blair, 2000; Felson, Zhang, Hannan, Naimark, Weissman, Aliabadi, & Levy, 1997; Hart, Doyle, & Spector, 1999; Seavey et al., 2004), physical activity has been identified as a potentially modifiable risk factor for arthritis, with results of several studies suggesting that moderate to vigorous leisure-time physical activity may be protective against the development of arthritis. However, the results are inconsistent, and there is some evidence that specific forms of vigorous physical activity (such as football) may contribute to the onset of arthritis, especially in men.
An association between physical activity and arthritis is physiologically plausible because moderate to vigorous physical activities reduce the risk of injury to joints by strengthening the muscles around them and by improving balance and joint mobility (Arthritis Foundation, 2005).
Participants in the mid-age and older cohorts of the ALSWH have been asked several times whether they have experienced stiff or painful joints (never, rarely, sometimes, or often) in the previous 12 months and to report whether they have been diagnosed with or treated for arthritis in the previous 3 years. There is therefore an opportunity to examine the prospective relationships between physical activity and both stiff or painful joints and the self-report of diagnosis with arthritis in both these cohorts.
These analyses used data from mid-age and older women who answered the M3 and M4 and O2 and O3 surveys, respectively. Data on physical activity and potential risk factors were from M3 and O2, and data on the two outcomes (stiff or painful joints often in the previous 12 months and self-reported diagnosis or treatment of arthritis in the previous 3 years) were from the following M4 and O3 surveys. After adjusting for the over-sampling of women in rural and remote areas, 23.9% of the mid-age women and 28.2% of the older women reported having stiff or painful joints often at M4 and O3 respectively. The prevalence of diagnosis or treatment for arthritis was 25.5% in the mid-age women at M4 and 43.1% in the older women at O3.
Separate multivariate logistic regression models were computed for the two cohorts and the two outcomes. In the analysis of stiff or painful joints2 data from 4780 mid-age and 3970 older women were used, and the analyses were adjusted for education, area of residence, country of birth, depression, number of chronic conditions, smoking status, and body mass index. Data from participants who reported stiff or painful joints sometimes or often at the first survey (M3: 47.8% of the mid-age women; O2: 45.1% of the older women), or who had missing physical activity data at that survey, were excluded.
In the analysis of arthritis, data from 7,217 mid-age and 4,165 older women were used, and the analyses were adjusted for income management, area of residence, depression, number of stressful life events, number of chronic conditions, smoking status, alcohol status, and body mass index. Data from participants who reported treatment or diagnosis of arthritis at the first survey (M3: 22.0% of the mid-age women; O2: 41.8% of the older women), or who had missing physical activity data at that survey, were excluded.
The results are shown in Figure 4.2. In the mid-age women, physical activity was not protective against arthritis symptoms or arthritis. However, in the older cohort, low, moderate and high physical activity protected against the onset of stiff or painful joints (low OR=0.72, 95% CI=0.55, 0.97; moderate OR=0.54, 95% CI=0.39, 0.76; high OR=0.61, 95% CI=0.46, 0.82). High physical activity was also protective against the onset of arthritis in this three year period (OR=0.74, 95% CI=0.59, 0.92) (See Figure 4.2).
These results indicate that physical activity is not protective against the onset of arthritis symptoms or arthritis in mid-age women, at least over this 3-year period when they were 50-55 and 53-58 years old. However, among the older women, low, moderate and high levels of physical activity (equivalent to 75+ minutes of moderate-intensity physical activity each week) were found to be protective against the onset of symptoms that precede and accompany arthritis in older women. Higher levels of physical activity (the equivalent of 300+ min of moderate-intensity physical activity each week) were protective against the onset of arthritis, in the three year period between O2 and O3, when the women were aged between 73-78 and 76-81 years.
These results suggest that even low levels of physical activity are independently protective against arthritis symptoms but high levels are required to protect against arthritis in older women. This protection is not seen in mid-age women.
The analyses of the stiff and painful joints data are now published. For more details see Heesch, Miller, Brown (2007).
Figure 4.2: Odds ratios (and 95% CI) for associations between physical activity at M3/O2 and often having (a) stiff or painful joints (mid-age N=4,780; older N=3,970) and (b) arthritis (mid-age, N=7,217; older, N=4,165) at M4 and O3 respectively.
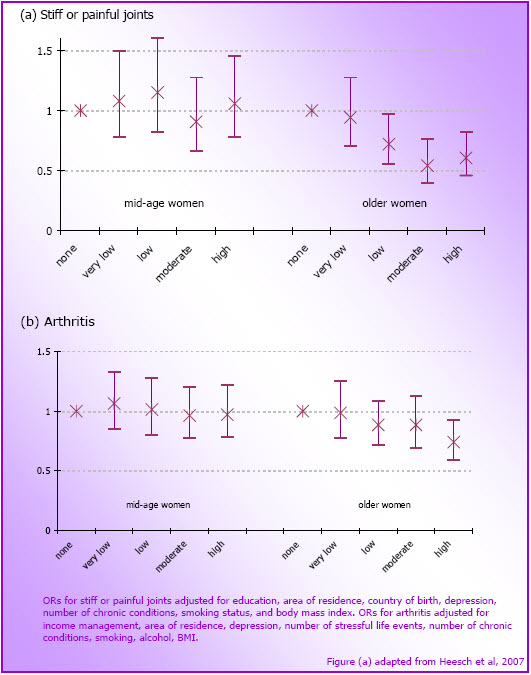
- The analyses of the stiff and painful joints data are now published. For more details see Heersch, Miller, Brown (2007)
Does Physical Activity Protect Against Anxiety and Depression in Older Women?
As indicated in Part One of this report, both cross-sectional and prospective studies suggest that physical inactivity may be positively associated with symptoms of depression (Brown, Ford, Burton, Marshall, & Dobson, 2005; Dunn, Trivedi, & O’Neal, 2001; Fox, 1999; Paulska & Schwenk, 2000). Much of the research in this area is however limited by small clinical samples with relatively short follow-up, and the results of the prospective studies are somewhat mixed. Very few studies have examined relationships between physical activity and anxiety. The inclusion of the Goldberg Anxiety and Depression scale in the ALSWH provides an opportunity to examine prospectively the dose-response relationship between physical activity and symptoms of depression and anxiety in older women.
For these analyses, the data were from the 4,228 older women who completed surveys O1, O2 and O3. Data from women who reported diagnosis or treatment for depression within the 3 years prior to the 1999 (O2) survey, those unable to walk 100 meters in 1999 and those with missing values on any factor were excluded. O2 data on physical activity, and on most other potential risk factors for anxiety and depression (eg BMI, alcohol use, smoking status, marital status, having a chronic health condition, and number of adverse life events) were included in the analyses. Education, measured at O1, was also included.
The outcome measure was depression and anxiety as measured by the Goldberg Anxiety and Depression Scale (GADS) at O3. The scale items have yes/no responses, and the total score is the sum of 18 items, with higher values indicating more symptoms. Physical activity was categorized as shown earlier in this report [eg none (< 40 MET.mins/week); very low (40-<300); low (300-<600); moderate (600-<1200); and high (1200+)].
The analyses showed that women who were in any physical activity category above none at O2 had significantly lower GADS scores at O3 than those in the none category. Women who completed high school or had post-school education had lower scores on the GADS (p<.05), and being married, obese, or a former smoker, having a chronic condition, or reporting at least one adverse life event were associated with higher GADS scores (p<.05). Mean GADS score for each of the physical activity categories, adjusted for these confounding variables and alcohol intake, are shown in Figure 4.3.
This figure shows that after adjusting for other health-related behaviours and demographic characteristics, any level of physical activity greater than none was protective against the onset of anxiety and depression in this three year period. This result suggests that older women in their 70s can decrease their risk of developing depression and anxiety over a three year period by participating in very low levels of physical activity. The greatest reduction in risk was observed among women who reported high levels of physical activity, equivalent to 300+ minutes of moderate physical activity each week.
Figure 4.3: Mean (SE) GADS scores at O3 for women in each physical activity category at O2 (N =4,228).
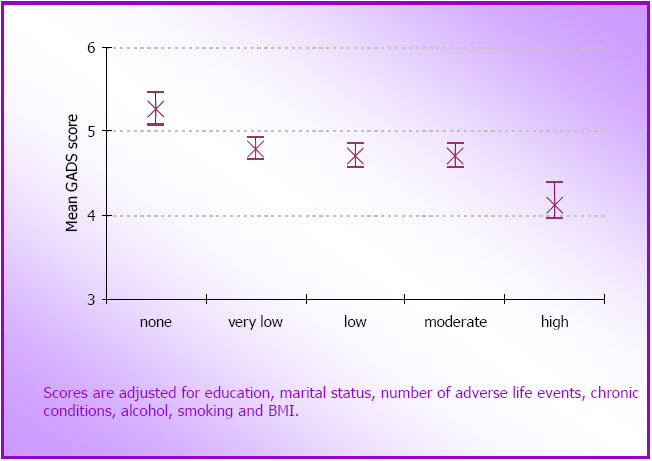
Does Physical Activity Protect Against Memory Problems in Older Women?
While hair loss, hearing loss, and poor eyesight are considered normal components of ageing, cognitive decline is more often associated with clinical conditions such as dementia and Alzheimer’s Disease. Some degree of cognitive decline is, however, a normal, non-clinical, part of ageing. Despite this, even non-clinical cognitive decline may impact on the capabilities required for independent living. Loss of independence is distressing for older adults, and represents an increased emotional and financial burden on families and society at large. An understanding of how to maintain or improve cognitive functioning in late adulthood is therefore important for enhancing the well-being of older adults.
There is emerging evidence from cohort studies to suggest that physical activity may be protective against the onset of dementia. In a study of approximately 2000 men and women aged over 65 years, with no existing diagnosis of dementia, Larson et al (2006) have shown that the risk of developing dementia is 0.6 (95% CI 0.41 – 0.92, p<.05) in those who report exercising three times per week, compared with those who are less active, over an average follow-up period of 6 years. Similarly, when objective measures of physical function were used, better performance on a timed walking test was associated with a lower risk of dementia (HR=0.79, 95% CI 0.70 - 0.89, p<.001) over the 6 years (Wang, Larson, Bowen, & van Belle, 2006).
Although the ALSWH does not include measures of cognitive decline, it is notable that more than one third of the mid-age women have reported having poor memory sometimes or often at the last two surveys (M3: 34.9%; M4: 36.5%). In the older cohort the proportion of women reporting poor memory increased from 33.9% of those who answered this question at O3 to 50.6% at O4. This is consistent with estimates from the general population which show that up to 60% of older adults complain of memory problems, and there is some evidence to suggest that these may be associated with psychological and other health problems, with objective measures of cognitive functioning and, in some cases, to be predictive of future dementia (Jonker, Geerlings, & Schmand, 2000; St John & Montgomery, 2003; Comijs, Deeg, Dik, Twisk, & Jonker, 2002; Johansson, Allen-Burge, & Zarit, 1997; Jorm, Butterworth, Anstey, Christensen, Easteal, Maller et al., 2004; Jungwirth, Fischerm Weissgram, Kirchmeyr, Bauer & Tragl, 2004; Levy-Cushman & Abeles, 1998; Riedel-Heller, Matschinger, Schork, & Angermeyer, 1999).
At O3 and O4, memory complaints in the older women were assessed in more detail using the Memory Complaint Questionnaire (MAC-Q; Crook, Feher, & Larrabee, 1992). The MAC-Q is a six-item scale of self-reported memory decline in which participants compare current memory ability with past performance for given situations (eg remembering the name of a person just introduced to you). Scores on this scale range from 7 to 35, and higher scores are considered to reflect perceived cognitive decline.
Although no previous studies have explored relationships between physical activity and memory complaints, in light of the emerging evidence on the relationships between physical activity and dementia, we examined these relationships using data from O3.
For the following analyses women who reported diagnosed psychological or neurological conditions, or the use of psychological or neurological medications were excluded, because these conditions and medications are known to be detrimental to memory and cognitive functioning. Data from women with complete responses to the physical activity items at O2 and O3 and to the memory items at O3 were included.
Among older women who had no psychological or neurological conditions, there was a cross-sectional association between physical activity and scores on the MAC-Q at O3 (F(4, 4284)=2.94; p<.05). Although significant, the differences between categories of physical activity were only slight (see Table 4.1).
Subsequent analyses showed that both physical activity levels and scores on the MAC-Q were associated with optimism, mental health, health-related hardiness, and indicators of heart disease. Higher scores on measures of optimism, mental health, and hardiness were associated with higher levels of physical activity and reduced reporting of memory complaints. Use of heart medications was associated with low levels of physical activity and high levels of perceived memory problems.
Variables that were associated at the univariate level with both physical activity and scores on the MAC-Q were included in a logistic regression model. The model indicated a significant relationship between physical activity and MAC-Q scores, with women in the highest physical activity category about 25% less likely to have high MAC-Q scores (which was defined as MAC-Q >29). However, when heart medications, health-related hardiness, and mental health were added to the model, the relationship between high physical activity and memory complaints was no longer significant (see Table 4.2).
| Physical Activity Category | MET.mins/week | N | Mean MACQ score (Standard Error) |
|---|---|---|---|
| Sedentary | <40 | 1446 | 25.42 (.11) |
| Low | 40 – 299 | 647 | 25.58 (.16) |
| Sufficient | 300 – 599 | 568 | 25.58 (.17) |
| High | 600 – 1199 | 708 | 25.36 (.15) |
| Very High | >1200 | 920 | 24.98 (.13) |
| Unadjusted | Adjusted(a) | |||
|---|---|---|---|---|
| OR | 95% CI | OR | 95% CI | |
| Physical Activity | ||||
| < 40 MET mins | 1 | 1 | ||
| > 40 and <300 | 0.99 | 0.78 – 1.24 | 1.03 | 0.81 – 1.32 |
| > 300 and <600 | 1.09 | 0.86 – 1.38 | 1.26 | 0.98 – 1.61 |
| > 600 and <1200 | 0.92 | 0.73 – 1.15 | 1.10 | 0.87 – 1.39 |
| > 1200 | 0.76 | 0.61 - 0.94 | 0.93 | 0.74 – 1.16 |
| Heart Medications | 0.86 | 0.70 – 1.06 | ||
| Hardiness | 0.96 | 0.94 – 0.97 | ||
| Mental Health | 0.98 | 0.97 - 0.98 | ||
| Bold indicates significant association. a Odds ratios in the second model were adjusted for all variables in the model. |
||||
Although these cross-sectional analyses support an association between physical activity and memory complaints as measured by the MAC-Q, the data suggest that memory complaints were significantly less likely only among the most active women (ie those reporting an hour a day or more of moderate intensity physical activity). The relationship does however appear to be mediated by health-related hardiness and overall mental health, both of which are higher in the most physically active women. This is consistent with previous findings of an association between health and memory complaints.
It is important to note, however, that the differences in MACQ scores between the active and sedentary women were very small and that this may limit the extent to which we can consider these differences to be meaningful in the lives of older women.
Does Physical Activity Protect Against Falls and Fractures in Older Women?
Falls are the leading cause of injury-related death and hospitalisation for people aged over 65 years (Bell, Talbot-Stern, & Hennessy, 2000; Lilley et al., 1995; Lord, Sherrington, & Menz, 2001) and can lead to placement in residential care (Donald & Bulpitt, 1999; Sattin et al., 1990; Tinetti & Williams, 1997). They may also have psychosocial consequences, such as decreases in self-esteem, daily activity and social interaction, that result in isolation and loneliness (Lilley et al., 1995). Previous studies suggest that up to 49% of community-dwelling women aged 65 years and over will experience at least one fall over a 12-month period (Hill et al., 1999) and many of these will result in injury, including fracture (Tinetti, 2003).
The role of physical activity in reducing falls remains controversial (Karlsson, 2004). Although there is strong evidence to suggest that physical activity can reduce falls risk, through improvement of strength and balance and through other physiological and psychological benefits (Latham, Anderson, Bennett, & Stretton, 2003; Gillespie et al., 2006; Sherrington, Lord, & Finch, 2004), there is some concern that physical activity may increase the risk of falls in vulnerable older people (Faber, Bosscher, Chin, & van Wieringen, 2006). For example, it has been reported that older people who engage in vigorous activity have a lower falls rate but have a higher risk of injuring themselves if they do fall (Speechley & Tinetti, 1991).
The Australian Longitudinal Study on Women's Health (ALSWH) provides an opportunity to examine prospective relationships between physical activity and increased risk of falls and broken or fractured bones over a period of six years between O1 and O3. As it is one of few cohort studies which include community-dwelling older women, it is now in a position to shed more light on the relationships between physical activity and falls and fractures in a non-clinical sample.
For these analyses the main outcome measures were self-report of a fall to the ground in last 12 months and self report of broken bone or fracture at O3, which were reported by 18% and 5% of the older women respectively. The main predictor variable was physical activity score at O1. Data from respondents who reported a serious fall with injury at O1 and those were unable to walk 100m unaided were excluded.
The results of these analyses are summarised in Figure 4.4. In the univariate model (Model 1), women in the high and very high physical activity categories had decreased odds of reporting a fall to the ground compared with those in the none/very low category (p<0.05). After adjustment for all statistically significant confounding variables, risk of falling was 36% lower in the women in the very high physical activity category (see Figure 4.4).
The analysis of relationships between physical activity at O1 and reporting a broken or fractured bone at O3 found that respondents in the high/very high physical activity category at baseline were less likely to report a broken bone in the six year follow-up period, than those in the none/very low category (p< 0.05). The strength and statistical significance of this association remained unchanged when the significant confounding variables were included in the model. In the adjusted model, risk of falling was 47% lower in the women in the high/very high physical activity category (p<0.05) (see Figure 4.5).
Our results support the findings from a number of prospective and case-control studies which have shown statistically significant reductions in hip fracture among mid-age and older women who were physically active compared with those who were sedentary (Feskanich et al., 2002; Gregg, Cauley, Seeley, Ensrud, & Bauer, 1998; Hundrup et al., 2005; Karlsson, 2002).
In summary, these findings indicate that high levels of physical activity are associated with reduced odds of falls and broken or fractured bones in older women who have not had a recent serious injury from a fall.
Figure 4.4: Unadjusted and adjusted odds ratios for reporting a fall to the ground at O3, by O1 physical activity categories (N=6,468).
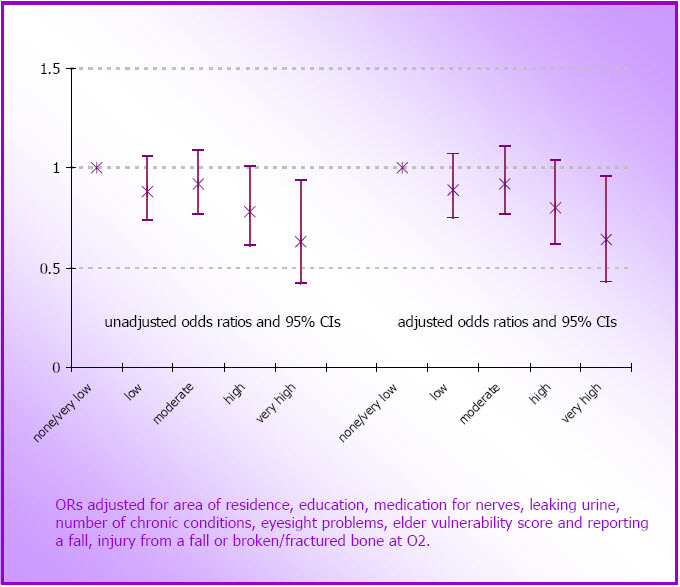
Figure 4.5: Unadjusted and adjusted odds ratios (and 95% confidence intervals) for reporting a broken or fractured bone at O3, by O1 physical activity categories (N=6,468).
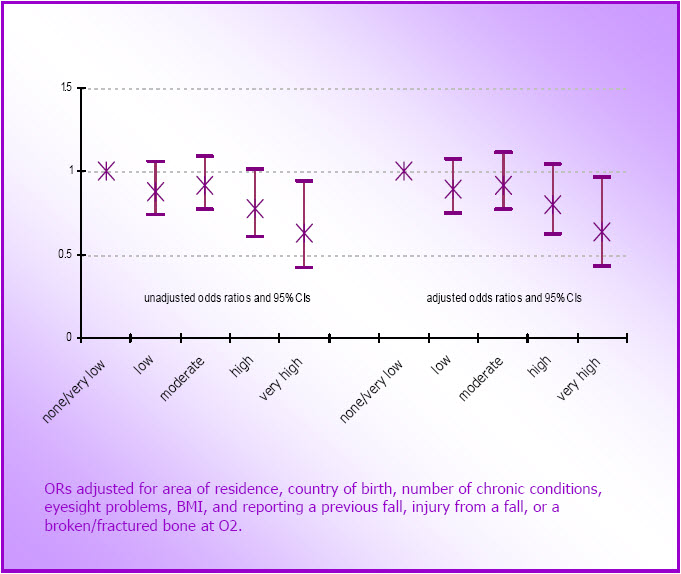
Is There a Relationship Between Physical Activity and General Physical and Psychological Well-Being in Mid-Age And Older Women?
Every survey of the ALSWH has included the Medical Outcomes Survey Short Form questionnaire (SF36) to determine women's overall levels of physical and mental health. Most of the questions focus on aspects of health and well-being in the four weeks prior to the survey. The SF36 has been widely adopted as a reliable and valid measure of health-related quality of life (Ware, Keller, et al., 1995). It provides indicators across eight dimensions of health and well-being including: physical functioning; the role of physical functioning in performance of work and daily activities; bodily pain; general health; vitality; social functioning; the role of emotional problems on work and other daily activities; and mental health. Two summary measures: the Physical Component Summary Score (PCS) and the Mental Component Summary Score (MCS) (which have demonstrated good discriminant validity in differentiating populations that vary in physical and mental health status: Ware, Kosinski, et al., 1995), are used in this section of the report.
In 2000 we reported on the cross-sectional relationship between physical activity scores and the PCS and MCS scores in all three cohorts. The data for the mid-age (N=9,729) and older women (N=7,984) are shown in Figure 4.6. Higher scores indicate better health. The means were adjusted for smoking status, alcohol consumption, body mass index, occupational status, menopausal status (for mid-age only), country of birth and area of residence (see Figure 4.6).
To overcome the limitations of these cross-sectional data, the new analyses reported here show the relationships between (a) changes in physical activity between M3 and M4 and mean PCS and MCS scores at M4 for the mid-age women, and between (b) changes in physical activity between O2 and O3 and mean PCS and MCS scores at O3 for the older women. The physical activity change categories were described in section 3.4 and relate to the mosaic plots in Figure 3.7.
Figure 4.6: Cross-sectional relationships between physical activity categories and SF36 PCS scores (left hand side) and MCS scores (right hand side) for (a) mid-age women at M1 (N=9,729) and (b) older women at O1 (N=7,984) in 1996 (mean and 95% CI).
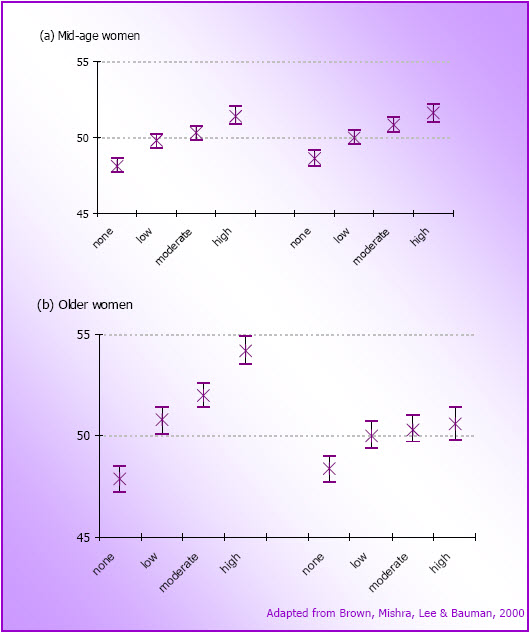
Mean PCS and MCS scores by physical activity change category in the mid-age (N=8,437) and older women (N=5,416) women are shown in Figure 4.7. All means are adjusted for BMI, smoking, alcohol, education, country of birth (at baseline or at O2 or M3) and for change in weight (kg) between time 1 and time 2 (between O2 and O3 and between M3 and M4) (see Figure 4.7).
The PCS and MCS scores differed significantly across physical activity change categories (p < .001). Among the three groups of women whose physical activity category did not change in the three year period (consistently sedentary, consistently low active and consistently active), PCS and MCS scores were significantly lower in women who were consistently sedentary than in those who were consistently active (see Figure 4.8). This was not surprising. However, mean PCS and MCS scores for women who were consistently low active (ie not meeting the guidelines of 30 minutes of moderate activity on most days each week) were not significantly different from those of the consistently active women. This finding confirms findings reported earlier in this report that low levels of physical activity (ie at a level lower than the current guidelines suggest) are associated with benefits in terms of health and well-being.
In both cohorts, and for both PCS and MCS, mean scores for the physical activity decreasers were not significantly different from those of the women in the consistently sedentary category. This finding supports the strong relationships (reported in Section 3.6 of this report) between physical activity change and serious illness or major surgery, especially in the older cohort.
Importantly, both mean PCS and mean MCS scores for women whose physical activity increased during these three year periods were as high for the women who remained consistently active. (This increasers group included women whose physical activity increased from none to low, as well as those who increased from the low to the active category; see Figure 3.7). These findings provide strong support for the notion that it is never too late to increase physical activity levels for improved health outcomes.
Figure 4.7: Mean (and 95% CI) PCS (left hand side) and MCS (right hand side) scores for each physical activity change category in (a) the mid-age women (M3 to M4; N=8,437) and (b) the older women (O2 to 03; N=5,416).
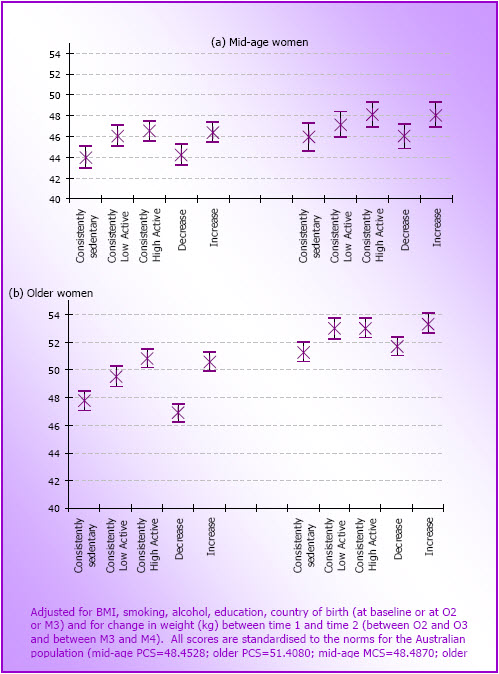
Is There any Relationship Between Physical Activity and Health Care Costs in Mid-Age and Older Women?
In 1999 physical inactivity was identified as the leading contributor to the overall burden of disease in Australian women, and second only to tobacco smoking in men (Mathers, Vos, & Stevenson, 1999). Indeed, inactivity is independently associated with many chronic health problems, as described in part one of this report, and exacerbates the metabolic, structural and functional declines of ageing (Singh, 2002). In 2002 the annual direct health care costs of inactivity-related health problems in Australia were conservatively estimated to be AUD 377 million per year (Stephenson, Bauman, Armstrong, Smith, & Bellew, 2000). In the US, health care costs have been shown to be inversely associated with physical activity, after adjustment for body mass index (Wang, McDonald, Reffott, & Edington, 2005), and it is estimated that individual health care costs are USD300 per year less in regularly active than in sedentary adults (Pratt, Macera, Wang, 2000).
The aim of the final analysis in this report was to quantify the relationships between physical activity and Medicare costs in the mid-age and older cohorts of the ALSWH, using data from M3 and O2.
Data from women who responded to either M3 (2001) or O2 (1999), and who gave permission for linkage to the Medicare data-base (see below) were included in these analyses. Data from women who reported being unable to walk 100m, with BMI<18.5, or with missing data for one or more of the weight, height, body mass index or physical activity variables, were excluded, leaving data from 7,004 mid-age and 5,161 older women in the analysis sample.
In Australia, the universal health insurance system, Medicare, covers all permanent residents, regardless of age or circumstances, for medical services including general practitioner (GP) and specialist consultations, pathology and radiology and limited additional primary health care services. Medicare provides a fixed rebate of 85% of the fee set by the government for services provided outof-hospital, or 75% for services provided in hospital for private patients. There is no legislation restricting the amount that doctors can charge for services.
All the women whose data are included in these analyses gave written consent for the release of Medicare claims data to the research team. Total costs for Medicare-subsidised health services were recorded for each woman; these cover costs to both the government (the rebate) and the additional charge paid by the patient. Pharmaceutical and hospital services are not covered by Medicare and were not available for inclusion in these analyses.
Mean annual costs of Medicare reimbursable services for women in each physical activity category were calculated (2001 costs were used for the mid-age women, and 1999 costs for the older women; see Figure 4.8). Although the older women made approximately 60% more claims than the mid-age women, costs were only about 30% more, because many older women were charged only the Medicare rebateable fee (ie the cost per service was lower than for the mid-age women). Fewer than 10% of the mid-age women and 2% of the older women did not visit a GP; and fewer than 5% and 1% respectively made no claims and therefore had no costs.
The greatest differences in costs were between the none and very low physical activity categories, indicating that even low levels of physical activity (less than meeting the national guidelines) are associated with lower health care costs. For the mid-age women mean costs were 26.3% ($134 per annum) higher in those in the none category than in moderately active women. For older women mean costs were 23.5% ($156 per annum) higher in the sedentary women.
The Medicare costs reported here (an average of $536 and $715 for the mid-age and older women respectively) include only the costs of visits to general practitioners, medical specialists and outpatient pathology and radiology services. As such, they represent only a fraction of total health care costs, which were estimated to be AUD 3,931 per person per annum in 2003/04 (Australian Institute of Health and Welfare, 2005). We did not have access to the costs of hospital services or pharmaceuticals, which make up the bulk of health care costs in Australia. Similarly, the costs reported here do not include the costs of work days lost due the chronic health problems that are associated with both inactivity and overweight.
Although it is not possible to directly compare the costs reported here with those reported in studies from other countries, it is possible to compare the relative differences reported for health care costs of people in different physical activity categories (26.3% more in sedentary than in moderately active mid-age women and 23.5% more for corresponding categories in older women). These percentage differences are similar to those reported by Pronk, Goodman, O'Connor, & Martinson (1999) for a sample of participants (40 years or older) in a Minnesota health plan. In that study each additional active day each week (defined as any activity reported that day) was associated with a 4.7% reduction in costs (ie a 23.5% reduction for those routinely active on 5 days each week), compared with those who reported no days of physical activity (Pronk et al., 1999). Another US study, which included all health care and pharmaceutical costs incurred by a large sample (N=196,000) of employees in the automotive industry, also found a 23.7% decrease in costs among those who reported brisk physical activity 3 times a week or more, compared with those who reported none, with an average per person difference in costs of USD 514 (Wang, McDonald, Champagne, & Edington, 2004). Estimates made by Pratt, Macera, & Wang (2000) using data from a national sample of US adults in 1987 were somewhat higher. They estimated that the mean net annual benefit of regular physical activity was USD 330 per person, or a reduction in costs of 32.4%.
Figure 4.8: Mean annual costs of Medicare rebateable health services by physical activity category for mid-age women in 2001 (pale bars, N=7,204; M3 survey) and older women in 1999 (darker bars, N=4161; O2 survey).
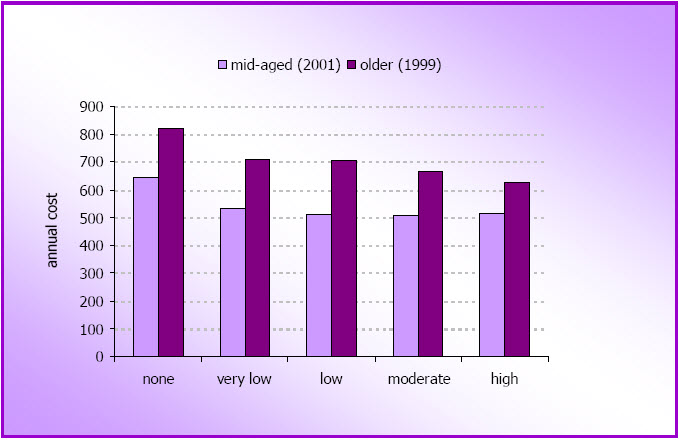
Additional analyses using these data found that the expected cost savings of activating the most sedentary women would be greater than those from reducing body mass index. The three-way relationships between physical activity, body mass index, and health service costs were interesting, as they showed that costs were not significantly increased in overweight (BMI 25 to <30) mid-age or older women who reported sufficient physical activity to meet the national guidelines, compared with healthy weight active women. Regardless of body mass index category, the highest costs were seen in the women who reported no physical activity.
On a population basis, it is clear from our findings that the greatest relative cost savings could accrue if sedentary women could improve both their physical activity and body mass index. However, in light of the fact that many women have difficulty changing their weight, and that there would be significant cost savings from increasing only physical activity (in sedentary women), our advice would be to encourage women to focus on increasing physical activity rather than only on losing weight. Significant benefits in terms of health care costs, both for women and for Medicare, may result if all women could achieve just 60-150 minutes of moderate intensity physical activity each week (our low category). In other words, sedentary women would have to walk briskly for 12-30 minutes on five days each week. Small changes in social support, as well as in workplace, transport and safety policies, would help these women to achieve this modest goal.
Discussion
These new data from the Australian Longitudinal Study on Women's Health add to the evidence which supports our understanding of the relationships between physical activity and specific health outcomes in mid-age and older women.
Our analyses did not show any relationships between physical activity and menopausal symptoms, or between physical activity and the development of new arthritis symptoms or arthritis in mid-age women. Previous findings have shown equivocal findings on the relationship between activity and both menopausal symptoms and the onset of arthritis in mid-age women.
However, among the older women, the findings confirm those reported in Part Two of this report, which suggest that levels of physical activity lower than those recommended in the current guidelines may be protective against the development of some health problems. For example, 75+ minutes of moderate-intensity physical activity/week was protective against the onset of stiff or painful joints and even lower levels of activity showed benefits in terms of lower anxiety and depression scores in the older women.
In contrast, over a three year period, higher levels of physical activity were protective against the onset of arthritis, and were associated with reduced risk of falls and of broken or fractured bones in older women who had not had a recent adverse life event or previous serious fall injury. We were not able to confirm the Framingham finding of increased risk of arthritis with higher levels of physical activity in the older women (Felsen et al, 1997).
These data confirm the hypothesis raised in Section 2 of this report, that the 'dose' of physical activity required for the primary prevention of health problems in mid- and older-age women, may not be the same for every health problem.
Overall, our findings showed that general physical and psychological well-being were significantly higher in mid-age and older women who were consistently active (ie meeting guidelines) than in those who were consistently sedentary. This is not surprising. Mean scores for physical and mental wellbeing were, however, also significantly higher in mid-age and older women who were consistently 'low' active (ie reporting 75-150 minutes a week) than in those who were consistently sedentary, suggesting that, for mid-age and older women, there may be benefits even from low levels of physical activity. In other words, doing something is better than doing nothing.
Another unexpected finding was that levels of physical and mental well-being were as high among women whose physical activity increased over time (from any baseline level), as they were among the women who were consistently active. This indicates that, for mid-age and older women, it is never too late to increase physical activity in order to gain health benefit.
The ALSWH data were also used to show, for the first time in Australia, that physical activity is inversely associated with healthcare costs in both mid-age and older women. In both the mid-age and older cohorts health care costs were increased by about one quarter in the sedentary women. As the greatest differences were seen between sedentary women and those doing low levels of activity, it is hypothesised that there could be significant cost savings for both women and the health care system if all sedentary mid-age and older women could be persuaded to do as little as 75 minutes of moderate intensity physical activity each week.
References
Access Economics. Arthritis - The Bottom Line: The Economic Impact of Arthritis in Australia. Sydney, Arthritis Australia, 2005.
Aiello EJ, Yutaka Y, Tworoger SS, Ulrich CM, Irwin ML, Bowen D, Schwartz RS, Kumai C, Potter JD, McTiernan A. Effect of a yearlong, moderate-intensity exercise intervention on the occurrence and severity of menopause symptoms in postmenopausal women. Menopause, 2004; 11: 283-288.
Ainsworth BE. Issues in the assessment of physical activity in women. Research Quarterly for Exercise & Sport, 2000; 71(2): 37-42.
Albrand G, Munoz F, Sornay-Rendu E, duBoeuf F, Delmas PD. Independent predictors of all osteoporosis-related fractures in healthy post menopausal women: the OFELY Study. Bone, 2003; 32: 78-85.
Anderson JP, Ross JA, Folsom AR. Anthropormetric variables, physical activity and incidence of ovarian cancer. The Iowa Women's Health Study. Cancer, 2004; 100: 1515-21.
Armstrong T, Bauman A, Davies J. Physical activity patterns of Australian adults. Results of the 1999 National physical activity survey. Canberra: Australian Institute of Health and Welfare, 2000.
Arthritis Foundation: Exercise and arthritis. Retrieved January 10, 2005, from www.arthritis.org/exercise-intro.php
Australian Bureau of Statistics. Australian standard classification of occupations (ASCO). Catalogue No. 122.0. Canberra: Australian Bureau of Statistics, 1986.
Australian Bureau of Statistics. Cancer in Australia: a Snapshot 2001.
Australian Institute of Health and Welfare: Health system expenditure on disease and injury in Australia, 2000-2001. AIHW Cat No HWE 26. 2004.
Australian Institute of Health and Welfare. Australia’s health 2004. Canberra: Australian Institute of Health and Welfare, 2004.
Australian Institute of Health and Welfare (AIHW). Health expenditure Australia 2003-4. AIHW Cat. No. HWE 32 (Health and Welfare Expenditure Series No. 25). Canberra: AIHW. 2005.
Australian Institute of Health and Welfare. Australia's health 2006. AIHW cat. No. 73. Canberra: AIHW, 2006.
Bailey D. Is anyone out there listening? Quest, 2000; 52: 344-50.
Batty GD. Physical activity and coronary heart disease in older adults. A systematic review of epidemiological studies. European Journal of Public Health, 2002; 12: 171-6.
Bauman, AE. Updating the evidence that physical activity is good for health: an epidemiologic review 2000-2003. Journal of Science and Medicine in Sport, 2004; 7(1): 6-19.
Bauman A, Merom D. Measurement and surveillance of physical activity in Australia - an introductory guide. Australasian Epidemiologist, 2002; 9(2): 2-6.
Bell AJ, Talbot-Stern JK, Hennessy A. Characteristics and outcomes of older patients presenting to the emergency department after a fall: a retrospective analysis. Medical Journal Australia, 2000, 173, 179-182.
Berg G, Gottwall T, Hammar M, Lindgren R. Climacteric symptoms among women aged 60–62 in Linköping,Sweden, in 1986. Maturitas, 1988; 10: 193–9.
Bertone ER, Willett WC, Rosner BA, Hunter DJ, Fuchs CS, Speizer FE, Colditz GA, Hankinson SE. Prospective study of recreational physical activity cancer and ovarian cancer. Journal of the National Cancer Institute, 2001; 93(12): 942-8.
Bittman M. Juggling time. How Australians families use time. Canberra: Commonwealth of Australia, 1991.
Blair SN, Connelly JC. How much physical activity should we do? The case for moderate amounts and intensities of physical activity. Research Quarterly for Exercise and Sport, 1996; 67(2): 193- 205.
Booth, M. L., Bauman, A., Owen, N., & Gore, C. J. (1997). Physical activity preferences, preferred sources of assistance, and perceived barriers to increased activity among physically inactive Australians. Preventive Medicine, 26(1), 13 1-137.
Brown WJ. The benefits of physical activity during pregnancy. Journal of Science & Medicine in Sport, 2002; 5(1): 37-45.
Brown WJ, Bryson L, Byles JE, Dobson AJ, Lee C, Mishra G, Schofield M. Women's Health Australia: recruitment for a national longitudinal cohort study. Women & Health, 1998; 28(1): 23- 40.
Brown WJ, Ford JH, Burton NW, Marshall AL, Dobson AJ. Prospective study of physical activity and depressive symptoms in middle-aged women. American Journal of Preventive Medicine, 2005; 29(4): 265-72.
Brown WJ, Mishra G Lee C & Bauman A. Leisure time physical activity in Australian women: relationship with well-being and symptoms. Research Quarterly for Exercise and Sport; 2000; 71 (3): 206-216.
Brown WJ, Trost SG. Life transitions and changing physical activity patterns in young women. American Journal of Preventive Medicine; 2003; 25(2): 140-143.
Brown WJ, Trost SG, Baumann A, Mummery K, Owen N. Test-retest reliability of four physical activity measures used in population surveys. Journal of Science & Medicine in Sport, 2004; 36:1181-6.
Brown WJ, Trost SG, Ringuet C, Jenkins D. (2001). Measurement of energy expenditure of daily tasks among mothers of young children. Journal of Science & Medicine in Sport; 4(4): 379-385.
Brown W, Williams J, Ford J, Ball K, Dobson A. Identifying the 'energy gap': magnitude and determinants of five year weight gain in mid-age women. Obesity Research, 2005; 13(8), 1431- 41.
Brukner P, Brown WJ. Is exercise good for you? Medical Journal of Australia, 2005; 183; 538-41.
Buring JE, Hennekens CH. The Women's Health Study: summary of the study design. Journal of Myocardial Ischaemia, 1992a, 4: 27-29.
Buring JE, Hennekens CH. The Women's Health Study: rationale and background. Journal of Myocardial Ischaemia, 1992b, 4: 30-40.
Byles J, Feldman S, Dobson A. The art of ageing as an older widowed woman in Australia. In S. Carmel, C. Morse, F. Torres-Gil (Eds.), Lessons on aging from three nations, Volume I: The art of aging well. Baywood Publishing Company, Inc: New York, 2006.
Camacho TC, Roberts RE, Lazarus NB, Kaplan GA, Cohen RD. Physical activity and depression: evidence from the Alameda County Study. American Journal of Epidemiology, 1991; 134: 220-3 1.
Centers for Disease Control and Prevention. Prevalence of arthritis--United States, 1997. MMWR, 2001, 50:334-336.
Chao A, Connell CJ, Jacobs EJ, McCullough ML, Patel AV, Calle EE, Cokkinides VE, Thun MJ. Amount, type, and timing of recreational physical activity in relation to colon and rectal cancer in older adults: the Cancer Prevention Study II Nutrition Cohort. Cancer Epidemiology, Biomarkers & Prevention, 2003; 13(12): 2187-95.
Chapurlat RD, Bauer DC, Nevitt M, Stone K, Cummings SR. Incidence and risk factors for a second hip fracture in elderly women. The Study of Osteoporotic Fractures. Osteoporosis International, 2003; 14: 130-6.
Cheung NW, Byth K. Population health significance of gestational diabetes. Diabetes Care, 2003; 27(7): 2005-9.
Cheng Y, Macera CA, Davis DR, Ainsworth BE, Troped PJ, Blair SN. Physical activity and self reported, physician diagnosed osteoarthritis: is physical activity a risk factor? Journal of Clinical Epidemiology, 2000; 53: 315-322.
Colditz GA, Cannuscio CC, Frazier AL. Physical activity and reduced risk of colon cancer: implications for prevention. Cancer Causes and Control, 1997; 8: 649-67.
Colditz GA, Hankinson SE. The nurses' health study: lifestyle and health among women. Nature Reviews Cancer, 2005; 5: 388-96.
Comijs HC, Deeg DJH, Dik MG, Twisk JWR, Jonker C. Memory complaints; the association with psycho-affective and health problems and the role of personality characteristics. A 6-year follow-up. Journal of Affective Disorders, 2002; 72: 157-165.
Commonwealth Department of Health and Aged Care. National physical activity guidelines for Australians. Canberra: Department of Health and Aged Care, 1999.
Critchley JA, Capewell S. Prospective cohort studies of coronary heart disease in the UK: a systematic review of past, present, and planned studies. Journal of Cardiovascular Risk, 2003; 10(3): 111-9.
Crook TH, Feher EP, Larrabee GJ. Assessment of memory complaint in age-associated memory impairment: The MAC-Q. International Psychogeriatrics, 1992; 4(2), 165-176.
Dempsey JC, Sorensen TK, Willaims MA, Lee IM, Miller RS, Dashow EE, Luthy DA. Prosepctive study of gestational diabetes mellitus risk in relation to maternal recreational physical activity before and during pregnancy. American Journal of Epidemiology, 2004; 159: 663-70.
Dennerstein L, Dudley E, Guthrie J, Barrett-Connor E. Life satisfaction, symptoms, and the menopausal transition. Medscape Women's Health, 2000; 5(4): E4.
Department of Human Services and Health. Rural, remote and metropolitan areas of classification 1991 Census edition. Canberra: Australian Government Publishing Service; 1994.
Donald IP, Bulpitt CJ. The prognosis of falls in elderly people living at home. Age Ageing, 1999; 28: 121-125.
Dorn JP, Cerny FJ, Epstein H, Naughton J, Vena JE, Winkelstein W, Schisterman E, Trevisan M. Work and leisure time physical activity and mortality in men and women from a general population sample. Annals of Epidemiology, 1999; 9: 366-73.
Dotevall A, Johansson S, Wihelmsen L, Rosengren A. Increased levels of triglycerides, BMI and blood pressure and low physical activity increase the risk of diabetes in Swedish women. A prospective 18 year follow up of the BEDA study. Diabetic Medicine, 2004; 21: 615-22.
Drinkwater BL. Exercise in the prevention of osteoporosis. Osteoporosis International, 1993; S169-171.
Dudley EC, Hopper JL, Taffe J, Guthrie JR, Burger HG, Dennerstein L. Using longitudinal data to define the perimenopause by menstrual cycle characteristics. Climacteric, 1998; 1: 18–25.
Dunn A, Trivedi M, O'Neal H. Physical activity dose-response effects on outcomes of depression and anxiety. Medicine and Science in Sports and Exercise, 2001; 33(6 Suppl), S587-597.
Dye TD, Knox KL, Artal R, Aubry RH, Wojtowycz MA. Physical activity, obesity, and diabetes in pregnancy. American Journal of Epidemiology, 1997; 146(11): 961-5.
Ellekjaer H, Holman J, Ellekjar E, Vatten L. Physical activity and stroke mortality in women: ten year follow up of the Nord-Trondelag Health Survey 1984-1986. Stroke, 2000; 31: 14-18.
Ekelund LG, Haskell WL, Johnson JL, Whaley FS, Criqui MH, & Sheps DS. Physical fitness as a predictor of cardiovascular mortality in asymptomatic North American men: The Lipid Research Clinics Mortality Follow-up Study. New England Journal of Medicine, 1988; 319: 1379-84.
Eyler AA, Matson-Koffman D, Vest JR, Evenson KR, Sanderson B, Thompson JL, et al. Environmental, policy, and cultural factors related to physical activity in a diverse sample of women: The Women's Cardiovascular Health Network Project - Summary and discussion. Women and Health, 2002; 36(2): 123-134.
Faber MJ, Bosscher RJ, Chin APM, van Wieringen PC. Effects of exercise programs on falls and mobility in frail and pre-frail older adults: A multicenter randomized controlled trial. Archives of Physical and Medical Rehabilitation, 2006; 87: 885-896.
Farmer, ME, Locke BZ, Moscicki EK, Dannenberg AL, Larson, DB, Radloff LS. Physical activity and depressive symptoms: the NHANES I epidemiologic follow-up Study. American Journal of Epidemiology, 1988; 128: 1340-1351.
Farrell SW, Braun L, Barlow CE, Cheng YJ, Blair SN. The relation of body mass index, cardiorespiratory fitness and all cause mortality in women. Obesity Research, 2002; 1096: 417-23.
Felson DT, Zhang Y, Hannan MT, Naimark A, Weissman B, Aliabadi P, Levy D. Risk factors for incident radiographic knee osteoarthritis in the elderly. The Framingham Study. Arthritis and Rheumatism, 1997; 40(4): 728-33.
Feskanich D, Willett WC, Colditz GA. Walking and leisure time physical activity and risk of hip fracture in post menopausal women. JAMA, 2002; 288(18): 2300-06.
Folsom AR, Arnett DK, Hutchison RG, Liao F, Clegg LX, Cooper LS. Physical activity and incidence of coronary heart disease in middle aged women and men. Medicine and Science in Sports and Exercise, 1997; 29(7): 901-9.
Folsom AR, Kushi LH, Hong CP. Physical activity and incident diabetes mellitus in post menopausal women. American Journal of Public Health, 2000; 90(1): 134-8.
Fox KR. Physical activity and mental health promotion: the natural partnership. International Journal of Mental Health Promotion, 2000; 2(1): 4-12.
Gillespie LD, Gillespie WJ, Robertson MC, Lamb SE, Cumming RG, Rowe BH. Interventions for preventing falls in elderly people. Cochrane Database SystematicReviews, 2006; CD000340.
Giovannucci E, Ascherio A, Rimm EB, Colditz GA, Stampfer M, & Willett WC. Physical activity, obesity, and risk for colon cancer and adenoma in men. Annals of Internal Medicine, 1995; 122: 327-34.
Golomb LM, Solidum AA, Warren MP. Primary dysmenorrheal and physical activity. Medicine and Science in Sports and Exercise, 1998; 30(6): 906-9.
Gregg EW, Cauley JA, Seeley DG, Ensrud KE, Bauer DC. Physical activity and osteoporotic fracture risk in older women. Annals of Internal Medicine, 1998; 129(2): 8 1-88.
Gregg EW, Cauley JA, Stone K, Thompson TJ, Bauer DC, Cummings SR, Ensrud KE, for the Study of Osteoporotic Fractures Research Group. Relationship of changes in physical activity and mortality among older women. JAMA, 2003; 289(18): 2379 – 2386.
Greene JG. Constructing a standard climacteric scale. Maturitas, 1998; 29: 25–31.
Guthrie JR, Dennerstein L, Taffe JR, Lehert P, Burger HG. Hot flushes during the menopause transition: a longitudinal study in Australian-born women. Menopause, 2003; 12(4): 460-7.
Haapanen N, Miilunpalo S, Vuori I, Oja P, Pasanen M. Association of leisure time physical activity with the risk of coronary heart disease, hypertension, and diabetes in middle aged men and women. International Journal of Epidemiology, 1997; 26(4): 739 – 47.
Haapanen-Niemi N, Miilunpalo S, Pasanen M, Vuori I, Oja P, Malmberg J. Body mass index, physical inactivity and low level of physical fitness as determinants of all cause and cardiovascular disease mortality – 16 year follow up of middle aged and elderly men and women. International Journal of Obesity, 2000; 24: 1465-1474.
Hardman AE. Issues of fractionalization of exercise (short vs long bouts). Medicine and Science in Sports and Exercise, 2001; 33(6 Suppl): S421-7.
Hart DJ, Doyle DV, Spector TD. Incidence and risk factors for radiographic knee osteoarthritis in middle aged women. Arthritis and Rheumatism, 1999; 42 (1): 17-24.
Hatch M, Levin B, Shu XO, Susser M. Maternal leisure time exercise and timely delivery. American Journal of Public Health, 1998, 88(10): 1528-33.
Headey B, Warren D, Harding G. Families, Incomes and Jobs: A Statistical Report of the HILDA Survey. Melbourne Institute if Applied Economic and Social Research, The University of Melbourne, 2006.
Hebert R, Lindsay J, Verreault R, Rockwood K, Hill G, DuBois M. Vascular dementia: Incidence and risk factors in the Canadian Study of Health and Aging. Stroke, 2000; 31(7): 1487-93.
Heesch KC, Miller YD, Brown, WJ. Relationship between physical activity and stiff or painful joints in mid-aged and older women: A 3 year prospective study. Arthritis Research & Therapy. 2007; 9: R34. http://arthritis-research.com/content/9/2/R34
Hill K, Schwarz J, Flicker L, Carroll S. Falls among healthy, community-dwelling, older women: a prospective study of frequency, circumstances, consequences and prediction accuracy. Australia and New Zealand Journal of Public Health, 1999; 23: 4 1-48.
Hootman JM, Macera CA, Helmick MD, Blair SN. Influence of physical activity related joint stress on the risk of self reported hip/knee osteoarthritis: a new method to quantify physical activity. Preventive Medicine, 2003; 36: 636-44.
Hsia J, Wu L, Allen C, Oberman A, Lawson WE, Torrens J, Safford M, Limacher MC, Howard BV, Women's Health Research Group. Physical activity and diabetes risk in post menopausal women. American Journal of Preventive Medicine, 2005; 28(1): 19-25.
Hu FB, Li TY, Colditz GA, Willett WC, Manson JE. Television watching and other sedentary behaviors in relation to risk of obesity and type 2 diabetes mellitus in women. JAMA, 2003; 289(14): 1785-91.
Hu FB, Sigal RJ, Rich-Edwards JW, Colditz GA, Solomon CG, Willett WC, Speizer FE, Manson JE. Walking compared with vigorous physical activity and risk of type 2 diabetes in women. JAMA, 1999; 282(15): 1433-39.
Hu FB, Stampfer MJ, Colditz GA, Ascherio A, Rexrode KM, Willett WC, Manson JE. Physical activity and risk stroke in women. JAMA, 2000; 283(22): 2961-7.
Hundrup YA, Ekholm O, Hoidrup, Davidsen M, Obel EB. Risk factors for hip fracture and a possible effect modification by hormone replacement therapy. The Danish Nurse Cohort Study. European Journal of Epidemiology, 2005; 20: 871-7.
Ivers RQ, Cumming RG, Mitchell P, Peduto AJ. Risk factors for fractures of the wrist, shoulder, and ankle: The Blue Mountains Eye Study. Osteoporosis International, 2002; 13: 513-8.
Jakicic JM, Marcus BH, Gallagher KI, Napolitano M, Lang W. Effect of exercise duration and intensity on weight loss in overweight, sedentary women: a randomized trial. JAMA, 2003; 290(10): 1323-30.
Jiang H, Ogden LG, Bazzano LA, Vupputuri S, Loria C, Whelton PK. Risk factors for congestive heart failure in US men and women: NHANES I epidemiologic follow up study. Archives of Internal Medicine, 2001; 161(7); 996-1002.
Johansson B, Allen-Burge R, Zarit SH. Self-reports on memory functioning in a longitudinal study of the oldest old: Relation to current, prospective, and retrospective performance. Journal of Gerontology: Psychological Sciences, 1997; 52B(3), P139-P146.
Jonker C, Geerlings MI, Schmand B. Are memory complaints predictive for dementia? A review of clinical and population-based studies. International Journal of Geriatric Psychiatry, 2000; 15: 983- 991.
Jorm AF, Butterworth P, Anstey KJ, Christensen H, Easteal S, Maller J, et al. Memory complaints in a community sample aged 60-64 years: associations with cognitive functioning, psychiatric symptoms, medical conditions, APOE genotype, hippocampus and amygdala volumes, and white-matter hyperintensities. Psychological Medicine, 2004; 34: 1495-1506.
Jungwirth S, Fischer P, Weissgram S, Kirchmeyr W, Bauer P, Tragl KH. Subjective memory complaints and objective memory impairment in the Vienna-Transdanube Aging Community. JAGS, 2004; 52: 263-268.
Karlsson M. Has exercise an anti-fracture efficacy in women? Scandinavian Journal of Medicine and Science in Sports, 2000; 14: 2-15.
Karlsson, M. Does exercise reduce the burden of fractures? A review. Acta Orthopaedia Scandinavia, 2002; 73(6): 691-705.
Karlsson M. Has exercise an antifracture efficacy in women? Scandinavian Journal of Medicine and Science in Sports, 2004, 14: 2-15.
Kemmler W, Lauber D, Weineck J, Hensen J, Kalender W, Engelke K. Benefits of 2 Years of Intense Exercise on Bone Density, Physical Fitness, and Blood Lipids in Early Postmenopausal Osteopenic Women Results of the Erlangen Fitness Osteoporosis Prevention Study (EFOPS). Archives of Internal Medicine, 2004; 164: 1084-1091.
Knowler WC, Barrett-Connor E, Fowler SE, Hamman RF, Lachin JM, Walker EA, Nathan DM. Reduction in the incidence of type 2 diabetes with lifestyle intervention or metformin. The New England Journal of Medicine, 2002; 346 (6): 393-403.
Kohl HW. Physical activity and cardiovascular disease: evidence for a dose response. Medicine and Science in Sports and Exercise, 2001; 33(6 Suppl): S472-83.
Kriska AM, Saremi A, Hanson RL, Bennett PH, Kobes S, Williams DE, Knowler WC. Physical activity, obesity, and the incidence of type 2 diabetes in a high risk population. American Journal of Epidemiology, 2003: 158: 669-75.
Kritz-Silverstein D, Barrett-Connor E, Corbeau C. Cross sectional and prospective study of exercise and depressed mood in the Elderly. The Rancho Bernardo Study. American Journal of Epidemiology, 2001; 153(6): 596-603.
Kushi LH, Fee RM, Folsom AR, Mink PJ, Anderson KE, Sellers TA. Physical activity and mortality in post menopausal women. JAMA, 1997; 277(16): 1287-92.
Larson, E. B., Wang, L., Bowen, J. D., McCormick, W. C., Teri, L., Crane, P., et al. (2006). Exercise is associated with reduced risk for incident dementia among persons 65 years of age and older. Annals of Internal Medicine, 144(2), 73-81.
Latham N, Anderson C, Bennett D, Stretton C. Progressive resistance strength training for physical disability in older people. Cochrane Database Systematic Reviews, 2003: CD002759.
Laurin D, Verreault R, Lindsay J, MacPherson K, Rockwood K. Physical activity and risk of cognitive impairment and dementia in elderly persons. Archives of Internal Medicine, 2001; 58(3): 498-504.
Lawlor DA, Hopker SH. The effectiveness of exercise as an intervention in the management of depression: systematic review and meta-regression analysis of randomised controlled trials. British Medical Journal, 2001; 322(7289), 763-767.
Lee IM. Physical activity and cancer prevention – data from epidemiologic studies. Medicine and Science in Sports and Exercise, 2003; 35(11):1823-27.
Lee CD, Folsom AR, Blair SN. Physical activity and stroke risk: a meta analysis. Stroke, 2003; 34: 2475-81.
Lee IM, Paffenbarger RS Jr. How much physical activity is optimal for health? Methodological considerations. Research Quarterly for Exercise and Sport, 1996; 67(2): 206-208.
Lee IM, Paffenbarger RS Jr, Hsieh CC. Time trends in physical activity among college alumni, 1962–1988. American Journal of Epidemiology, 1992; 135: 915–25
Lee IM, Rexrode KM, Cook NR, Hennekens CH, Burting JE. Physical activity and breast cancer risk: the Women's Health Study (United States). Cancer Causes and Control, 2001; 12(2): 137-45.
Lee IM, Rexrode KM, Cook NR, Manson JE, Buring JE. Physical activity and coronary heart disease in women: is "no pain, no gain" passé? JAMA, 2001; 285(11): 1447-54.
Lee C, Russell A. Effects of physical activity on emotional well being among older Australian women. Cross sectional and longitudinal analyses. Journal of Psychosomatic Research, 2003; 54: 155-60.
Lee IM, Sesso HD, Oguma Y, Paffenbarger RS Jr. The "weekend warrior" and risk of mortality. American Journal of Epidemiology, 2004; 160(7): 636-41.
Levy-Cushman, J., & Abeles, N. (1998). Memory complaints in the able elderly. Clinical Gerontologist, 19(2), 3-24.
Lilley JM, Arie T, Chilvers CE. Accidents involving older people: a review of the literature. Age Ageing, 1995, 24, 346-365.
Lord SR, Sherrington C, Menz HB. Falls in older people risk factors and strategies for prevention. Cambridge, UK: Cambridge University Press, 2001.
Lund Nilsen TI, Vatten LJ. Prospective study of colorectal cancer risk and physical activity, diabetes, blood glucose and BMI: exploring the hyperinsulinaemia hypothesis. British Journal of Cancer, 2001; 84(3) 417-422.
Luoto R, Latikka P, Pukkala E, Hakulinen T, Vihko V. The effect of physical activity on breast cancer risk: a cohort study of 30,548 women. European Journal of Epidemiology, 2001; 16:973- 80.
McTiernan A, Kooperberg C, White E, Wilcox S, Coates R, Adams-Campvell LL, Woods N, Ockene J. Recreational physical activity and the risk of breast cancer in postmenopausal women: The Women's Health Initiative Cohort Study. JAMA, 2003; 290(10): 133 1-6.
Manson JE, Greenland P, LaCroix AZ, Stefanick ML, Mouton CP, Oberman A, Perri MG, Sheps DS, Pettinger MB, Siscovick DS. Walking compared with vigorous exercise for the prevention of cardiovascular events in women. The New England Journal of Medicine, 2002; 347(10): 716-25.
Manson JE, Hu FB, Rich-Edwards JW, Colditz GA, Stampfer MJ, Illett WC, Speizer FE, Hennekens CH. A prospective study of walking as compared with vigorous exercise in the prevention of coronary heart disease in women. The New England Journal of Medicine, 1999; 341: 650-8.
Manson JE, Nathan DM, Krolewski AS, Stampfer MJ, Willett WC, & Hennekens CH. A prospective study of exercise and incidence of diabetes among US male physicians, JAMA, 1992; 268: 63-7.
Manson JE, Rimm EM, Stampfer MJ, Colditz GA, Willett WC, Krolewski AS, Rosner B, Hennekens CH, Speizer FE. Physical activity and incidence of non-insulin dependent diabetes mellitus in women. Lancet, 1991; 338: 774-8.
Martinez ME, Giovannucci E, Spiegelman D, Hunter DJ, Willett WC, Colditz GA. Leisure time physical activity, body size, and colon cancer in women. Journal of the National Cancer Institute, 1997; 89(13): 948-55.
Mathers C, Vos T, Stevenson C. The burden of disease and injury in Australia. Report No.: PHE 17. Australian Institute of Health and Welfare: Canberra 1999.
McVeigh C: Perimenopause: more than hot flushes and night sweats for some Australian women. Journal of Obstetric Gynecological Neonatal Nursing, 2005, 34:21-27.
Michaud DS, Giovannucci E, Willett WC, Colditz GA, Stampfer MJ, Fuchs CS. Physical activity, obesity, height, and the risk of pancreatic cancer. JAMA, 2001; 286(8): 92 1-9.
Misra DP, Strobino DM, Stashinko EE, Nagey DA, Nanda J. Effects of physical activity on pre-term birth. American Journal of Epidemiology, 1998; 147(7): 628-35.
Moore DB, Folsom AR, Mink PJ, Hong C, Anderson KE, Kushi LH. Physical activity and incidence of post menopausal breast cancer. Epidemiology, 2000; 11(3): 292-96.
Moradi T, Nyren O, Bergstrom R, Gridley G, Linet M, Wolk A, Dosemeci M, Adami HO. Risk for endometrial cancer in relation to occupational physical activity: a nationwide cohort study in Sweden. International Journal of Cancer, 1998; 76: 665-670.
Morris JN, Everitt MG, Pollard R, Chave SPW, Semmence AM. Vigorous exercise in leisure time: protection against coronary heart disease. Lancet, 1980; 2: 1207–1210.
Morris JN, Kagan A, Pattison DC, Gardner MJ, Raffle PAB. Incidence and prediction of ischemic heart disease in London busmen. Lancet, 1966; 2: 553-9.
Morss GM, Jordan AN, Skinner JS, Dunn AL, Church TS, et al. Dose-response to exercise in women aged 45-74 years (DREW): design and rationale. Medicine and Science in Sports and Exercise, 2004; 36: 336-44.
Nakayama T, Date C, Yokoyama T, Yoshiike N, Yamaguchi M, Tanaka H. A 15.5 year follow up of stroke in a Japanese provincial city. Stroke, 1997; 28: 45-52.
National Heart Foundation. Risk factor prevalence study no. 3. Canberra: National Heart Foundation, 1989.
O'Sullivan J. Diabetes mellitus after gestational diabetes mellitus. Diabetes, 1991; 29: 131-5.
Paffenbarger RS Jr, Hale WE. Work activity and coronary heart mortality. New England Journal of Medicine, 1975; 292: 545-50.
Paffenbarger RS Jr, Hyde RT, Wing AL. Physical activity and incidence of cancer in diverse populations: a preliminary report. American Journal of Clinical Nutrition, 1987; 45: 312-7.
Paffenbarger RS Jr, Wing AL, Hyde RT. Physical activity as an index of heart attack risk in college alumni. American Journal of Epidemiology, 1978; 108: 161-75.
Paffenbarger RS Jr, Lee IM, Leung R. Physical activity and personal characteristics associated with depressions and suicide in American college men. Acta Psychiatrica Scandinavica Supplementum, 1994; 377: 16-22.
Paganini-Hill A, Barreto MP. Stroke risk in older men and women: aspirin, estrogen, exercise, vitamins and other factors. Journal of Gender Specific Medicine, 2001; 4(2): 18-28.
Paluska SA, Schwenk TL. Physical activity and mental health. Current concepts. Sports Medicine, 2000; 29(3): 167-80. Pan XR, Li GW, Hu YH,Wang JX, Yang WY, An ZX, Hu ZX, Lin J, Xiao JZ, Cao HB, Liu PA, Jiang XG, Jiang YY, Wang JP, Zheng H, Zhang H, Bennett PH, Howard BV. Effects of diet and exercise in preventing NIDDM in people with impaired glucose tolerance. The Da Qing IGT and Diabetes Study. Diabetes Care, 1997; 20(4): 537-44.
Pate RR, Pratt M, Blair SN, Haskell WL, Macera CA, Bouchard C, et al. Physical activity and public health - a recommendation from the Centres for Disease Control and Prevention and the American College of Sports Medicine. Journal of the American Medical Association, 1995; 273(5), 402-7.
Patel AV, Rodriguez C, Bernstein L, Chao A, Thun MJ, Calle EE. Obesity, recreational physical activity and risk of pancreatic cancer in a large US cohort. Cancer Epidemiology, Biomarkers & Prevention, 2005; 14(2): 459-66.
Pratt M, Macera C, Wang G. Higher direct medical costs associated with physical inactivity. Physician Sportsmedicine 2000; 28: 63-70.
Pronk NP, Goodman MJ, O'Connor PJ, Martinson BC. Relationship between modifiable health risks and short term health care charges. JAMA, 1999; 282:2235-9.
Pedersen BK, Saltin B. Evidence for prescribing exercise as therapy in chronic disease. Scandinavian Journal of Medicine and Science in Sports, 2006; 16(Suppl 1): 3-63.
Penedo FJ, Dahn JR. Exercise and well-being: a review of mental and physical health benefits associated with physical activity. Current Opinion in Psychiatry, 2005; 18: 189-93.
Phillips WT, Kirnan M, King AC. Physical activity as a nonpharmacological treatment for depression: a review. Complementary Health Practice Review, 2003; 8(2): 139-152.
Pignatti F, Rozzini R, Trabucchi M. Physical activity and cognitive decline in elderly persons. Archives of Internal Medicine, 2002; 162(3): 361.
Prime Minister's Science, Engineering and Innovation Council (PMSEIC). Promoting healthy ageing in Australia. Canberra: Australian Government Publishing Service, 2003.
Riedel-Heller SG, Matschinger H, Schork A, Angermeyer MC. Do memory complaints indicate the presence of cognitive impairment? Results of a field study. European Archives of Psychiatry and Clinical Neuroscience, 1999; 249: 197-204.
Rockhill B, Willett WC, Hunter DJ, Manson JE, Hankinson SE, Colditz GA. A prospective study of recreational physical activity and breast cancer risk. Archives of Internal Medicine, 1999; 159: 2290-96.
Rockhill B, Willett WC, Manson JE, Leitzmann MF, Stampfer MJ, Hunter DJ, Coldtidz GA. Physical activity and mortality: a prospective study among women. American Journal of Public Health, 2001; 91 (4): 578 – 83.
Rockhill B, Willett WC, Hunter DJ, Manson JE, Hankinson SE, Spiegelman D, Colditz GA. Physical activity and breast cancer risk in a cohort of young women. Journal of the National Cancer Institute, 1998; 90(15): 1155-60.
Rose G. The strategy of preventive medicine. New York: Oxford University Press, 1992.
Samad AKA, Taylor RS, Marshall T, Chapman MAS. A meta-analysis of the association of physical activity with reduced risk of colorectal cancer. Colorectal Disease, 2005; 7: 204-13.
Sattin RW, Lambert Huber DA, Devito CA, Rodriguez JG, Ros A, Bacchelli S, et al. The incidence of fall injury events among the elderly in a defined population. American Journal of Epidemiology, 1990, 131: 1028-1037.
Schaper AG, Wannamathee G. Physical activity and ischaemic heart disease in middle-aged British men. British Heart Journal, 1991; 66: 384-94.
Seavey WG, Kurata JH, Cohen RD. Risk factors for incident self-reported arthritis in a 20 year follow-up of the Alameda County Study Cohort. Journal of Rheumatology, 2003; 30: 2103-11.
Sesso HD, Paffenbarger RS Jr, Lee IM. Physical activity and breast cancer risk in the college alumni health study (United States). Cancer Causes and Control, 1998; 9: 433-9.
Sesso HD, Paffenbarger RS, Ha T, Lee IM. Physical activity and cardiovascular disease risk in middle-aged and older women. American Journal of Epidemiology, 1999; 150(4): 408-16.
Sherrington C, Lord SR, Finch CF. Physical activity interventions to prevent falls among older people: update of the evidence. Journal of Science and Medicine in Sport, 2004; 7: 43-51.
Singh, MAF. Exercise comes of age: rationale and recommendations for a geriatric exercise prescription. Journal of Gerontology 2002; 57A: M262-82.
Sinner PJ, Schmitz KH, Anderson KE, Folsom AR. Lack of association of physical activity and obesity with incident pancreatic cancer in elderly women. Cancer Epidemiology, Biomarkers & Prevention, 2005; 14(6): 1571-3.
Slattery ML. How much physical activity do we need to maintain health and prevent disease? Different diseases – different mechanisms. Research Quarterly in Exercise and Sport, 1996; 67(2): 209-212.
Slaven L, Lee C. Mood and Symptom Reporting Among Middle-Aged Women: The Relationship Between Menopausal Status, Hormone Replacement Therapy, and Exercise Participation. Health Psychology, 1997; 16: 203-208.
Slemenda C. Prevention of hip fractures: risk factor modification. American Journal of Medicine, 1997; 103(2A): 65S-73S.
Slentz CA, Dusch BD, Johnson JL, Ketchum K, Aiken LB, Samsa GP, Houmard JA, Bales CW, Kraus WE. Effects of the amount of exercise on body weight, body composition, and measures of central obesity: STRRIDE--a randomized controlled study. Archives of Internal Medicine, 2004; 164(1): 31-9.
Solomon CG, Willett WC, Carey VJ, Rich-Edwards J, Huneter DJ, Colditz GA, Stampfer MJ, Speizer FE, Speigelman D, Manson JE. A prospective study of pregravid determinants of gestational diabetes mellitus. JAMA, 1997; 278: 1078-1083.
Speechley M, Tinetti M. Falls and injuries in frail and vigorous community elderly persons. Journal of the American Geriatric Society, 1991; 39: 46-52.
Sports Medicine Australia. SMA statement: the benefits and risks of exercise during pregnancy. Journal of Science and Medicine in Sport, 2002; 5(1): 11 – 19.
St John, P., & Montgomery, P. (2003). Is subjective memory loss correlated with MMSE scores or dementia? Journal of Geriatric Psychiatry and Neurology, 16, 80-83.
Stephenson J, Bauman A, Armstrong T, Smith B, Bellew B. The costs of illness attributable to physical inactivity in Australia: a preliminary study. The Commonwealth Department of Health and Aged Care and the Australian Sports Commission: Canberra 2000.
Sternfeld B, Jacobs MK, Quesenberry CP Jr, Gold EB, Sowers M. Physical activity and menstrual cycle characteristics in two prospective cohorts. American Journal of Epidemiology, 2002; 156(5): 402-9.
Suutama T, Ruoppila I. Associations between cognitive functioning and physical activity in two 5 year follow up studies of older Finnish persons. Journal of Aging and Physical Activity, 1998; 6: 169-83.
Swain, DP & Franklin BA. Comparison of cardioprotective benefits of vigorous versus moderate intensity aerobic exercise. American Journal of Cardiology, 2006; 97: 141-7.
Taylor HL, Klepetar E, Keys A, Parlin W, Blackburn H, Puchner T. Death rates among physically active and sedentary employees of the railroad industry. American Journal of Public Health, 1962; 52: 1697 -1707.
Tehard B, Friedenreich CM, Oppert JM, Clavel-Chapelon F. Effect of physical activity on women at increased risk of breast cancer: results fro the E3N Cohort Study. Cancer Epidemiology, Biomarkers & Prevention, 2006; 15(1): 57-64.
Terry P, Baron JA, Weiderpass E, Yuen J, Lichtenstein P, Nyren O. Lifestyle and endometrial cancer risk: a cohort study from the Swedish twin registry. International Journal of Cancer, 1999; 82:38-42.
The Australian Longitudinal Study on Women's Health. Trends in women's health: Results from the ALSWH – priority conditions, risk factors and health behaviours. Report prepared for the Australian Government Department of Health & Ageing. March 2006.
Thune I, Brenn T, Lund E, Gaard M. Physical activity and the risk of breast cancer. The New England Journal of Medicine, 1997; 336(18): 1269-75.
Thune I, Lund L. Physical activity and risk of colorectal cancer in men and women. British Journal of Cancer, 1996; 73: 1134-40.
Thune I, Lund E. The influence of physical activity on lung cancer risk. International Journal of Cancer, 1997; 70: 57-62.
Tinetti ME. Preventing falls in elderly persons. New England Journal of Medicine, 2003; 348: 42-49.
Tinetti ME, Williams CS. Falls, injuries due to falls, and the risk of admission to a nursing home. New England Journal of Medicine, 1997; 337, 1279-1284.
Tripathi A, Folsom AR, Anderson KE. Risk factors for urinary baldder carcinoma in post menopausal women. The Iowa Women's Study. Cancer, 2002; 95: 2316-23.
Tuomilehto J, Lindstrom J, Eriksson JG, Valle TT, Hamalainen H, Ilanne-Parikka P, KeinanenKiukaanniemi S, Laakso M, Louheranta A, Rastas M, Salminen V, Aunola S, Cepaitis Z, Moltchanov V, Hakumaki M, Mannelin M, Martikkala V, Sundvall J, Uusitupa M, for the Finnish Diabetes Prevention Study Group. Prevention of type 2 diabetes mellitus by changes in lifestyle among subjects with impaired glucose tolerance. New England Journal of Medicine, 2001; 344(18): 1343- 50.
US Department of Health and Human Services. Physical activity and health: a report of the surgeon general. Atlanta, GA: US Department of Health and Human Services, Centers for Disease Control and Prevention, National Center for Chronic Disease Prevention and Heath Promotion, 1996.
US Department of Health and Human Services and the Department of Agriculture. Dietary guidelines for Americans 2005. Retrieved February 22, 2006, from http://www.healthierus.gov/dietaryguidelines/.
Utian WH. Psychosocial and socioeconomic burden of vasomotor symptoms in menopause: A comprehensive review. Health and Quality of Life Outcomes, 2005, 3:47.
Van Dijk BAC, Schouten LJ, Kiemeney LALM, Goldbohm RA, van den Brandt PA. Relation of height, body mass, energy intake, and physical activity to risk of renal cell carcinoma: results from the Netherlands Cohort Study. American Journal of Epidemiology, 2004; 160: 1159-1167.
Wang L, Larson EB, Bowen JD, van Belle G. Performance-based physical function and future dementia in older people. Archives of Internal Medicine, 2006; 166: 1115-1120.
Wang F, McDonald T, Reffott B, Edington DW. BMI, physical activity and health care utilization/costs among Medicare retirees. Obesity Research 2005; 13: 1450-7.
Wannamethee SG, Shaper AG. Physical activity and cardiovascular disease. Seminars in Vascular Medicine, 2002; 2(3): 257-66.
Ware JE, Kosinski M, Keller SD. SF-36 Physical and mental health summary scales: A User's Manual. Boston, MA: health Assessment Lab, 1994.
Weinstein AR, Sesso HD, Lee IM, Cook NR, Manson JE, Buring JE, Gaziano JM. Relationship of physical activity vs body mass index with type 2 diabetes in women. JAMA, 2004; 292(10): 1188- 94.
Weller I, Corey P. The impact of excluding non-leisure energy expenditure on the relation between physical activity and mortality in women. Epidemiology, 1998; 9: 632-5.
Weuve J, Kang JH, Manson JE, Breteler MMB, Ware JH, Grodstein F. Physical activity, including walking, and cognitive function in older women. JAMA, 2004; 292: 1454-61.
Weyerer S. Physical inactivity and depression in the community: evidence from the Upper Bavarian Field Study. International Journal of Sports Medicine, 1992; 13: 492-6.
Wilcox S, Parra-Medina D, Thompson-Robinson M, Will J. Nutrition and physical activity interventions to reduce cardiovascular disease risk in health care settings: a quantitative review with a focus on women. Nutrition Reviews, 2001; 59(7): 197-215.
Willer A. Reduction of the individual cancer risk by physical exercise. Onkologie, 2003; 26: 283- 289.
Wolf AM, Hunter DJ, Colditz GA, Manson JE, Stampfer MJ, Corsano KA, Rosner B, Kriska A, & Willett WC. Reproducability and validity of a self-administered physical activity questionnaire. International Journal of Epidemiology, 1994; 23: 99 1-9.
Yaffe K, Barnes D, Nevitt M, Lui LY, Covinsky K. A prospective study of physical activity and cognitive decline in elderly women. Archives of Internal Medicine, 2001; 161: 1703-8.
Appendices
- Appendix A: Population Based Studies of the Association Between Physical Activity and Coronary Heart Disease/Cardiovascular Disease
- Appendix B: Population Based Studies of the Association Between Physical Activity and Diabetes
- Appendix C: Population Based Studies of the Association Between Physical Activity and Gestational Diabetes
- Appendix D: Population Based Studies of the Association Between Physical Activity and Breast Cancer
- Appendix E: Population Based Studies of the Association Between Physical Activity and Colorectal Cancer
- Appendix F: Population Based Studies of the Association Between Physical Activity and Cancer (Excluding Breast and Colorectal Cancer)
- Appendix G: Population Based Studies of the Association Between Physical Activity and Mental Health
- Appendix H: Population Based Studies of the Association Between Physical Activity and Musculoskeletal Health
- Appendix I: Population Based Studies of the Association Between Physical Activity and Injury
- Appendix J: Population Based Studies of the Association Between Physical Activity and Reproductive Health
Appendix A
| Reference | Study Number & Age of Women | Physical Activity Measurement | Outcome Follow-up Period Adjustments | Summary of Results (95% confidence interval) |
|---|---|---|---|---|
| Dorn et al., (1999) | Buffalo Health Study (USA) N=763 15-96 years of age in 1960 |
Interview: 1960-61
|
Coronary heart disease mortality 29 years Age, education, cigarettes, BP |
For each unit increase in total PA energy expenditure (kcal/kg/hour) Aged <60 years (n=613) 0.42 (0.11-1.52) Aged >60 years (n=150) 1.78 (0.77–4.09) |
| Ellekjaer et al., (2000) | Nord-Trondelag Health Survey (Norway) N=14,101 50-69 years of age (n=9,460) 70-79 years of age (n=3,417) 80-101 years of age (n=1,224) |
Questionnaire: 1984-6
|
Stroke mortality 10 years ge, smoking, diabetes, BMI, antihypertensive medication, SBP, angina pectoris, myocardial infarction, illness impairing function, education |
PA level, all women Low: 1.00 Medium: 0.77 (0.61-0.98) High: 0.52 (0.30-0.72) p trend=0.0001 PA level, 50-69 years Low: 1.00 Medium: 0.57 (0.34-0.95) High: 0.42 (0.24-0.75) p trend=0.0021 PA level, 70-79 years Low: 1.00 Medium: 0.79 (0.55-1.12) High: 0.56 (0.36-0.88) p trend=0.0093 PA level, 80-101 years Low: 1.00 Medium: 0.91 (0.60-1.39) High: 0.57 (0.30-1.09) p trend=0.108 |
| Folsom, et al., (1997) | Atherosclerosis Risk in Communities Study (USA). N=7,852 45-64 years of age |
Interview: 1987-89 Sports PA in past year
Leisure PA in past year
Quartiles (values not given)
|
Coronary heart disease incident events (MI or death) 4-7 years Age, education, smoking, alcohol, HRT, race, study centre, diabetes, waist hip ratio, T-C, HDL-C, SBP, antihypertensive medication, fibrinogen |
Sports PA Lowest: 1.00 2nd quartile: 0.96 (0.49-1.92) 3rd quartile: 0.51 (0.21-1.21) Highest: 0.49 (0.21-1.31) p trend=0.04 Leisure PA Lowest: 1.00 2nd quartile: 0.74 (0.42-1.21) 3rd quartile: 1.07 (0.55-2.09) Highest: 0.64 (0.34-1.24) p trend=0.37 |
| Gregg, et al., (2003) | Study of Osteoporotic Fractures (USA) N=7,553 > 65 years of age |
Questionnaire: 1986-8, 1992-4
|
Cardiovascular disease mortality 12.5 years Age, smoking, BMI, stroke, diabetes, hypertension, self rated health at baseline, cancer, chronic obstructive pulmonary disease, incident hip fracture, baseline PA |
Total PA (kcal/week) <163: 1.00 163-503: 0.65 (0.53-0.79) 504-1045: 0.70 (0.57-0.85) 1046-1906: 0.60 (0.48-0.75) >1907 0.58: (0.46-0.74) Walking (kcal/week) <70: 1.00 70-186: 0.88 (0.73-1.06) 187-419: 0.66 (0.53-0.82) 420-897: 0.68 (0.55-0.84) > 898: 0.61 (0.49-0.78) PA change Stayed sedentary: 1.00 Became active: 0.64 (0.42-0.97) Became sedentary: 1.07 (0.81-1.42) Stayed active: 0.62 (0.44-0.88) |
| Haapanen et al., (1997) | Finland N=953 35-63 years of age in 1980 |
Questionnaire: 1980
|
Coronary heart disease incidence and mortality 10 years Age, smoking |
Total PA (kcal/week) 0-900: 1.00 901-1500: 0.73 (0.38-1.39) >1500: 1.25 (0.72-2.15) p trend=0.178 vPA (x/week) >1x 1.00 >1x 1.13 (0.62-2.07) p trend=0.694 |
| Haapanen- Niemi, et al., (2000) | Finland N=1,122 35-63 years of age in 1980 51-79 years of age in 1996 |
Questionnaire: 1980
|
Cardiovascular disease mortality 16 years age, marital status, employment status, perceived health, smoking status, alcohol consumption |
Total PA (kcal/week) 0-800: 1.00 800.1-1500: 0.43 (0.16–1.16) >1500: 1.17 (0.51–2.68) p=0.046 Global leisure PA vPA > 1/wk, light PA: 1.00 no/light PA: 4.68 (1.41–15.57) p=0.002 Walk 2km ability No difficulty: 1.00 Some difficulty: 1.25 (0.53-2.90) p=0.614 Stair climbing ability No difficulty: 1.00 Some difficulty: 3.38 (1.22–9.41) p=0.13 |
| He, et al., (2001) | NHANES I Epidemiologic Follow up Study (USA) N= 8098 25-74 years of age in 1971 and 1975 Mean 48.1 years |
Interview: 1971-5
|
Congestive heart failure (CHF) 7-21 years Average 19 years race, CHD history, education, smoking, alcohol, BP, hypertension, cholesterol, overweight, diabetes, valvular disease |
PA level Medium/High: 1.00 Low: 1.31 (1.11–1.54) p= 0.002 |
| Hu et al., (2000). | Nurses Health Study (USA) N= 72,488 40-65 years of age in 1986 |
Questionnaire: 1980
Questionnaire: 1980
Questionnaire: 1986, 1988, 1992
|
Stroke 8 years age, time, smoking, BMI, menopausal status, parental history of MI, alcohol, aspirin, diabetes history, hypertension history, hypocholesterolemia history |
Total PA (MET.hour/week) <2.0: 1.00 2.1-4.6: 0.98 (0.75-1.29) 4.7-10.4: 0.82 (0.61–1.10) 10.5-21.7: 0.74 (0.54–1.01) >21.7: 0.66 (0.47–0.91) p trend=0.005 Walking (MET.hour/week) < 0.5: 1.00 0.6-2.0: 0.76 (0.56–1.04) 21.-3.8: 0.78 (0.56–1.07) 3.9-10: 0.70 (0.52–0.95) >10: 0.66 (0.48–0.91) p trend=0.01 Walking pace (km/hour) <3.2: 1.00 3.2-4.6: 0.81 (0.63–1.03) >4.6 0.49 (0.36–0.68) p trend < 0.001 For each 3.5 hour/week increase in mPA and vPA 0.81 (0.68-0.98) p=0.03 |
| Kushi, et al., (1997) | Iowa Women's Health Study (USA) N= 40,417 55–69 years in 1986 |
Questionnaire: 1986
|
Cardiovascular disease mortality 7 years age, menarche age, menopause age, age at first live birth, parity, alcohol, total energy intake, smoking, estrogen use, BMI at baseline, BMI at age 18, waist to hip ratio, education, marital status |
Daily PA No: 1.00 Yes: 0.72 (0.54–0.95) mPA (frequency) Rarely/never: 1.00 1x/wk, few/mo 0.86 (0.61–1.21) 2-4x/week 0.74 (0.52–1.05) >4x/week 0.53 (0.34 – 0.82) p trend=0.003 vPA (frequency) Rarely/never: 1.00 1/wk, few/mo: 0.85 (0.50–1.44) 2-4x/week: 0.59 (0.28–1.25) >4x/week 0.20 (0.03–1.41) p trend=0.09 PA level (frequency) Low: 1.00 Medium: 0.86 (0.63–1.17) High: 0.55 (0.38–0.81) p trend=0.002 |
| Lee, Rexrode, Cook, Manson, et al., (2001) | Women's Health Study (USA and Puerto Rico) N= 39,372 > 45 years of age |
Questionnaire: 1992-5
|
Coronary heart disease 4-7 years Average 5 yrs study condition, smoking status, alcohol consumption, saturated fat intake, fibre intake, fruit and vegetable consumption, menopausal status, hormone use, parental MI history, BMI, hypertension, elevated cholesterol, diabetes |
Total PA (kcal/wk) <200: 1.00 200-599: 0.79 (0.56–1.12) 600-1499: 0.55 (0.37–0.82) >1500: 0.75 (0.50–1.12) p trend=0.03 vPA (kcal/wk) 0 & <200 other PA: 1.00 0 & >200 other PA: 0.65 (0.46–0.91) 1-199 vPA 1.18 (0.79–1.78) 200-499 vPA 0.96 (0.60–1.55) > 500 vPA: 0.63 (0.38–1.04) p trend=0.45 Walking (time/wk) No walking: 1.00 1-59mins: 0.86 (0.52–1.29) 1.0-1.5 hrs: 0.49 (0.28–0.86) >2hrs 0.48 (0.29–0.78) p trend=0.001 Walking pace (km/hour) No walking: 1.00 <3.2: 0.56 (0.32–0.97) 3.2-4.7: 0.71 (0.47–1.05) >4.8: 0.52 (0.30–0.90) p trend=0.02 |
| Manson, et al., (2002) | Women's Health Initiative Observational Study (USA) N= 73,743 50-79 years of age between 1994 and 1998 |
Questionnaire: 1994-98
|
Cardiovascular disease 5.9 years (mean 3.2yrs) age, smoking, BMI, waist/hip ratio, alcohol, age at menopause, HRT, parental history MI, ethnicity, education, family income, dietary variables |
Total PA (MET.hours/week) 0-2.4: 1.00 2.5-7.2: 0.89 (0.75–1.04) 7.3-13.4: 0.81 (0.68-0.97) 13.5-23.3: 0.78 (0.66–0.93) >23.4 0.72 (0.59–0.87) p trend <0.001 Walking (MET.hours/week) 0: 1.00 0.1-2.5: 0.91 (0.78–1.07) 2.6-5.0: 0.82 (0.69–0.97) 5.1-10.0: 0.75 (0.63–0.89) >10.0: 0.68 (0.56–0.82) p trend <0.001 vPA (mins/week) 0: 1.00 1-60: 0.91 (0.73–1.12) 61-100 0.81 (0.63–1.06) 101-150 0.85 (0.64–1.13) >150 0.76 (0.58–1.00) p trend=0.01 |
| Coronary Heart Disease 5.9 years (mean 3.2yrs) age, smoking, BMI, waist/hip ratio, alcohol, age at menopause, HRT, parental history MI, ethnicity, education, family income, dietary variables | Total PA (MET.hours/week) 0-2.4:1.00 2.5-7.2: 0.73 (0.53–0.99) 7.3-13.4 0.69 (0.51–0.95) 13.5-23.3 0.68 (0.50–0.93) > 23.4 0.47 (0.33–0.67) p trend <0.001 Walking (MET.hours/week) 0: 1.00 0.1-2.5: 0.71 (0.53–0.96) 2.6-5.0: 0.60 (0.44–0.83) 5.1-10.0: 0.54 (0.39–0.76) >10.0 0.61 (0.44–0.84) p trend=0.004 vPA (mins/week) 0: 1.00 1-60: 1.12 (0.79-1.60) 61-100: 0.56 (0.32-0.98) 101-150: 0.73 (0.43-1.25) >150 0.58 (0.34-0.99) p trend=0.008 |
|||
| Manson, et al., (1999) | Nurses Health Study (USA) N= 72,488 40-65 years of age in 1986 |
Questionnaire: 1986
|
Coronary events (non fatal MI or death from coronary disease) 8 years age, study period, smoking, alcohol, BMI, menopausal status, HRT, aspirin, multivitamin, vitamin E, parental history of MI, diabetes history hypertension, hypocholesterolemia. |
Total PA (MET.hours/wk) <2.0: 1.00 2.1-4.6: 0.88 (0.71–1.10) 4.7-10.4: 0.81 (0.64–1.02) 10.5-21.7: 0.74 (0.58–0.95) >21.7 0.66 (0.51–0.86) p trend=0.002 Walking (excluding vPA) (MET.hours/wk) < 0.5: 1.00 0.6-2.0: 0.78 (0.57–1.06) 2.1-3.8: 0.88 (0.65-1.21) 3.9-10 0.70 (0.51–0.95) >10.0 0.65 (0.47–0.91) p trend=0.02 Walking pace (km/hour) <3.2: 1.00 3.2-4.6: 0.75 (0.59–0.96) >4.6: 0.64 (0.47– 0.88) Walking (W) & vPA (V) (MET.hours/wk) W(0-0.6) & V(0): 1.00 W(0-0.6) & V(0.1-6.9): 0.78 (0.55-1.09) W(0-0.6) & V(>7): 0.76 (0.49-1.17) W(0.7-6.9) & V(0): 0.84 (0.67-1.06) W(0.7-6.9) & V(0.1-6.9): 0.86 (0.65-1.13) W(0.7-6.9) & V(>7): 0.59 (0.42-0.82) W(>7) & V(0): 0.74 (0.57-0.97) W(>7) & V(0.1-6.9): 0.56 (0.36-0.88) W(>7) & V(>7): 0.70 (0.51-0.95) |
| Nakayama et al., (1997) | (Japan) N= 1,341 >40 years of age 40-49 (n=417) 50-99 (n=398) 60–69 (n=309) >70 (n=217) |
Questionnaire: 1977
|
Stroke 15.5 years age, BP, BMI, ECG, smoking amount, alcohol, history IHD, CVD health |
Total PA Moderate 1.00 Light 1.95 (1.03–3.68) |
| Paganini-Hill & Barreto (2001) | Leisure World Cohort Study (USA) N= 8532 44-101 years of age Median=74 years of age |
Questionnaire: 1981 or 1983 or 1985 Exercise (hours/day) |
Stroke 13–17 years |
Exercise (hours/day) <0.5: 1.00 1: 0.88 >1.0 0.83 p trend <0.05 (no confidence intervals provided) |
| Rockhill, et al., (2001) | Nurses Health Study (USA) N= 80,348 30-55 years of age in 1976 |
Questionnaire
|
Cardiovascular disease mortality 14 years age, smoking, alcohol, height, BMI, post menopausal hormone use |
Total PA (hours/week) <1: 1.00 1-1.9: 0.80 (0.68–0.96) 2-3.9: 0.74 (0.62–0.88) 4-6.9: 0.62 (0.50–0.77) >7 0.69 (0.49–0.97) p trend=< 0.001 |
| Sesso, et al., (1999) | Pennsylvania Alumni Study (USA) N= 1,564 Mean age 45.5 years |
Questionnaire: 1962
|
Cardiovascular disease 31 years age, BMI, hypertension, diabetes, smoking, family history CHD |
Total PA (kcal/wk), all women <500: 1.00 500-999: 0.99 (0.69–1.41) >1000: 0.88 (0.62–1.25) p trend=0.45 Total PA (kcal/wk), Age <45 years, <500: 1.00 500-999: 1.57 (0.79–3.10) >1000 0.94 (0.47–1.86) p trend=0.57 Total PA (kcal/wk), Age >45 years, <500: 1.00 500-999: 0.83 (0.54–1.27) >1000: 0.88 (0.58–1.33) p trend=0.62 Stairs climbed (number/day) <4: 1.00 4-11: 0.86 (0.60–1.23) >12 1.01 (0.69–1.47) p trend=0.89 Blocks walked (number/day) <4: 1.00 4-9: 0.84 (0.59–1.19) >10 0.67 (0.45–1.01) p trend=0.054 Sports (kcal/wk) 0: 1.00 1-999: 1.23 (0.74–2.03) >1000: 1.32 (0.74–2.37) p trend=0.33 |
| Weller & Corey (1998) | Canada Fitness Survey (Canada) N= 6,620 >30 years of age in 1981 |
Questionnaire: 1980
|
Cardiovascular mortality 7 years age (adjustment for marital status, education, income, self reported health, tobacco use did not alter results) |
Total PA (kcal/kg/day) 0-3.9: 1.00 >3.9-7.0: 1.01 (0.68–1.51) >7.0-11.3: 0.70 (0.44–1.11) >11.3 0.51 (0.28–0.91) Leisure PA (kcal/kg/day) 0-0.1: 1.00 >0.1-0.5: 0.79 (0.46–1.37) >0.5-1.6 1.08 (0.72–1.64) >1.6 0.80 (0.50–1.26) Non leisure PA (kcal/kg/day) 0-0.28:1.00 >2.8-5.9: 0.85 (0.56–1.28) >5.9-9.8: 0.61 (0.39–0.96) >9.8 0.49 (0.28–0.86) Leisure PA level Sedentary 1.00 Moderate 0.90 (0.56–1.45) High 0.78 (0.52–1.15) |
Notes. BP: blood pressure, CVD: cardiovascular disease, CHD: coronary heart disease, CHF: coronary heart failure, ECG: electrocardiogram, HDL-C: HDL cholesterol, HRT: hormone replacement therapy, IHD: iscahemic heart disease, kcal: kilocalories, kg: kilogram, km: kilometers, m: miles, MET: metabolic equivalent, MI: myocardial infarction, mPA: moderate intensity physical activity, PA: physical activity, SBP: systolic blood pressure, T-C: total cholesterol, vPA: vigorous PA.
Appendix B
| Reference | Study Number & Age of Women | Physical Activity Measurement | Follow-up Period, Adjustments | Summary of Results (95% confidence interval) |
|---|---|---|---|---|
| Dotevall et al., (2004) | Goteborg BEDA Study of CVD (Sweden) N= 1,351 39-65 years of age |
Questionnaire: 1979-81
|
16-19 years age, smoking, menopause, BMI, SBP, cholesterol, triglycerides |
PA level Not sedentary 1.00 Sedentary 1.56 (0.96-2.53) p trend=0.071 |
| Folsom et al., (2000) | Iowa Women's Health Study (USA) N= 34,257 55-69 years of age |
Questionnaire: 1986
|
12 years age, education, smoking, alcohol, estrogen, diet, family history of diabetes, BMI, waist-hip ratio |
Regular PA No 1.00 Yes 0.86 (0.78-0.95) mPA (frequency) rarely/never 1.00 1x/wk, few/mo 0.90 (0.79-1.01) 2-4 x/wk 0.86 (0.76-0.98) >4 x/wk 0.73 (0.62-0.85) p trend <0.001 vPA (frequency) rarely/never 1.00 1x/wk, few/mo 0.92 (0.76-1.10) 2-4 x/wk 0.88 (0.70-1.11) >4x/wk 0.64 (0.41–1.01) p trend <0.05 PA index, all women Low 1.00 Medium 0.91 (0.82-1.02) High 0.79 (0.70-0.90) p trend <0.001 PA index, age 55-59 years Low 1.00 Medium 0.76 (0.62-0.92) High 0.62 (0.50-0.78) p trend <0.001 PA index, age 60-64 years Low 1.00 Medium 0.73 (0.60-0.88) High 0.58 (0.47-0.71) p trend <0.001 PA index, age 65-69 years, Low 1.00 Medium 0.76 (0.62-0.93) High 0.54 (0.43-0.68) p trend < 0.001 |
| Haapanen, et al., (1997) | Census (Finland) N= 1,500 35-63 years of age in 1980 |
Questionnaire: 1980
|
10 years age |
Total PA (kcal/wk) 0-900 1.00 901-1500 1.17 (0.50-2.70) >1500 2.64 (1.28-5.44) p trend=0.006 vPA (frequency/wk) >1 1.00 <1 2.23 (0.90-5.23) p trend=0.043 |
| Hsia et al., (2005) | Women's Health Initiative Observational Study (USA) N= 86,708 Caucasian n= 74,240, average age 64 years African American n=6,465 average age 62 years Hispanic n= 3,231 average age 60 years Asian/Pacific Islander n=2,445 average age 64 years American Indian n= 327 average age 62 years |
Questionnaire: 1994-98
|
4-8 years Average 5.1 years age, BMI, alcohol use, education, smoking, hypertension, hypercholesterolemia, dietary fibre, carbohydrate energy |
Walking (METS.hours/wk), Combined groups 0 1.00 0.5-2.5 0.77 (0.68-0.87) 2.6-5.0 0.87 (0.77-0.99) 5.1-10.0 0.74 (0.64-0.85) 10.1-40.8 0.82 (0.70-0.95) p trend=0.009 Walking (METS.hours/wk), Caucasian 0 1.00 0.5-2.5 0.85 (0.74-0.98) 2.6-5.0 0.87 (0.75-1.01) 5.1-10.0 0.75 (0.64-0.89) 10.1-40.8 0.74 (0.62-0.89) p trend < 0.001 Walking (METS.hours/wk), African American 0 1.00 0.5-2.5 0.58 (0.38-0.87) 2.6-5.0 0.92 (0.68-1.24) 5.1-10.0 0.78 (0.54-1.12) 10.1-40.8 0.84 (0.59-1.21) p trend=0.478 Walking (METS.hours/wk), Hispanic 0 1.00 0.5-2.5 0.87 (0.50-1.53) 2.6-5.0 0.59 (0.32-1.08) 5.1-10.0 0.66 (0.37-1.18) 10.1-40.8 0.91 (0.51-1.62) p trend=0.644 Walking (METS.hours/wk), Asian/Pacific Islander 0 1.00 0.5-2.5 0.66 (0.30-1.44) 2.6-5.0 1.02 (0.51-2.05) 5.1-10.0 0.87 (0.41-1.85) 10.1-40.8 1.53 (0.79-2.97) p trend=0.115 Total PA (METS.hours/wk), Combined 0-2.3 1.00 2.3-7.4 0.91 (0.80-1.03) 7.5-13.9 0.80 (0.70-1.91) 14.0-23.4 0.86 (0.75-0.99) 23.5-143.0 0.78 (0.67-0.91) p trend=0.002 Total PA (METS.hours/wk), Caucasian 0-2.3 1.00 2.3-7.4 0.88 (0.76-1.01) 7.5-13.9 0.74 (0.64-0.87) 14.0-23.4 0.80 (0.68-0.94) 23.5-143.0 0.67 (0.56-0.81) p trend=0.002 Total PA (METS.hours/wk), African American 0-2.3 1.00 2.3-7.4 0.90 (0.64-1.26) 7.5-13.9 0.84 (0.61-1.18) 14.0-23.4 0.77 (0.54-1.10) 23.5-143.0 0.95 (0.66-1.37) p trend=0.150 Total PA (METS.hours/week), Hispanic 0-2.3 1.00 2.3-7.4 0.87 (0.50-1.51) 7.5-13.9 0.67 (0.38-1.20) 14.0-23.4 0.96 (0.54-1.70) 23.5-143.0 0.70 (0.36-1.37) p trend=0.721 Total PA (METS.hours/week), Asian/Pacific Isl 0-2.3 1.00 2.3-7.4 1.00 (0.49-2.07) 7.5-13.9 0.99 (0.46-2.13) 14.0-23.4 1.06 (0.50-2.27) 23.4-143.0 1.37 (0.62-3.02) p trend=0.986 |
| Hu, et al., (2003) | Nurses' Health Study (USA) N= 68,497 40-65 years of age |
Questionnaire: 1992
|
6 years age, smoking, alcohol, BMI, menopausal status, HRT, aspirin, parental history of MI, family history of diabetes, PA, glycemic load, polyunsaturated fatty acid, cereal fibre, trans fat |
Sitting watching television (hrs/wk) 0-1 1.00 2-5 1.09 (0.85-1.39) 6-20 1.30 (1.03-1.63) 21-40 1.44 (1.12-1.85) >40 1.70 (1.20-2.43) p trend < 0.001 Sitting at work, away from home, driving (hrs/wk) 0-1 1.00 2-5 0.99 (0.81-1.20) 6-20 1.10 (0.91-1.33) 21-40 1.12 (0.89-1.41) >40 1.48 (1.10-2.01) p trend=0.005 Other sitting at home i.e., not TV (hrs/wk) 0-1 1.00 2-5 0.87 (0.67-1.13) 6-20 0.98 (0.76-1.26) 21-40 0.94 (0.70-1.24) >40 1.54 (1.10-2.18) p trend=0.004 Standing/walking around home (hrs/wk) 0-1 1.00 2-5 1.13 (0.80-1.59) 6-20 1.03 (0.74-1.44) 21-40 0.88 (0.63-1.24) >40 0.83 (0.58-1.19) p trend < 0.001 Standing/walking around at work (hrs/wk) 0-1 1.00 2-5 0.92 (0.76-1.12) 6-20 0.93 (0.78-1.12) 21-40 0.93 (0.76-1.13) >40 0.94 (0.74-1.18) p trend=0.86 Combined PA and TV categories most active 1.00 most sedentary 2.89 (2.21 3.79) |
| Hu, et al., (1999) | Nurses' Health Study (USA) N= 70,102 40-65 years of age |
Questionnaire: 1986, 1988, 1992
|
8 years age, smoking, alcohol, BMI, menopausal status, HRT, aspirin, parental history of MI, history of diabetes, hypertension, hypocholesterolemia |
Total PA (MET.hrs/wk) 0-0.2 1.00 2.1-4.6 0.84 (0.72-0.97) 4.7-10.4 0.87 (0.75-1.02) 10.5-21.7 0.77 (0.65-0.91) >21.7 0.74 (0.62-0.89) p trend=0.002 Walking (MET.hrs/wk) <0.5 1.00 0.6-2.0 0.95 (0.79-1.15) 2.1-3.8 0.80 (0.65-0.99) 3.9-9.9 0.81 (0.66-1.01) >10 0.74 (0.59-0.93) p trend=0.01 Walking pace Easy 1.00 Normal 0.86 (0.73-1.01) Brisk/v. brisk 0.59 (0.47-0.73) p trend=0.01 |
| Kriska, et al., (2003) | Pima Indians (USA) N= 1,052 15-59 years of age |
Interview: 1987-2000
|
13 years (average 6 years) age, BMI |
Leisure PA (MET.hours/week) <16 1.00 >16 0.74 (0.56-0.97) p=0.03 Total PA (MET.hours/week) <16 1.00 >16 0.78 (0.60-1.02) p=0.07 |
| Weinstein, et al., (2004) | Women's Health Study (USA) 37,878 >45 years in 1992 |
Questionnaire: 1992
|
Average 6.6 years age, family history diabetes, alcohol use, smoking status, hormone therapy, hypertension, high cholesterol, dietary factors, BMI, study group |
Meeting PA guidelines (kcal/week) <1000 1.00 >1000 0.91 (0.80-1.03) Total PA (kcal/wk) <200 1.00 200-599 0.91 (0.79-1.06) 600-1499 0.86 (0.74-1.01) >1500 0.82 (0.70-0.97) p trend=0.01 Walking time (hrs/wk) No walking 1.00 <1 0.95 (0.82-1.10) 1.0-1.5 0.87 (0.73-1.02) 2.0-3.0 0.66 (0.54-0.81) >4 0.89 (0.73-1.09) p trend=0.004 |
Notes. BMI: body mass index, kcal: HRT: hormone replacement therapy, kilocalories, kg: kilogram, km: kilometers, m: miles, MET: metabolic equivalent, MI: myocardial infarction, mPA: moderate intensity physical activity, PA: physical activity, SBP: systolic blood pressure, vPA: vigorous PA
Appendix C
| Reference | Study Number & Age of Women | Physical Activity Measurement | Follow-up Period, Adjustments | Summary of Results (95% confidence interval) |
|---|---|---|---|---|
| Dempsey, et al., (2004) | OMEGA Study (USA) N= 909 18-35 years of age (n=659) >35 years of age (n=250) |
Interview: 1996-2000
Using median values as cut offs
|
7-9 months age, race, parity, prepregnancy BMI |
PA during year prior to pregnancy No PA 1.00 Any PA 0.44 (0.21–0.91) PA year prior to pregnancy (hours/wk) No PA 1.00 <4.2 0.58 (0.27–1.24) >4.2 0.24 (0.10–0.64) PA year prior to pregnancy (MET.hours/wk) Nil 1.00 <21.1 0.57 (0.27–1.21) >21.1 0.26 (0.10–0.65). PA during pregnancy No PA 1.00 Any PA 0.69 (0.37–1.29) PA during pregnancy (hours/wk) No PA 1.00 <6.0 0.49 (0.21–1.13) >6.0 0.90 (0.45–1.80) PA during pregnancy (MET.hours/wk) Nil 1.00 <28 0.71 (0.35–1.47) >28 0.67 (0.31–1.43) PA both before and during pregnancy No PA 1.00 PA last year only 0.40 (0.15-1.07) PA last week only 0.59 (0.16-2.14) PA both periods 0.31 (0.12–0.79) |
| Dye et al., 1997 | USA N= 12,290 |
Interview: 1995-96
|
9 months Age, race, parity, prepregnancy BMI, gestational weight gain, insurance coverage |
PA Any exercise 1.00 No exercise 1.00 (0.8-1.3) |
| Solomon, et al., (1997) | Nurses Health Study (USA) N= 14,613 25-42 years of age in 1989 |
Questionnaire: 1989
|
5 years age, family history of diabetes, pregravid BMI, ethnicity, parity |
Pregravid PA (METs/wk) <4 1.00 4-9.9 1.23 (0.97–1.56) 10-19.9 0.99 (0.77 – 1.27) 20-39.9 0.97 (0.76–1.25) >40 0.98 (0.75–1.28) p trend=0.26 Pregravid walking pace (km/hour) <3.2 1.00 3.2-4.7 0.97 (0.75–1.26) 4.8-6.3 0.85 (0.64–1.12) >6.4 0.85 (0.55–1.31) p trend=0.12 Pregravid vPA (frequency/week) <1 1.00 1-3 0.99 (0.63–1.34) >4 0.78 (0.47–1.26) p trend=0.63 |
Note: BMI: body mass index; km: kilometre, MET: metabolic equivalent, mPA: moderate intensity physical activity, PA: physical activity, vPA: vigorous PA.
Appendix D
| Reference | Study Number & Age of Women | Physical Activity Measurement | Follow-up Period Adjustments | Summary of Results (95% confidence interval) |
|---|---|---|---|---|
| Breslow et al., (2001) | Epidemiological Follow up Study (NHEFS) of the First National Health and Nutrition Examination Survey (USA) N= 6,160 24-75 years of age in 1971-75 |
Interview: 1971-75, 1982-84
|
10 years BMI, adult weight change, adult weight gain, education, age at menarche, parity, menstrual status, family history breast cancer |
PA level, all women Consistently low: 1.00 Moderate/inconsistent: 0.92 (0.62-1.38) Consistently high 0.58 (0.31-1.07) p trend=0.107 PA level, women aged <50 years Consistently low: 1.00 Moderate/inconsistent: 1.07 (0.46-2.51) Consistently high: 1.19 (0.43-3.30) p trend=0.732 PA level, women aged >50 years Consistently low: 1.00 Moderate/inconsistent: 0.87 (0.55-1.38) Consistently high: 0.33 (0.14-0.82) p trend=0.026 |
| Lee, Rexrode, Cook, Hennekens et al., (2001) | Women's Health Study (USA) N= 39,322 >45 years of age |
Questionnaire: 1992-95
|
Average 2 years BMI, alcohol, menarche age, age at first pregnancy lasting >6mo, number of pregnancies lasting >6mo, oral contraceptive, post menopausal hormones, family history of breast cancer |
PA (kj/wk), all women <840: 1.00 840-2519 1.04 (0.77-1.40) 2520-6299 0.86 (0.64-1.17) >6300 0.80 (0.58-1.12) p trend=0.11 vPA (kj/wk), all women none: 1.00 1-839: 1.02 (0.70-1.48) 840-2099: 1.11 (0.78-1.58) 2100-4199: 0.97 (0.66-1.44) >4200 0.98 (0.69-1.40) p trend=0.9 PA (kj/wk), post menopausal women <840: 1.00 840-2519: 0.97 (0.68-1.39) 2520-6299: 0.78 (0.54-1.12) >6300 0.67 (0.44-1.02) p trend=0.03 vPA (kj/wk), post menopausal women none: 1.00 1-839: 0.93 (0.57-1.50) 840-2099: 0.91 (0.57-1.47) 2100-4199: 0.93 (0.57-1.50) >4200 0.76 (0.47-1.24) p trend=0.29 |
| Luoto, et al., (2000) | Finnish Adult Health Behaviour Survey (Finland) N= 30,548 15-64 years of age |
Questionnaire: annually 1978-93 (not 1985)
|
<16 years education, parity and age at first birth, BMI |
Leisure PA (x/wk), all women <1: 1.00 1: 0.80 (0.58-1.10) 2-3: 0.92 (0.78-1.22) Daily: 1.01 (0.72-1.42) Commuting PA, all women No work/at home: 1.00 No PA, car: 0.94 (0.66-1.34) <30 mins/day 0.89 (0.67-1.18) >30 mins/day 0.87 (0.62-1.24) PA level (LTPA and commuting PA) Most active 1.00 Least active 1.01 (0.80-1.29) Leisure PA (x/wk), aged <50 years <1: 1.00 1: 0.98 (0.61-1.58) 2-3 0.92 (0.58-1.44) Daily 1.25 (0.70-1.22) Commuting PA, aged <50 years No work/at home: 1.00 No PA, car: 1.11 (0.66-1.89) <30 mins/day: 1.07 (0.60-1.68) >30 mins/day: 0.72 (0.38-1.36) Leisure PA (x/wk), aged >50 years <1: 1.00 1: 0.71 (0.46-1.10) 2-3: 0.96 (0.68-1.36) Daily: 0.97 (0.65-1.44) Commuting PA, aged >50 years No work/at home 1.00 No PA. car 0.88 (0.55-1.39) <30 mins/day 0.84 (0.60-1.16) >30 mins/day 1.10 (0.69-1.50) |
| McTiernanet al., (2003) | Women's Health Initiative Observational Study (USA) N= 74,171 50-79 years of age in 1993 |
Questionnaire: 1993-8
|
Approx 6 years Mean 4.7 years 1993-1998 age, BMI, HRT, race, geographic region, income, education, ever breastfed, hysterectomy status, family history breast cancer, smoking, parity, age at first birth, mammogram frequency, alcohol, menarche age, menopause age. |
vPA >3x/week at 18 years of age no 1.00 yes 0.94 (0.85-1.04) p=0.21 vPA >3x/week at 35 years of age no 1.00 yes 0.86 (0.78-0.95) p=0.003 vPA >3x/week at 50 years of age no 1.00 yes 0.92 (0.83-1.01) p=0.08 Total PA (MET.hr/wk) None 1.00 <5: 0.90 (0.77-1.07) 5.1-10: 0.82 (0.68-0.97) 10.1-20: 0.89 (0.76-1.00) 21.1-40 0.83 (0.70-0.98) >40 0.78 (0.62-1.00) p trend=0.03 mPA + vPA (hrs/wk) none 1.00 <1: 0.92 (0.78–1.10) 1.1-2: 0.91 (0.79-1.10) 2.1-3: 0.94 (0.81-1.10) 3.1-4: 0.99 (0.83-1.20) 4.1-7 0.91 (0.78-1.10) >7 0.79 (0.63-0.99) p trend=0.12 vPA (hrs/wk) None 1.00 <1: 0.94 (0.80-1.10) 1.1-2: 0.95 (0.80-1.10) 2.1-4: 0.93 (0.78-1.10) >4 0.91: (0.67-1.20) p trend=0.25 |
| Moore, et al., (2000) | Iowa Women's Health Study (USA) N= 37,105 55-69 years of age in 1986 |
Questionnaire: 1986
|
9 years age, age at menopause, age at first live birth, BMI at age 18years, education, family history of breast cancer, estrogen, waist to hip ratio, BMI, BMI squared |
PA level Low 1.00 Medium 1.12 (0.99-1.28) High 0.95 (0.83-1.10) Any regular PA No 1.00 Yes 0.99 (0.89-1.11) mPA frequency rarely/never 1.00 few x/month 1.03 (0.88-1.20) 2-4 x/wk 1.08 (0.92-1.26) >4 x/wk 0.92 (0.77-1.10) vPA frequency rarely/never 1.00 few x/month 1.25 (1.04-1.50) 2-4 x/wk 1.14 (0.92-1.43) >4 x/wk 1.05 (0.72-1.52) |
| Rockhill, et al., (1998) | Nurses Health Study (USA) N= 104,468 25-42years of age in 1989 |
Questionnaire: 1989
|
6 years baseline age, menarche age, history of benign breast disease, family history breast cancer, alcohol, height, oral contraceptive, parity and age of first birth |
vPA frequency during high school and at age 1822 years (months/year) never 1.0 1-3: 0.9 (0.6-1.2) 4-6: 1.1 (0.8-1.4) 7-9: 1.1 (0.8-1.5) 10-12: 1.1 (0.8-1.6) mPA + vPA + walking (hrs/wk) <1: 1.0 1.0-1.9: 1.1 (0.8-1.4) 2.0-3.0: 1.1 (0.8-1.4) 4.0-6.9: 1.0 (0.7-1.4) >7 1.1 (0.8-1.5) |
| Rockhill, et al., (1999) | Nurses Health Study (USA) N= 85,364 (1980 data) N= 77, 024 (1986 data) 30-55 years of age in 1976 |
Questionnaire • 1980: Average hours/week in recreational moderate and vigorous PA including gardening, vigorous sports, jogging, brisk walking, bicycling, heavy housework etc • 1982: average hours/week of strenuous PA • 1986, 1988, 1992, 1994: average time/year in walking/hiking, jogging, running, cycling, lap swimming, tennis/squash, aerobics, rowing machine • 1986, 1988, 1992, 1994: Usual walking pace (excluded if not brisk) • Cumulative average of vigorous PA or moderate PA updated every two years 19801994 (hours/week) • Vigorous PA or moderate PA at 1980 baseline (hours/week) • Cumulative average vigorous PA 1986-1994 (hours/week) |
16 years baseline age, menarche age, history benign breast disease, family history breast cancer, height, parity and age first birth, BMI at 18yrs, menopausal status, post menopausal hormone use. |
Cumulative average vPA or mPA (hrs/wk) <1.0 1.00 1.0-1.9: 0.88 (0.79-0.98) 2.0-3.9: 0.89 (0.81-0.99) 4.0-6.0: 0.85 (0.77-0.94) >7.0 0.82 (0.70-0.97) p trend=0.004 vPA or mPA at 1980 (hrs/wk) <1: 1.00 1.0-1.9: 1.03 (0.90-1.17) 2.0-3.9: 0.97 (0.88-1.07) 4.0-6.0: 0.90 (0.80-1.01) >7.0 0.89 (0.80-0.98) p trend=0.004 vPA 1986-1994 (hrs/wk) <1.0: 1.00 1.0-1.9: 0.95 (0.83-1.09) 2.0-3.9: 0.85 (0.71-1.03) 4.0-6.0: 0.90 (0.70-1.16) >7.0 0.87 (0.71-1.06) p trend=0.11 |
| Sesso et al., (1998) | Pennsylvania College Alumni Health Study (US) N= 1,566 37-69 years of age Mean age 45.5 years |
Questionnaire: 1962
|
31 years age, BMI |
Total PA (kcal/wk), all women <500: 1.00 500-999: 0.92 (0.58-1.45) >1000: 0.73 (0.46-1.14) p trend=0.17 Total PA (kcal/wk), <55 years of age <500 1.00 500-999: 0.81 (0.27-2.47) >1000 1.83 (0.77-4.31) p trend=0.41 Total PA (kcal/wk), >55 years of age (kcal/wk) <500: 1.00 500-999: 0.95 (0.58-1.57) >1000: 0.49 (0.28-0.86) p trend=0.015 |
| Tehard, et al., (2006) | E3N Study (France) 90,059 40-65 years of age in 1990 |
Questionnaire: 1990-1
|
12 years BMI, menopausal status, hormone replacement therapy, age at menarche, age at first full term pregnancy, parity, marital status, use of oral contraceptives, family history of breast cancer, personal history of benign breast disease employment |
Walking (m/day) <500: 1.00 500-2000: 1.03 (0.95-1.11) >2000: 0.91 (0.81-1.02) p trend=0.45 Stairs climbed (number/day) 0: 1.00 1-4: 0.99 (0.90-1.08) >5 1.00 (0.90-1.12) p trend=0.84 Light household PA (hrs/wk) 0: 1.00 1-4: 1.02 (0.82-1.28) 5-13: 0.95 (0.75-1.20) >14 0.82 (0.61-1.11) p trend <0.05 Heavy household PA (hrs/wk) inactive 1.00 1-2: 0.98 (0.89-1.07) 3-4: 0.94 (0.84-1.06) >5 0.97 (0.81-1.15) p trend=0.47 mPA (hrs/wk) inactive 1.00 0: 0.80 (0.60-1.05) 1-4: 0.87 (0.79-0.94) 5-13: 0.86 (0.74-0.99) >14 0.89 (0.65-1.24) p trend <0.01 vPA (hrs/wk) inactive 1.00 0: 0.90 (0.81-0.99) 1-2: 0.88 (0.79-0.97) 3-4: 0.82 (0.71 – 0.95) >5 0.62 (0.49-0.78) p trend <0.0001. Total recreational PA (MET.hrs/wk) inactive 1.00 <16: 0.82 (0.71-0.93) 16-22.3: 0.94 (0.84-1.06) 22.3-33.8: 0.88 (0.79-0.98) >33: .8 0.81 (0.72-0.92) p trend <0.01 Total PA (MET.hrs/wk) <28.3: 1.00 28.3-41.8: 1.05 (0.93-1.17) 41.8-57.8: 0.94 (0.83-1.05) > 57.8 0.90 (0.80-1.02) p trend <0.05 |
| Thune, et al., (1997) | National Health Screening Service (Norway) N=25,624 20–54 years of age in 1974-1978 |
Questionnaire: 1974-78, 1977-83
|
1994 Median follow up of 13.7 years age, BMI, height, parity, county of residence, number of children . |
Leisure PA level (1st survey) Sedentary 1.00 Moderate 0.93 (0.71-1.22) Regular exercise 0.63 (0.42-0.95) p trend=0.04 Occupational PA (1stsurvey) Sedentary 1.00 Walking 0.84 (0.63-1.12) Lifting & walking 0.74 (0.52-1.06) Heavy labour 0.48 (0.25-0.92) p trend=0.02 Leisure PA level (1st survey), premenopausal women Sedentary 1.00 Moderate 0.77 (0.46-1.27) Regular exercise 0.53 (0.25-1.14) p trend=0.10 Leisure PA level, occupational PA, (1st survey) Sedentary 1.00 Walking 0.82 (0.50-1.34) Lifting & walking 0.48 (0.24-0.95) p trend=0.03 Leisure PA (1st survey), post menopausal women Sedentary 1.00 Moderate 1.00 (0.72-1.39) Regular exercise 0.67 (0.41-1.10) p trend=0.15 Leisure PA (1st survey), occupational PA (1 stsurvey) Sedentary 1.00 Moderate 0.87 (0.61-1.24) Regular exercise 0.78 (0.52-1.18) p trend=0.24 Leisure PA (comparing surveys) consistently sedentary 1.00 moderately active 0.90 (0.61-1.32) consistently active 0.67 (0.40-1.10) p trend=0.09 |
Notes. BMI: body mass index, HRT: hormone replacement therapy, kcal: kilocalories, kj: kilojoules, kg: kilogram, km: kilometers, m: miles, MET: metabolic equivalent, mPA: moderate intensity physical activity, PA: physical activity, vPA: vigorous PA
Appendix E
| Reference | Study Number & Age of Women | Physical Activity Measurement | Outcome Follow-up Period Adjustments | Summary of Results (95% confidence interval) |
|---|---|---|---|---|
| Chao, et al., (2004) | Cancer Prevention Study II Nutrition Cohort (USA) N= 80,771 50-74 years of age in 1992 Median age 63 years |
Questionnaire (1992-3)
|
Incident colon and rectal cancer, 1997, 1999 7 years age, education, historical PA, smoking, alcohol use, red meat, folate, fibre, multivitamins, HRT |
Any PA No: 1.00 Yes: 0.98 (0.70-1.37) PA time (hours/week) None: 1.00 <2: 1.01 (0.70-1.44) 2-3: 1.01 (0.68-1.49) 4-6: 0.97 (0.66-1.43) 7: 1.03 (0.65-1.65) > 8: 0.65 (0.39-1.11) p trend=0.14 PA (MET.hrs/week) None: 1.00 >7: 1.02 (0.71-1.46) 7-13: 0.98 (0.65-1.47) 14-23: 1.00 (0.68-1.47) 24-29: 0.94 (0.60-1.48) >30 0.77 (0.48-1.24) p trend=0.15 Walking time (hrs/wk) No activity: 1.00 <4: 1.00 (0.70-1.44) 4-6: 1.08 (0.71-1.63) > 7: 1.18 (0.71-1.95) p trend=0.41 Walking + other PA time (hrs/wk) No activity: 1.00 <4: 0.99 (0.67-1.47) 4-6: 0.72 (0.43-1.19) >7 0.59 (0.36-0.98) p trend=0.07 |
| Lund Nilsen & Vatten (2001) | Nord-Trondelag Health Survey (Norway) N= 38,244 >20 years of age in 1984-86 |
Questionnaire • How often do you exercise • How long do your exercise • How hard do you exercise • PA frequency (x/week) • PA index based on frequency, intensity, and duration (tertiles) (no values) |
Incident cancer Metastatic cancer 12 years (1995) age, BMI, diabetes, blood glucose, marital status, education |
PA frequency (x/week) for incident cancer <1: 1.00 1-3: 0.81 (0.62-1.05) >3: 1.12 (0.83-1.52) p=0.85 PA index for incident cancer Lowest tertile 1.00 2nd tertile: 0.95 (0.68-1.33) Highest tertile 0.81 (0.54-1.23) p=0.34 PA frequency (x/week) for metastatic cancer <1: 1.00 1-3: 0.71 (0.49-1.04) >3 0.95 (0.61-1.47) p=0.47 PA index for metastatic cancer Lowest tertile 1.00 2nd tertile 0.73 (0.44-1.22) Highest tertile 0.77 (0.43-1.38) p=0.34 |
| Martinez, et al., (1997) | Nurses Health Study (USA) N= 67,802 30-55 years of age in 1976 |
Questionnaire (1986): leisure
|
6 years 1986-1992 age, smoking, family history colorectal cancer, BMI, postmenopausal hormone use, aspirin, red meat intake, alcohol |
PA (MET.hrs/wk) <2: 1.00 2-4: 0.71 (0.44-1.15) 5-10: 0.78 (0.50-1.20) 11-21: 0.67 (0.42-1.07) >21 0.54 (0.33-0.90) p trend=0.03 mPA time (hrs/day) <1: 1.00 >1: 0.69 (0.52-0.90) vPA time (mins/day) <30: 1.00 >30: 0.61 (0.43-0.86) LPA time (hrs/day) <1:1.00 >1 1.54 (0.94-2.50) |
Notes. BMI: body mass index, hr: hour, HRT: hormone replacement therapy, LPA: light physical activity, MET: metabolic equivalent, mPA: moderate intensity physical activity, PA: physical activity, vPA: vigorous PA, wk: week
Appendix F
| Reference | Study Number & Age of Women | Physical Activity Measurement | Outcome Follow-up Period Adjustments | Summary of Results (95% confidence interval) |
|---|---|---|---|---|
| Anderson, et al., (2004) | Iowa Women's Health Study (USA) N= 31,381 55-69 years of age in 1986 |
Questionnaire: 1986
|
Ovarian cancer 15 years age, family history of ovarian cancer, hysterectomy status, number live births, years smoking, estrogen replacement therapy |
Regular PA No 1.00 Yes 1.24 (0.94-1.63) p trend=0.12 PA level (/wk) Low 1.00 Medium 1.14 (0.81-1.60) High 1.42 (1.03-1.97) p trend=0.03 mPA (/wk) rarely/never 1.00 1: 0.75 (0.50-1.14) 2-4: 0.98 (0.66-1.44) >4 1.17 (0.78-1.75) p trend=0.26 vPA (/wk) rarely/never 1.00 1: 0.84 (0.50-1.43) 2-4: 1.03 (0.58-1.80) >4 2.38 (1.29-4.38) p trend < 0.01 |
| Bertone, et al., (2001) | Nurses Health Study (USA) N=92,825 30–55 years of age in 1976 |
Questionnaire: 1980 • hours/weekday and /weekend in vigorous PA (e.g., vigorous sport, brisk walking, hill bicycling) and moderate PA (e.g., level bicycling, walking, light sport) • type and frequency/week of exercise producing a sweat Questionnaire: 1986, 1988, 1992, 1994 • time/week jogging, running, bicycling, lap swimming, racket sports, aerobics, walking/hiking • usual walking pace • number flights of stairs climbed daily Questionnaire: 1994 • time/week lower intensity PA e.g., yoga, stretching • time/week in other vPA e.g. mowing lawn • PA level 1980, 1986-1996, 1986, average 1980-1986 (hours/week) • PA level 1980 intensity and frequency: low (not sweating), mPA (<5METs), vPA (>5 METS) • Total PA energy expenditure cumulative average 19861996 (MET.hours/week) • Total PA energy expenditure 1986 only (MET.hours/week) |
Ovarian cancer 16 years age, parity, oral contraception, tubal ligation, menarche age, hormone use, menopause, smoking |
1980-1996 cumulative average (hrs/wk) <1.00: 1.00 1-<2: 0.80 (0.59-1.08) 2-<4: 0.86 (0.65-1.15) 4-<7 1.10 (0.82-1.49) >7: 0.80 (0.49-1.32) p=0.59 1980 only (hrs/wk) <1: 1.00 1-<2: 0.75 (0.56-1.02) 2-<4: 0.86 (0.61-1.20) 4-<7 1.01 (0.73-1.40) >7: 0.92 (0.62-1.36) p=0.74 1986-1996 cumulative average (hrs/wk) <1: 1.00 1-<2: 1.13 (0.77-1.65) 2-<4: 1.10 (0.76-1.60) 4-<7: 0.98 (0.64-1.50) >7: 1.26 (0.80-1.97) p=0.59 1996 only (hrs/wk) <1: 1.00 1-<2 1.41 (0.94-2.11) 2-<4 1.23 (0.81-1.85) 4-<7 1.12 (0.69-1.84) >7: 1.64 (1.05-2.58) p=0.13 PA average 1980-1986 (hrs/wk) <1: 1.00 1-<2: 0.72 (0.48-1.08) 2-<4: 1.00 (0.70-1.43) 4-<7: 0.97 (0.64-1.45) >7 1.46 (0.82-2.60) p=0.18 PA level 1980 (intensity and frequency) Low 1.00 mPA, <2 x/wk: 0.57 (0.36-0.92) mPA, 3-4 x/wk: 1.35 (0.89-2.03) mPA, >4 x/wk 0.94 (0.57-1.54) p trend=0.93 vPA, <2 x/wk: 1.05 (0.68-1.63) vPA, 3-4 x/wk: 1.58 (1.05-2.38) vPA, >4 x/wk 1.48 (0.89-2.48) p trend=0.03 Total PA cumulative average 1986-1996 (MET.hrs/wk) 0-<2.5: 1.00 2.5-<5.0: 1.42 (0.86-2.34) 5.0-<10: 1.34 (0.83-2.17) 10-<20: 1.32 (0.83-2.10) 30-<30: 1.84 (1.12-3.02) >30 1.27 (0.75-2.14) p trend=0.52 Total PA energy expenditure 1986 only (MET.hrs/wk) 0-<2.5: 1.00 2.5-<5: 1.11 (0.75-1.66) 5-<10: 1.30 (0.89-1.90) 10-<20: 1.02 (0.68-1.51) 20-<30: 1.41 (0.90-2.18) >30 1.16 (0.75-1.80) p=0.48 |
| Gregg, et al., (2003) | Study of Osteoporotic Fractures (USA) N= 7,553 >65 years of age |
Questionnaire: 1986-1988, 1992-1994 (median period 5.7 years)
|
Cancer mortality 12.5 years age, smoking, BMI, stroke, diabetes, hypertension, self rated health at baseline, cancer, chronic obstructive pulmonary disease, incident hip fracture |
Total PA (kcal/wk) <163: 1.00 163-503: 0.77 (0.60-0.97) 504-1045: 0.90 (0.71-1.13) 1046-1906: 0.62 (0.48-0.81) >1907 0.85 (0.67-1.09) Walking (kcal/wk) <70: 1.00 70-186: 1.08 (0.85-1.36) 187-419: 0.89 (0.69-1.15) 420-897: 0.90 (0.70-1.16) >898 0.85 (0.65-1.10) PA change Sedentary-sedentary 1.00 Sedentary-active 0.49 (0.29-0.84) Active-sedentary 0.61 (0.42-0.90) Active-active 0.82 (0.58-1.16) |
| Kushi, et al., (1997) | Iowa Women's Health Study (USA) N= 32,763 55-69 years in 1985 |
Questionnaire: 1986
|
Cancer mortality 7 years age at baseline, age at menarche, age at menopause, age at first live birth, parity, alcohol, total energy intake, smoking, estrogen, BMI at baseline, BMI at age 18, waist to hip ratio, education, marital status, family history cancer |
Daily PA no 1.00 yes 0.93 (0.76-1.14) mPA frequency rarely/never 1.00 few/month-1 x/wk 0.79 (0.60-1.03) 2-4 x/wk 0.80 (0.61-1.05) >4 x/wk 0.85 (0.63-1.15) p trend=0.33 vPA frequency rarely/never 1.00 few/month-1 x/wk 1.09 (0.77-1.53) 2-4 x/wk 0.83 (0.52-1.33) >4 x/wk 0.69 (0.31-1.54) p trend=0.28 PA level Low 1.00 Medium 0.92 (0.72-1.16) High 0.94 (0.73-1.21) p trend=0.64 |
| Michaud, et al., et al., (2001) | Nurses Health Study (USA) N= 117, 041 30-55 years of age |
Questionnaire: 1986
|
Pancreatic cancer 10-20 years height, age group, smoking, diabetes history, cholecystectomy, protein intake, dietary fruit and vegetables, coffee, fat intake. |
Total PA (MET.hrs/wk) <2.8 1.00 2.9-7.7: 1.00 (0.56-1.77) 7.8-16.9: 0.84 (0.46-1.55) 17.0-33.9: 0.84 (0.45-1.65) >34.0 0.78 (0.42-1.47) p trend=0.40 vPA (MET.hours/wk) 0: 1.00 0.2-1.6: 0.66 (0.34-1.29) 1.7-6.9: 0.64 (0.31-1.35) 7.0-15.9: 0.76 (0.41-1.43) >16: 1.06 (0.57-1.96) p trend=0.80 mPA (MET.hours/wk) <0.9: 1.00 0.9-2.6: 1.01 (0.56-1.81) 2.7-4.4: 0.85 (0.47-1.55) 4.5-10.7: 0.85 (0.46-1.57) >10.8: 0.52 (0.25-1.05) p trend=0.05 Walking/hiking (/wk) <20mins 1.00 20-80mins 0.79 (0.48-1.30) 1.5-3.0 hrs 0.65 (0.38-1.13) >4hrs 0.48 (0.24-0.97) p trend=0.04 |
| Moradi, et al., (1998) | National Census (Sweden) N= 253,356 11-106 years of age in 1971 |
Census data: 1960, 1970
|
Endometrial cancer 18 years age at follow up, place of residence, year of follow up, socioeconomic status |
Occupational PA 1960 Very high/high 1.00 Medium 1.03 (0.94-1.13) Light 1.05 (0.94-1.16) Sedentary 1.13 (0.99-1.29) p trend=0.11 Occupational PA 1970 Very high/high 1.00 Medium 1.02 (0.95-1.10) Light 1.16 (1.05-1.27) Sedentary 1.32 (1.17-1.50) p trend <0.001 Occupational PA same in 1960 and 1970 Very high/high 1.00 Medium 1.04 (0.89-1.22) Light 1.11 (0.94-1.31) Sedentary 1.30 (1.03-1.65) p trend=0.04 |
| Patel, et al., (2005) | American Cancer Society Cancer Prevention Study II Nutrition Cohort (USA) N= 76,038 50-74 years of age in 1992 |
Questionnaire: 1982
|
Pancreatic cancer 7 years age, smoking, years since quitting smoking, education, family history pancreatic cancer, history gallbladder disease, history diabetes, total caloric intake, baseline PA (1992) |
Total PA (MET.hrs/wk) None 1.00 >0-7: 1.00 (0.52-1.91) >7-17.5: 0.62 (0.30-1.25) >17.5-31.5: 0.92 (0.44-1.89) >31.5: 1.42 (0.59-3.41) p trend=0.73 Total PA at 40 years of age (MET.hrs/wk) None 1.00 >0-7: 1.15 (0.64-2.07) >7-17.5: 0.77 (0.41-1.46) >17.5-31.5: 0.77 (0.38-1.53) >31.5: 0.94 (0.44-2.03) p trend=0.38 Exercise in 1982 None/slight 1.00 Moderate 0.84 (0.54-1.29) Heavy 0.97 (0.40-2.35) p trend=0.59 |
| Rockhill, et al., (2001) | Nurses Health Study (USA) N= 80, 348 30-55 years of age in 1976 |
Questionnaire: 1980, 1982, 1986, 1988, 1992
|
Cancer mortality 14 years age at baseline, smoking, recent alcohol, height, BMI, post menopausal hormone use |
PA (hours/week) <1: 1.00 1-1.9: 0.92 (0.83-1.02) 2.0-3.9: 0.85 (0.76-0.94) 4.0-6.9: 0.95 (0.85-1.07) >7.0: 0.87 (0.72-1.04) p trend=0.25 |
| Sinner, et al., (2005) | Iowa Women's Health Study (USA) N=41,836 55-69 years of age in 1985 | Questionnaire: 1986 • any daily leisure time PA (not occupational or domestic) to keep physically fit • frequency and duration of moderate PA (including gardening and walks) • frequency and duration of vigorous PA • Daily PA • Moderate PA frequency • Vigorous PA frequency • PA level: low (vPA <1x/week or mPA <1x/week), medium (vPA 1x/week or mPA 14x/week), high (vPA >2x/week or mPA >4x/week) |
Pancreatic cancer 12 years age, smoking, multivitamin |
Daily PA No 1.00 Yes 1.08 (0.81-1.42) mPA frequency rarely/never, few: 1.00 1 x/wk, few x/month 1.06 (0.71-1.58) > 2 x/wk 1.14 (0.79-1.65) vPA frequency rarely/never, few 1.00 1 x/wk, few x/mo 1.02 (0.63-1.66) >2 x/wk 0.93 (0.55-1.57) PA level Low 1.00 Medium 0.88 (0.62-1.24) High 1.29 (0.93-1.77) |
| Terry, et al., (1999) | Swedish Twin Registry (Sweden) N= 11, 659 Born 1886-1925 |
Questionnaire: 1967
|
Endometrial cancer 25 years age, weight, parity |
PA Hardly any 1.00 Light 0.5 (0.4-0.8) Regular 0.6 (0.2-1.7) Hard 0.1 (0.04-0.6) p trend=<0.01 |
| Thune & Lund (1997) | Norway N=28,274 20-49 years of age between 19721978 |
Questionnaire: 1972-1978
|
Lung cancer 13-19 years age |
Occupational PA Sedentary 1.00 Walking 0.81 (0.37-1.76) Lifting 0.79 (0.30-2.12) p trend=0.03 Leisure PA Sedentary 1.00 Moderate 0.91 (0.48-1.71) Regular 0.99 (0.35-2.78) p trend=0.88 Occupational PA + LTPA Sedentary 1.00 Any PA 0.87 (0.21-3.62) |
| Tripathi et al., (2002) | Iowa Women's Health Study (USA) N=37,459 55-69 years of age in 1986 |
Questionnaire: 1986
|
Bladder carcinoma 13 years Age, smoking, diabetes, BMI, alcohol, marital status, occupation |
Regular PA No 1.00 Yes 0.59 (0.40-0.89) p < 0.05 PA level Low 1.00 Medium 0.62 (0.38-1.00) High 0.73 (0.46-1.17) Regular PA No 1.00 Yes 0.66 (0.43-1.01) p < 0.05 |
| van Dijk, et al., (2004) | Netherlands Cohort study on Diet and Cancer (Netherlands) 62,573 5-69 years in 1986 |
Questionnaire: 1986
|
Renal cell carcinoma Average 9.3 years follow up age, smoking, energy intake, BMI |
PA minutes/day <30: 1.00 30-60: 1.13 (0.59-2.15) 60-90: 1.43 (0.73-2.79) >90 1.13 (0.56-2.29) p trend=0.55 |
Note: BMI: body mass index, hrs: hours, kcal: kilocalories, mPA: moderate PA, PA: physical activity, vPA: vigorous PA, wk: week
Appendix G
| Reference | Study Number & Age of Women | Physical Activity Measurement | Outcome Follow-up Period Adjustments | Summary of Results (95% confidence interval) |
|---|---|---|---|---|
| Brown et al., (2005) | Australian Longitudinal Study on Women's Health (Australia) N=9207 45–50 years of age in 1996 |
Questionnaire: 1996, 1998, 2001
|
Depressive symptoms Poor mental health Approx 5 years country of birth; education, marital status, occupation, area of residence, smoking status, BMI, menopause status, baseline depression, chronic health conditions |
Depressive symptoms mean score by previous PA <440 6.4 (6.2-6.6) 440-1000 6.0 (5.8-6.2) 1000-1760 5.8 (5.6-6.0) >1760 5.6 (5.4-5.8) Depressive symptoms mean score by habitual PA <680 6.7 (6.5-7.0) 680-<1600 6.0 (5.8-6.2) 1600-<2960 5.8 (5.6-6.0) >2960 5.4 (5.3-5.6) Mental health score mean by previous PA <440 72.5 (71.8-73.8) 440-1000 74.5 (73.9-75.2) 1000-1760 75.5 (74.8-76.2) >1760 75.9 (75.3-76.5) Mental health score mean score by habitual PA <680 71.7 (70.9-72.4) 680-<1600 74.3 (73.6-74.9) 1600-<2960 75.2 (74.5-75.8) >2960 76.7 (76.0-77.4) Depressive symptoms by change in PA Very low- <240 1.00 Very low – (240-<600) 0.88 (0.67–1.14) Very low – >600 0.78 (0.61–1.01) Mental Health score by change in PA Very low - <240 1.00 Very low – (240- <600) 0.76 (0.56–1.02) Very low - >600 0.64 (0.47–0.85) |
| Guthrie et al., (1997) | Melbourne Women's Midlife Health Project (Australia) N=292 45–55 years of age in 1991 (mean 48.9) |
Questionnaire: 1991
|
Well-being 3 years Baseline variables including health, stress, BMI, HDL-C, LDL-C |
Change in PA positively associated with change in wellbeing (ß=0.000068, SE=0.000038, p=0.08) |
| Hebert et al., (2000) | Canadian Study of Health and Aging (Canada) N=5747 > 65 years in 1990 |
Questionnaire: 1990-1991
|
Vascular dementia 5 years Age and region |
Regular exercise No 1.00 Yes 0.46 (0.25–0.82). |
| Kritz-Silverstein et al., (2001) | The Rancho Bernardo Study (USA) N=540 58–89 years of age in 1984-1987 |
Interview: 1984-198
|
Depressive symptoms 8 years Age, BMI, smoking, alcohol consumption, estrogen replacement therapy, social support |
Depression score by regular strenuous exercise status No 5.4 Yes 4.9 F=2.07 ns Depression score by 3x/wk exercise status No 5.6 Yes 5.2 F=0.90 ns Change in depression score by regular strenuous exercise status No -0.71 Yes -0.91 F=0.33 ns Change in depression score by 3x/wk exercise status No -0.68 Yes -0.02 F=0.06 ns Mean depression score by regular strenuous exercise status baseline and follow up yes/yes 4.55 no/yes 4.45 yes/no 4.90 no/no 5.72 p <0.08 Mean depression score by regular strenuous exercise status baseline and follow up yes/yes 5.26 no/yes 5.55 yes/no 5.61 no/no 5.85 p=ns |
| Laurin et al., (2001) | Canadian Study of Health and Aging (Canada) N=3391 > 65 years of age in 1990 |
Questionnaire: 1991-1992 • Frequency (>3x/wk, wkly, <wkly) and intensity (low, moderate, high) of exercise • Composite PA score reflecting frequency and intensity: high PA (>3 x/wk at intensity >walking); moderate PA (> 3x/wk intensity=walking); low PA (<3 x/wk); no PA* |
Cognitive impairment Alzheimer's disease Dementia any type Cognitive loss 5 years Age, education, family history of dementia, regular smoking, regular alcohol consumption, nonsteriosal anti inflammatory drugs, activities of daily living, instrumental activities of daily living, chronic disease |
cognitive impairment (not dementia) none 1.00 <3x/wk 0.69 (0.41–1.16) >3x/wk, walk 0.55 (0.36–0.82) >3 x/wk, >walk 0.47 (0.25–0.90) p trend=0.003. Alzheimer's disease none 1.00 <3x/wk 0.70 (0.33–1.49) >3x/wk, walk 0.87 (0.51–1.48) >3 x/wk, >walk 0.27 (0.08–0.90) p trend=0.05 Dementia none 1.00 <3x/wk 0.63 (0.32–1.25) >3x/wk, walk 0.67 (0.55–1.39) >3 x/wk, >walk 0.55 (0.25–1.21) p trend=0.18 Cognitive loss none 1.00 <3x/wk 1.06 (0.78– 1.45) >3x/wk, walk 0.92 (0.72– 1.17) >3 x/wk, >walk 0.58 (0.40–0.82) p trend=0.01 |
| Lee & Russell (2003) | Australian Longitudinal Study on Women's Health (Australia) N=6472 70–75 years of age in 1996 |
Questionnaire 1996
|
Mental health Vitality Social functioning Emotional role functioning 4 years baseline PA, SF-36, marital status, BMI, recent life events |
Mean change in mental health Sedentary 0.26 Cessation 0.14 Adoption 0.73 Maintenance 0.44 p=0.455 Mean change in vitality Sedentary -5.23 Cessation -7.21* Adoption -1.70* Maintenance -1.71* p <0.001 * mean significantly different from none/very low PA category Mean change in social functioning Sedentary -5.19 Cessation -8.51* Adoption 1.25* Maintenance 0.87* p <0.001 * mean significantly different from none/very low PA category Mean change in emotional role functioning Sedentary -5.81 Cessation -3.51 Adoption -1.30* Maintenance 0.37* p <0.001 * mean significantly different from none/very low PA category Mean change in total mental health score Sedentary -0.12 Cessation -0.56 Adoption 1.38* Maintenance 0.71 p=0.002 * mean significantly different from none/very low PA category |
| Pignatti et al., (2002) | (Brescia, Italy) N=282 70–75 years of age |
Questionnaire
|
Cognitive decline Cognitive functioning 12 years Baseline cognitive functioning |
Cognitive decline high PA 17% low PA 40% p=0.02 Cognitive functioning score at baseline, follow up high PA 9.7 + 0.5 to 8.9 + 1.0; p=0.004 low PA 9.3 + 0.8 to 7.9 + 2.1; p <0.001 Cognitive decline high PA 1.00 low PA 3.7 (1.2–11.1) |
| Suutama & Ruoppila (1998) | Evergreen Project (Finland) N=84-110 born 1914 Aged 75 years in 1989 N=37-61 born 1910 aged 80 years in 1989 |
Interview: 1989
|
Cognitive score Reaction time 5 years |
Among cohort born 1914
Among cohort born 1914
|
| Weuve et al., (2004) | Nurses' Health Study (USA) N=18,766 70–81 years of age |
Questionnaire: 1995-2001
|
Cognitive status Category fluency Working memory and attention Verbal memory Global cognitive functioning Mean 1.8 years Age, education, husband's education, alcohol use, smoking status, aspirin use, vitamin E use, balance problems, health limitations for walking, osteoarthritis, emphysema or chronic bronchitis, fatigue, poor mental health, antidepressant use, moderate-severe bodily pain |
Mean difference in change in cognitive status <5.2 1.00 5.2–10.0 0.17 (0.05-0.30) 10.1–16.2 0.17 (0.04-0.29) 16.3–26.0 0.28 (0.15-0.41) >26.0 0.34 (0.21-0.47) p <0.001 Mean difference in change in category fluency <5.2 1.00 5.2–10.0 0.04 (-0.16-0.25) 10.1–16.2 0.07 (-0.13-0.29) 16.3–26.0 0.18 (-0.03-0.39) >26.0 0.19 (-0.02-0.40) p=0.05 Mean difference in change in working memory and attention <5.2 1.00 5.2–10.0 0.12 (0.01-0.23) 10.1–16.2 0.13 (0.02-0.24) 16.3–26.0 0.20 (0.08-0.31) >26.0 0.25 (0.13-0.36) p <0.001 Mean difference in change in verbal memory <5.2 1.00 5.2–10.0 0.04 (0.00-0.07) 10.1–16.2 0.01 (-0.02-0.04) 16.3–26.0 0.04 (0.01-0.08) >26.0 0.07 (0.04-0.11) p <0.001 Mean difference in change in global cognitive functioning <5.2 1.00 5.2–10.0 0.03 (0.00-0.05) 10.1–16.2 0.01 (-0.01-0.04) 16.3–26.0 0.04 (0.01-0.07) >26.0 0.06 (0.03-0.08) p <0.001 |
| Yaffe et al., (2001) | Study of Osteoporotic Fractures (USA) N=5925 > 65 years <70 years of age=3340 >70 years of age=2585 |
Interview: 1986-1988
|
Cognitive decline 6-8 years Age, education, depression, stroke, diabetes, hypertension, myocardial infarction, smoking, estrogen use, functional limitation |
Blocks walked/wk 0–22 1.00 23–49 0.87 (0.72–1.05) 50-112 0.63 (0.52–0.77) 113–672 0.66 (0.54–0.82) Total PA (kcal/wk) 0–615 1.00 616–1323 0.90 (0.74–1.09) 1324–2414 0.78 (0.64–0.96) 2415-17531 0.74 (0.60–0.90) Aged < 70 years, blocks walked/wk 0–22 1.00 23–49 0.67 (0.51–0.87) 50-112 0.61 (0.47–0.79) 113–672 0.55 (0.42–0.71) Aged < 70 years, total PA (kcal/wk) 0–615 1.00 616–1323 0.78 (0.60–1.02) 1324–2414 0.70 (0.54–0.92) 2415-17531 0.65 (0.50–0.86) Aged > 70 years, blocks walked/wk 0–22 1.00 23–49 1.07 (0.83–1.35) 50-112 0.77 (0.60–0.98) 113–672 0.78 (0.60–1.01) Aged > 70 years, total PA (kcal/wk) 0–615 1.00 616–1323 0.91 (0.72–1.15) 1324–2414 0.77 (0.60–0.98) 2415-17531 0.74 (0.57–0.95) |
Note: BMI: body mass index; km: kilometre; kcal: kilocalories; mPA=moderate activity; ns: not significant; vPA=vigorous activity; wk: week
Appendix H
| Reference | Number & Age of Women | Physical Activity Measurement | Outcome Follow-up Period Adjustments | Summary of Results (95% confidence interval) |
|---|---|---|---|---|
| Cheung et al., (2000) | Aerobics Centre Longitudinal Study (USA) N=4073 20–87 years of age |
Questionnaire with interview: 1970-1990
|
Osteoarthritis of the knee and/or hip Up to 25 years Age, BMI, smoking, ethanol, caffeine |
Regular PA (all ages) Sedentary 1.0 >20 miles/wk 1.0 (0.4-2.3) 10-20 miles/wk 1.1 (0.9-1.3) <10 miles/wk 1.7 (0.4-1.1) Other regular PA 0.9 (0.6-1.3) Regular PA (those aged <50 years) Sedentary 1.0 >20 miles/wk 1.5 (0.4-5.1) 10-20 miles/wk 1.2 (0.9-1.5) <10 miles/wk 1.8 (0.4-1.6) Other regular PA 1.1 (0.6-2.0) Regular PA (those aged >50 years) Sedentary 1.0 >20 miles/wk 1.4 (0.4-4.6) 10-20 miles/wk 1.2 (0.9-1.5) <10 miles/wk 1.6 (0.3-1.2) Other regular PA 0.7 (0.4-1.3) |
| Felson, et al., (1997) | Framingham Study (USA) N=381 Average age 70.5 years |
Questionnaire: 1954-1957, 1971-1973, 1985-1993
|
Osteoarthritis of the knee 7-10 years age, BMI, weight change, smoking, knee injury, chondrocalcinosis, hand osteoarthritis |
PA level Sedentary 1.0 Highest 3.1 (1.1-8.6) |
| Hart et al., (1999) | Chingford Study (UK) N=830 Average 54.1 years |
Interview: 1988-89
|
Osteoarthritis of the knee 4 years hysterectomy, hormone replacement therapy, smoking, knee pain, social class |
Walking 0.60 (0.22-1.71) Job PA 1.48 (0.34-5.64) Sport 1.23 (0.54-2.81) |
| Hootman, et al., (2003) | Aerobics Centre Longitudinal Study (USA) N=976 >40 years of age 25% aged <50 years |
Questionnaire: 1986
|
Osteoarthritis of knee and/or hip Average 12.8 years age, previous knee/hip injury, previous knee/hip surgery; BMI, comorbid condition, smoking status |
PA + joint stress score Sedentary 1.00 Low 1.25 (0.61-2.57) Moderate 1.16 (0.64-2.12) High 1.07 (0.47-2.42) |
| Seavey, et al., (2003) | Alameda County Study (USA) N=1148 Aged >16 years |
Questionnaire: 1974
|
Arthritis 20 years age, race, BMI, depression |
LTPA index Lowest quartile 1.00 2nd quartile 0.80 (0.56-1.14) 3rd quartile 0.79 (0.53-1.20) Highest quartile 0.76 (0.50-1.16) |
Notes. BMI: body mass index, kcal: kilocalories, LTPA=leisure time PA; MET: metabolic equivalent, PA: physical activity
Appendix I
| Reference | Study Number & Age of Women | Physical Activity Measurement | Outcome Follow-up Period Adjustments | Summary of Results (95% confidence interval) |
|---|---|---|---|---|
| Albrand et al., (2003) | OFELY (France) N=672 Post menopausal: average age 59.1 years |
Interview: 1992-1993
|
Osteoporotic fractures 5 years fracture history, grip strength, age, maternal history fragility fracture, past falls, bone mass density hip |
PA score Moderate/High 1.00 Sedentary-no/light PA 2.08 (1.17-3.69) p=0.01 |
| Chapurlat et al., (2003) | Study of Osteoporotic Fractures (USA) 632 (with previous fracture) >65 years of age |
Questionnaire: 1986-1988
|
Second hip fracture 2 years bone mass density, depth perception, weight gain since 25years, oestrogen use |
Regular walking for exercise No 1.00 Yes 0.7 (0.3 – 1.6) p=0.35 |
| Feskanich et al., (2002) | Nurses Health Study (USA) N=61,200 40–77 years of age |
Questionnaire: 1980
Questionnaire: 1986, 1988, 1992, 1994
Questionnaire: 1996
Questionnaire: 1988, 1990, 1992
|
hip fracture 12 years BMI, age, smoking, post menopausal hormone use, calcium, vitamin D, protein, vitamin K, alcohol, caffeine |
Total PA (MET.hours/wk) <3: 1.00 3-8.9: 0.79 (0.60–1.03) 9-14.9: 0.67 (0.49–0.92) 15-23.9: 0.53 (0.37–0.74) >24: 0.45 (0.32–0.63) p trend <0.001 Walking time (hours/wk) <1: 1.00 1: 0.79 (0.55–1.14) 2-3: 0.78 (0.53–1.14) >4 0.59 (0.37–0.94) p trend=0.02 Walking pace (mph) <2: 1.00 2-2.9: 0.51 (0.37–0.71) >3 0.35 (0.22–0.55) PA change among those sedentary at baseline (hours/wk) <1: 1.00 1: 0.86 (0.52–1.43) 2-3: 0.79 (0.45–1.38) >4: 0.53 (0.27–1.04) p trend=0.07 PA change RR among those most active at baseline (hours/wk) >4: 1.00 2-3: 1.73 (1.02-2.95) 1: 1.47 (0.80-2.71) <1: 2.08 (1.20–3.61) p trend=0.004 Sitting (hours/wk) <10: 1.00 10-24: 0.96 (0.65-1.43) 25-39: 1.02 (0.67-1.55) 40-54: 0.96 (0.62-1.47) >55 1.29 (0.85-1.96) p trend=0.16 Standing (hours/wk) <10: 1.00 10-24: 0.77 (0.55-1.07) 25-39: 0.77 (0.55-1.09) 40-54: 0.66 (0.45-0.97) >55: 0.54 (0.35-0.84) p trend=0.01 |
| Gregg et al., (1998) | Study of Osteoporotic Fractures (USA) N=9704 > 65 years of age |
Questionnaire:
|
Hip fracture wrist or vertebral fractures Average 7.6 years age, weight, smoking, estrogen replacement therapy, dietary calcium, falls, alcohol use, functional difficulty |
hip fracture by total PA (kcal/wk) <340: 1.00 341–737: 0.77 (0.58–1.02) 738–1289: 0.78 (0.59–1.04) 1290–2201: 0.64 (0.47–0.88) >2201 0.64 (0.45–0.89) p trend=0.003 hip fracture by LTPA intensity none 1.00 low 0.76 (0.61–0.95) mod-vig 0.58 (0.43–0.79) p trend=0.0004 hip fracture by PA time and intensity (hours/wk) none 1.00 low 0.76 (0.61–0.95) mod-vig 0.58 (0.43-0.79) p trend=0.0004 hip fracture by heavy chores (hours/wk) <5: 1.00 5-9: 0.93 (0.72–1.20) >9: 0.78 (0.62–0.99) p trend=0.14 hip fracture by sitting (hours/day) <6: 1.00 6-8: 0.98 (0.77-1.25) >8: 1.37 (1.08-1.76) p trend=0.01 wrist fracture by total PA (kcal/wk) <340: 1.00 341–737: 0.92 (0.70–1.22) 738–1289: 0.95 (0.71–1.25) 1290–2201: 0.90 (0.67–1.20) >2201 0.85 (0.63–1.15) p trend >0.2 wrist fracture by LTPA intensity none 1.00 low 1.10 (0.87–1.40) mod-vig 1.13 (0.86–1.49) p trend >0.2 wrist fracture by heavy chores (hours/wk) <5: 1.00 5-9: 0.91 (0.74–1.12) >9: 0.86 (0.71–1.05) p trend=0.09 wrist fracture by sitting (hours/day) <6: 1.00 6-8 0.91 (0.74-1.12) >8 1.09 (0.87-1.36) p trend >0.2 vertebral fracture by total PA (kcal/wk) <340: 1.00 341–737 0.76 (0.54– 1.05) 738–1289 0.63 (0.44–0.89) 1290–2201: 0.99 (0.72–1.38) >2201 0.84 (0.59–1.19) p trend >0.2 vertebral fracture by LTPA intensity none 1.00 low 0.99 (0.76–1.29) mod-vig 0.67 (0.49–0.94) p trend=0.01 vertebral fracture by heavy chores(hours/wk) <5: 1.00 5-9 1.04 (0.79–1.39) >9 1.09 (0.85–1.39) p trend >0.2 vertebral fracture by sitting (hours/day) <6: 1.00 6-8: 1.22 (0.95-1.56) >8 1.09 (0.82-1.44) p trend >0.2 |
| Hundrup et al., (2005) | Danish Nurse Cohort Study on the prevention of osteoporosis and atherosclerosis (Denmark) N=14,015 >50 years of age Median 59 years |
Questionnaire: 1993
|
Hip fracture 6 years hormone replacement therapy, BMI, health, activity restrictions, smoking status, previous wrist fracture, family history osteoporosis, alcohol intake, age menarche |
PA /wk Light-heavy >4 1.00 Sedentary 1.88 (1.30–2.70) p < 0.001 |
| Ivers et al., (2002) | Blue Mountains Eye Study (Australia) N=2072 >49 years of age |
Questionnaire: 1992-1993
|
wrist fractures 5 years age, hormone replacement therapy |
vPA yes 1.00 no 0.4 (0.2–0.9) |
| Kushi et al., (1997) | Iowa Women's Health Study (USA) N=32,763 55–69 years of age in 1986 |
Questionnaire: 1986
|
Injury mortality 7 years age at baseline, age at menarche, age at menopause, age at first live birth, parity, alcohol intake, total energy intake, cigarette smoking, estrogen use, BMI at baseline, BMI at age 18, waist to hip ratio, education, marital status |
Regular PA No 1.00 Yes 0.45 mPA (x/wk) rarely/never 1.00 few x/month–1x/wk 0.94 (0.31–2.82) 2-4 x/wk 0.99 (0.33–2.97) >4 x/wk 0.37 (0.07–1.91) p trend=0.26 vPA (x/wk) rarely/never 1.00 few x/month–1 x/wk 0.00 2-4 x/wk 0.59 (0.08–4.44) >4 x/wk 0.00 p trend=0.99 PA level Low 1.00 Medium 0.97 (0.38–2.48) High 0.45 (0.13–1.63) p trend=0.22 |
Note: BMI: body mass index; LTPA: leisure time physical activity; mPA=moderate PA; mph: miles per hour; vPA=vigorous PA; wk: week
Appendix J
| Reference | Number & Age of Women | Physical Activity Measurement | Outcome Follow-up Period Adjustments | Summary of Results (95% confidence interval) |
|---|---|---|---|---|
| Guthrie et al., (2005) | Melbourne Women's Midlife Health Project (Australia) N=381 45-55 years |
Interview: 1991
|
Menopausal hot flushes 9 years Age, BMI, negative mood, estradiol levels, smoking, employment, menopause status, alcohol intake, education, number daily hassles |
Exercise daily OR: 0.94 (between groups) p=0.01 OR: -0.12 (within person) p=0.02 |
| Hatch et al., (1998) | Pennsylvania and New York Prenatal Patients (USA) N=717 Average age 27 years |
Interview: 13 weeks of gestation
|
Gestational length Approx 23 weeks smoking, previous miscarriage or pre term delivery, dating by ultra sound, maternal age, parity, pre-pregnancy weight, first trimester bleeding, study site, per capita income |
Reduced gestational duration low-moderate PA 1.00 no exercise 1.11 (0.88-1.39) Delivery at week 32 (preterm) No exercise 1.00 Heavy, not conditioned 0.53 (0.07-4.17) Heavy, conditioned 0.01 (0.00-0.52) Delivery at week 34 (preterm) No exercise 1.00 Heavy, not conditioned 0.62 (0.13-2.97) Heavy, conditioned 0.04 (0.00-0.65) Delivery at week 36 (preterm) No exercise 1.00 Heavy, not conditioned 0.72 (0.24-2.15) Heavy, conditioned 0.11 (0.02-0.81) Delivery at week 40 (term) No exercise 1.00 Heavy, not conditioned 0.96 (0.59-1.58) Heavy, conditioned 1.05 (0.64-1.73) Delivery at week 42 (postdate) No exercise 1.00 Heavy, not conditioned 1.12 (0.54-2.32) Heavy, conditioned 3.21 (1.22-8.48) Delivery at week 43 (postterm) No exercise 1.00 Heavy, not conditioned 1.20 (0.47-3.07) Heavy, conditioned 5.62 (1.41-22.47) |
| Misra et al., (1998) | University of Maryland Medical Systems Study (USA) N=1,188 Age not given |
Interview (1st, 2nd trimester) • Occupational PA: lifting heavy objects, standing/moving • PA of daily life: stairs climbed (times/day), purposive walking (days/week), lifting heavy objects • Leisure-time exercise (number of days) • Stairs climbed (times/day) • Purposive walking (days/week) • Lifting heavy objects at home • Leisure-time exercise (number of days) • Watching television (hours/week) |
Pre-term delivery without complications 1st prenatal visit - birth race, maternal age, use of illicit drugs, prenatal care, mother's height, smoking, insurance, prior fetal losses, prior low birth weigh delivery, bleeding, hypertension, antepartum hospitalization, febrile/antibiotic administration |
Stair climbing (times/day) <10: 1.00 >10: 2.04 (1.23-3.36) Purposive walking (days/wk) <4: 1.00 >4: 2.16 (1.31-3.57) Lifting heavy objects at home no 1.00 yes 1.59 (0.85-2.96) Leisure time exercise (number of days) >60: 1.00 >60: 0.55 (0.26-1.14) Watching television (hours/wk) <15: 1.84 (0.96-3.52) 15-28: 1.00 29-42: 1.01 (0.49-2.09) >42: 2.73 (1.40-5.33) |
| Sternfeld et al., (2002) | Semiconductor Industry Cohort Reproductive Outcomes Study N=367 18-44 years in 1989 |
Interview: 1989
|
Menstrual cycle length Median of five menstrual cycles age, ethnicity, education, marital status, parity, smoking status, alcohol consumption |
Increase in 30 MET.mins/wk total PA insignificantly associated with 0.001-day increase in mean cycle length (SE=0.007), p=0.86 Increase in 30 MET.mins/wk vPA insignificantly associated with 0.009-day increase in mean cycle length (SE=0.009), p=0.29 Association between cycle specific menstrual cycle length and per cycle mean minutes of daily vPA in concurrent cycle ß=0.0245 (SE=0.0106) p=0.02 Mean mins vPA for previous cycle positively and disgnificantly related to cycle length ß=-0.035 (SE=0.015) |
| Michigan Bone Health Study N=328 24-48 years in 1992 |
Questionnaire: 1992
|
Menstrual cycle length Median 11 menstrual cycles age, ethnicity, education, marital status, parity, smoking status, alcohol consumption |
Association between vPA (per 30 MET.mins/wk) and menstrual cycle length ß=0.075 (SE=0.028), p=0.008 Association between vPA and bleed length ß=0.004 (SE=0.002) p=0.031 Positive association of bleed length with total PA ß=0.001 (SE=0.0003) p=0.023 Positive association of bleed length with leisure time PA ß=0.004 (SE=0.001) p=0.003 |
Note: BMI: body mass index; kcal: kilocalories; mins: minutes; mPA=moderate PA; OR odds ratio; vPA=vigorous PA; wk: week
Last updated: