The Longitudinal Study of Australian Children: 2009-10 Annual Report
2009-10 Annual Report
- Minister's foreword
- Director's report
- Consortium Advisory Group foreword
- Overview of Growing Up in Australia 2009-10 overview
- Wave 3.5 data collection and response
- Wave 3.5 findings
- Key personnel
- Data users and website activities
- Publications and presentations
- Data access
Minister's foreword
Foreword from the Minister for Families, Housing, Community Services and Indigenous Affairs
The Hon. Jenny Macklin MP
One of the key responsibilities of all governments is ensuring children are healthy, safe and happy to give them the best start in life.
Children are at the centre of the Australian Government’s policy agenda. We have delivered major reforms to early childhood education and care; new early intervention programs for children with developmental disabilities; the first ever National Framework for Protecting Children; and from 1 January, Australia’s first national Paid Parental Leave scheme.
To support families we need effective policies based on solid evidence. An important part of this evidence base comes from Growing Up in Australia: the Longitudinal Study of Australian Children (LSAC).
The study is funded by the Australian Government and is jointly managed by the Department of Families, Housing, Community Services and Indigenous Affairs, the Australian Institute of Family Studies, and the Australian Bureau of Statistics.
The study collects a range of information, including looking at children’s academic ability and health and emotional wellbeing, as well as information about parenting, family functioning, early childhood care, and education and schooling. Since the study began in 2004, around 10,000 children and families have taken part in three main waves of interviews and three in between mail-out surveys.
LSAC is becoming a valuable national resource for policy makers and researchers. LSAC data about the leave parents take following the birth of a child and about the length of time mothers breastfeed for was used extensively to model the impacts of paid parental leave and demonstrate the value of taking leave around the birth of a child.
I would like to say thank you to all the families and children who are part of the study for their contribution over many years. Their commitment is helping us deliver better policies for all Australian families.

Jenny Macklin
Minister for Families, Housing,
Community Services and Indigenous Affairs
Director's report
This 2009-10 financial year was a significant one for Growing Up in Australia: the Longitudinal Study of Australian Children (LSAC). In December 2009, the Australian Institute of Family Studies (AIFS) hosted the 2nd LSAC Research Conference in Melbourne. The two-day conference attracted participants from across Australia, as well as from New Zealand, Singapore, Sweden, the United Kingdom and the United States. Papers were presented by leading researchers who explored a diverse range of topics related to child development, health and family wellbeing. The third wave of the survey was released in August 2009 and Wave 4 data collection commenced in March 2010. This means that longitudinal data are now available for Australian children aged 4 to 5 years and 8 to 9 years and their families and can now be used to look at the transition from early childhood to middle childhood.
With three waves of data currently available from LSAC, Australia joins countries around the world including Denmark, France, England, Scotland, Ireland and Canada that have large-scale nationally representative longitudinal studies of children and their families. As a result, the LSAC data is increasingly being used to compare Australian children and their families to those growing up in other countries. For example, the study has been used to compare how parental resources are associated with early child outcomes in the United States, United Kingdom, Canada and Australia. It is also being used in a cross-national study of the relationship between use of non-parental child care and child outcomes being undertaken by the Organisation for Economic Co-operation and Development (OECD) in collaboration with researchers from around the world.
Information from LSAC is making a vital contribution to the development of policies that relate to children and their families. It is being used by Australian, state and territory governments to inform the development of child and family policies and is being extensively analysed by academic researchers. It is also informing health professionals and those providing social services to help inform their practice.
For example, the data has been used to analyse the effects of growing up in a socioeconomically disadvantaged family on child wellbeing, including children’s school readiness. Other research has focused on the impact of different types of child care on children’s behaviour and development. LSAC data was used in recent studies of the family law system including the evaluation of the 2006 changes to the family law system undertaken by AIFS to provide information on the impact of shared care-time arrangements on children’s wellbeing following parental separation. Another important area of research that has national significance has focused on comparing Indigenous and non-Indigenous children to look at differences in cognitive and learning outcomes, health and in the use of health services. The LSAC data has also been used to answer questions of high importance to government health policy, including children’s weight, diet and activity levels, and the social determinants of health.
A strength of LSAC is the partnership between AIFS, the Department of Families, Housing, Community Services and Indigenous Affairs, the Australian Bureau of Statistics and leading researchers from universities and major research bodies across Australia.
As the study children grow up, LSAC will provide further valuable information about families and children in middle childhood and adolescence. The longitudinal nature of the dataset will also enable better understanding of the importance of early experiences on outcomes later in life. LSAC will therefore continue to be a valuable resource for the Australian government in supporting Australian families with children. Having access to high quality data that tracks children’s development over time is vital for developing government policies and programs to support the wellbeing of children and their families.

Professor Alan Hayes
Director
Australian Institute of Family Studies
Consortium Advisory Group (CAG) foreword
Prepared by Professor Stephen Zubrick, CAG Chair and Dr Helen Rogers, FaHCSIA.
In response to a request for tender from the Australian Government, the original proposal for the design, content and methods for the Longitudinal Study of Australian Children came together during 2000-01 through the efforts of a group of scientists from research institutes and universities around Australia. These were the researchers that formed the Consortium Advisory Group when, on 5 October 2001, the Australian Government awarded the contract and work commenced in earnest to implement the study.
While there have been several changes over time in the management arrangements for the study, the Consortium Advisory Group has remained a stable source of expertise and guidance for the study. Members of the consortium are trained in economics, psychology, paediatrics, sociology, psychiatry, epidemiology, statistics, speech and language pathology, and education and many of them have extensive experience in creating and implementing large-scale population studies.
Consortium members (see Key personnel) provide expert input into the identification and selection of developmentally appropriate survey content for each wave of the study. They develop and/or recommend methods of direct assessment of survey participants, and take a great interest in recommending techniques for ensuring maximum retention of participants in the study over time. Members assist where feasible in value adding to the data that are collected; and, now, have a prominent role in producing research and policy findings from the study.
Consortium members also advise on and, where appropriate, seek other national and international advice from experts in specific areas of need in the development of study methods and content. Membership of the consortium has been relatively stable with gradual changes in its composition to accommodate changing careers and to meet the developmental content needs of the study.
Meetings between the LSAC Management Group (the Department of Families, Housing, Community Services and Indigenous Affairs, the Australian Institute of Family Studies and the Australian Bureau of Statistics) and the CAG members take place via face-to-face meetings, CAG teleconferences and working group teleconferences on a regular basis during the content design periods.
Two to three face-to-face meetings are conducted each year with the LSAC Management Group and CAG members. In 2009-10 the group met in October and March. These meetings allow the CAG members and the LSAC Management Group to discuss the upcoming content and methodology of the study. Meetings generally usually run over two days.
In addition to attending meetings, CAG members spend time developing content and ideas to bring to meetings in their specified areas. Each month CAG members participate in a teleconference with the LSAC Management Group to be updated on study progress, upcoming papers and conferences using LSAC data, and to discuss content and/or methodology issues as they arise.
Working groups, led by CAG members, participate in a series of teleconferences during the design phase for an upcoming wave. For Wave 5, these occurred mainly between March and July 2010. Working groups covered a range of topics including neighbourhood and community, time use media and technology, becoming an adult, learning and achievement, health, peers, schools and child care. These meetings require CAG members to put in development time outside the meetings investigating previous and current research. The number of teleconferences for each group ranged from three to eight depending on the new material being considered.
Overview of Growing Up in Australia
- Growing Up in Australia 2009-10 overview
- Wave 3.5 data collection and release
- Wave 4 data collection
- Wave 5 and beyond
Growing Up in Australia 2009-10 overview
Growing Up in Australia: the Longitudinal Study of Australian Children (LSAC) began in 2004 involving approximately 10,000 families around Australia. LSAC is investigating the contribution of children’s family, social, economic and cultural environments to their adjustment and wellbeing. A major aim is to identify policy opportunities for improving support for children and their families and for early intervention and prevention strategies.
The study follows a representative sample of children from across Australia. Data are collected from two cohorts each of approximately 5,000 children and their families every two years. In the first wave in 2004, the B or infant cohort was aged 3 to 19 months and the older, K or child, cohort was aged 4 to 5 years. Study informants include the child (from the age of 6 years), parents (both resident and non-resident), and carers and teachers.
The study has a broad, multidisciplinary base, and examines policy-relevant questions about children’s development and wellbeing. It addresses a range of research questions about parenting, family relationships, childhood education, non-parental child care and health.
Information is collected using a range of methodologies. The following is a selection of methods used in the Wave 4 data collection in 2009-10:
- a 10-15 minute computer assisted telephone interview with the study child’s parent at the time of arranging an appointment for the home visits
- direct assessments of the children including cognitive assessment, height, weight, and blood pressure
- telephone interviews for parents living apart from the study child
- paper form questionnaires for the second care giver living with the child
- computer based self-complete questionnaires for primary care givers replacing paper forms used in earlier waves
- time use diaries completed by K cohort study children about their activities over a 24-hour period.
Wave 3.5 data collection and release
In June 2009, study families were sent a questionnaire (known as Wave 3.5 mid-wave) asking about a range of topics including schooling, child health, media and technology, and stressful life events. Wave 3.5 provided an important opportunity to keep in touch with study families and to collect a range of information. For the B cohort, aged 5 to 6 years at the time, this included the transition to primary school. For the K cohort, aged 9 to 10 years, questions investigated the onset of puberty. About 64 per cent of eligible study families returned the questionnaire. Data was released in March 2010 and some of the initial findings from Wave 3.5 are included in this report.
Wave 4 data collection
The first stages of Wave 4 data collection began in late 2009. This followed extensive pre-testing of new content and methodologies undertaken in 2009. By June 2010, 3,017 study families had completed interviews, with interviews continuing until early 2011.
While the primary data collection method of a face-to-face interview with the child’s main parent continues in Wave 4, a range of methodology changes were implemented that should improve data quality, response rates and privacy. These changes will ensure time spent with families is used efficiently and effectively. Making the best use of time with families is very important, particularly as both cohorts are now at school, many families have two working parents, and children are often involved in a variety of after-school and weekend activities.
In Wave 4, nearly 180 interviewers from the Australian Bureau of Statistics (ABS) are collecting information from study families. New information is being collected from both the study child cohorts. To reduce the time of the home visit, a brief (10 to 15 minute) computer assisted telephone interview (CATI) is incorporated in the initial phone call with the study child’s primary parent/care giver. The telephone interview is optional and some families elect to answer these questions during the home visit. However, many families take up the option to get some of the questions out of the way early. Two new physical measurements will help us get a better picture of the health of children in Australia. With the consent of parents and children, we will:
- measure children’s body fat percentage in addition to their weight
- measure blood pressure in the K cohort children.
The B cohort are being asked questions about their lives for the first time in Wave 4. These include questions about how they like school and how they feel in general. The information we get directly from children is invaluable as it gives us the best indication of how they feel. The questions asked are simple and give children an introduction to responding themselves. As children get older we rely on them for more information. These are the same questions we asked the children in the older cohort when they were aged 6 to 7 years.
In Wave 4, the older K cohort children (aged 10 to 11 years) answer questions using a laptop computer and headphones so they can hear the questions as well as read them on the screen. This design caters for children of all reading abilities. Faster readers are able to go at their own pace and skip the audio, while slower readers can be assisted by the spoken word. As before, the questions will include topics such as their feelings about themselves, school, friends, family and their community.
Parents are also answering some of their questions on a laptop computer, although without the headphones. These computer self interviews are popular with both parents and children. They allow them to work at their own speed and answer sensitive questions in privacy.
Another innovation for Wave 4 is a Time Use Diary (TUD) for the K cohort children. Until now, parents have completed a TUD for their children. However, as the children get older, there are more and more hours in the day when their parents are unable to report what they are doing. To find out children’s perspective on how they spend their day, some of the K cohort children are now asked to complete a paper and pencil diary on the day before the interview. Figure 1 provides an example of the TUD used for some of the study children in 2010; the example covers only one page of the three pages of the TUD. Children are asked to recall the day’s activities, from the time they awake until they go to sleep, including dressing, travelling, eating, and before, during and after school activities. The TUD is broken into six time slots throughout the day to help prompt children to remember what they have done and when.
Figure 1: Example of a page of the Time Use Diary used by some of the study children
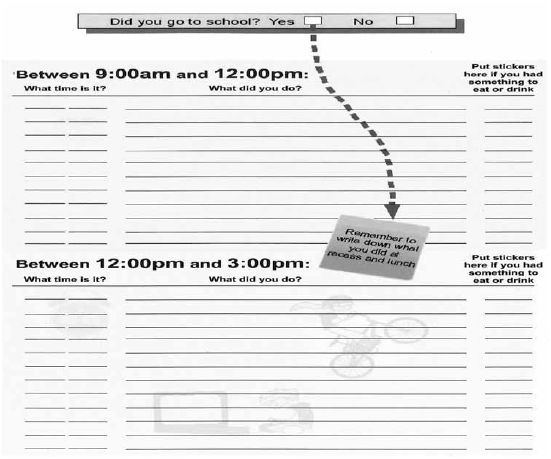
When the interviewer visits the following day, the interviewer sits with the study child and enters the information onto the computer, prompting children if there is insufficient information written in the diary.
The home visit is carefully structured to make the best use of the time the interviewer is in the home. The interviewer takes two computers into the home, which are used in parallel. For example, while the primary parent/care giver is completing the self-report on one computer, the interviewer is conducting the physical measurements with the study child and assisting the child to enter the time use information onto the second computer.
Research publications and dissemination
Use of LSAC data and research continued to grow during 2009-10. There are over 370 registered LSAC data users across Australia and overseas. In addition, nearly 30 journal articles and reports were published and approximately 50 conference presentations were delivered (see Publications and presentations). Website visits to the Growing Up in Australia site have increased; in 2008-09 there were 182,263 total visits to the Growing Up in Australia website increasing to 202,264 during 2009-10 (see Table 3).
Second LSAC research conference
The 2nd Growing Up in Australia: the Longitudinal Study of Australian Children (LSAC) Research Conference was held on 3-4 December 2009 in Melbourne. The conference drew a crowd of around 185 professionals from Australia and overseas sharing knowledge about the use of LSAC data in research and policy development and exploring the potential of the dataset.
Professor Andrew Leigh (formerly of the Australian National University) delivered the keynote address on the first day of the conference and described his research analysing the impact of child care on the behavioural outcomes of children aged 2 to 3 years. On the second day, Professor Ann Sanson (University of Melbourne) presented a keynote address on her research examining the risk and protective factors influencing children’s physical, cognitive and socio-emotional outcomes. Over the two days more than 30 presentations from leading researchers from Australia and abroad were delivered based on their analyses of LSAC data. Other leading researchers delivered presentations in the areas of health, media, schooling and education, parenting, parental employment and intergenerational mobility using LSAC data.
Maximising the value of longitudinal studies for policy and science: methodological and analytical issues—workshop
On 12-13 November 2009, FaHCSIA and the Australian Research Alliance for Children and Youth (ARACY)/Australian Research Council (ARC) Research Network hosted a workshop to discuss the management, analysis and methods used in longitudinal studies—Maximising the value of longitudinal studies for policy and science: methodological and analysis issues.
The workshop was jointly facilitated by Professor Ann Sanson, Network Coordinator, ARACY ARC Research Network Coordinator and LSAC Consortium Advisory Group, and Dr Helen Rogers, LSAC Section Manager.
The workshop included nine presentations, three panel discussions and a poster session addressing a range of issues in longitudinal studies, including participant retention and attrition, data collection, weighting and imputation, data linkage and data harmonisation. The workshop was a valuable opportunity for LSAC data users and policy makers to learn about recent developments in similar birth cohort studies internationally including the Millennium Birth Cohort Study in the United Kingdom and the Dunedin Multidisciplinary Health and Development Study in New Zealand.
Life documentary series
Following the successful screenings on ABC television of Life at 1 and Life at 3, LSAC is involved with the third instalment in the series. Life at 5 is produced by Heiress Films and, as with the first two instalments, draws on the experience of LSAC study families. Life at 5 follows the same 11 children and their families, observing their ordinary routines and milestones and looking at factors impacting on their lives such as their parents’ relationship, finances, work, health and education. The series uses LSAC data and findings to relate the lives of the documentary children to other Australian children. AIFS and FaHCSIA staff are involved in advising on the use and interpretation of the data and research. Two of the members of the study’s Consortium Advisory Group, Stephen Zubrick and Ann Sanson, provide expert advice to the series and play an important role in the commentary. Life at 5 completed production mid-2010 and is scheduled to be screened in 2011.
Wave 5 and beyond
Development of Wave 5 began in March 2010 and will continue until early 2011, before the first stage of data collection in the second half of 2011. The main phase of Wave 5 data collection starts in March 2012. In Wave 5, children in the K cohort will be transitioning from late childhood to early adolescence (12 to 13 years). As adolescence is a period of substantial change, the study is also changing to ensure it continues to capture the important aspects of the lives of children and their environment. We are including new health items to capture the substantial physical and psychological changes that occur at puberty. A greater emphasis will be placed on collecting information about peers as they become a more central influence on the child. Information will be collected about a wider range of activities including work behaviour, technology use, and alcohol and drug use. This is a time when children gain increasing independence. In recognition of this, the study is asking the child (rather than the parent) to report directly on more aspects of their lives. The information collected at this time will provide a rich snapshot of the children’s lives at a new and significant stage in their development, including their transition to high school, the onset of puberty and changes in social groups and activities. In Wave 5, the B cohort children will be aged 8 to 9 years and will be asked similar questions to those the K cohort children were asked when they were the same age in Wave 3.
Data linkage
LSAC has informed consent to link the information collected in the study with a range of data collected by other organisations. Data linkage can greatly enrich the amount and variety of information collected while reducing the burden on study families. As always, the data is treated confidentially, and measures are taken to ensure children and their families are not identifiable. LSAC currently links with the following datasets:
- National Childcare Accreditation Council—this data includes information about child care centres that LSAC children attend(ed).
- Child Medicare data—this includes information about the types of medication and health services study children use.
- ABS Census Collector District data—2006 census data provides information about the areas in which study families live.
In Wave 4, the LSAC team asked study parents for their consent to link with the National Assessment Program—Literacy and Numeracy (NAPLAN) data. This is an important opportunity to supplement information already collected in the study on children’s learning and cognitive development. As children get older, their knowledge and academic capability increases, and assessing capability can be very time consuming. By linking to these national tests, the burden of having to conduct cognitive tests on the children during the home visit is greatly reduced. Linking the NAPLAN data involved each state and territory education authority linking the data to its students using a confidentialised coding system. It is anticipated that the linked NAPLAN data will be released in 2011.
Study parents of B cohort children were also asked for their consent to link with data from the Australian Early Development Index (AEDI) data—a teacher assessment of the development of Australian children in their first year at school. Procedures to conduct this linking will be established in 2010-11.
To help researchers identify areas where people live we use a standard classification provided by the ABS, which is also used during each census. The ABS is releasing a new standard classification for these areas. From 2011, the ABS will replace the Australian Standard Geographical Classification (ASGC) with the Australian Statistical Geography Standard (ASGS). LSAC data currently links to Statistical Local Areas (SLA) or postcodes. However, the new ASGS does not contain Statistical Local Areas. To preserve the longitudinal nature of the study the study developers will fit LSAC data to the new ASGS.
Wave 3.5 data collection and response
Fieldwork
As two years is a long time between main wave home visits, mid-wave data collections are a useful way of keeping in touch with study families and collecting information about selected topics in more detail. It is also an important opportunity to collect information about key changes in children’s lives. For example, in 2009 children from the B cohort were aged 5 to 6 years and most had recently made the critical transition into the first year of primary school. Meanwhile, the older K cohort children were aged 9 to 10 years old and some were starting to go through puberty.
To explore some of these transitions, in early June 2009 the study sent out an eight page ‘mid-wave’ (Wave 3.5) mail-out to all participant families. The questionnaire developed for each cohort asked about a range of topics including schooling, child health, media and technology, and stressful life events for the parents.
Parents of both cohorts were asked about topics such as their children’s experiences with school, their satisfaction with their child’s educational progress, and children’s health, including sleep patterns and injuries requiring medical attention. Questions were also asked about the child’s media and technology use, including parents’ concerns with their use of certain technology and rules set by the parents on what media and technology children were exposed to. Parents in both cohorts were also asked to report whether they had experienced any stressful life events in the last 12 months.
Parents of B cohort children were asked further questions on whether or not their child likes going to school and their own and their child’s relationship with their teacher and school. Questions also covered how the child behaves with other children.
For the older K cohort children, parents were asked about signs that would indicate the onset of puberty, what activities children use a computer for, whether the child has a mobile phone and the different technologies study children use to communicate with friends.
Response rates and sample characteristics
In Wave 3.5, 9,413 questionnaires were sent out to study families: 4,772 B cohort families and 4,641 K cohort families (see Table 1). Sixty-four per cent of the Wave 3.5 sample returned the questionnaires. There was a very similar return rate between the B cohort (63 per cent) and K cohort (64 per cent), although the overall response rate was slightly lower than Wave 2.5 (B cohort=69 per cent and K cohort=67 per cent).
Table 1 shows the response rates for the main and mid-wave data collections. There has been a decline in response rates for both the main and the between-wave data collection over time. For the main waves, the response rates have been high and did not decline much between Waves 2 and 3 (91 per cent to 89 per cent, or 2 percentage points). However, the mid-wave response rates were substantially lower than for the main Wave: 72 per cent in Wave 1.5 and declining by about 4 percentage points for each mid-wave survey.
|
B cohort
|
K cohort
|
Total
|
|||||||
|---|---|---|---|---|---|---|---|---|---|
|
Sample size
|
Proportion of Wave 1 (%)
|
|
Sample size
|
Proportion of Wave 1 (%)
|
|
Sample size
|
Proportion of Wave 1 (%)
|
|
|
| Main waves | |||||||||
| Wave 1 | 5,107 | 100.0 | 4,983 | 100.0 | 10,090 | 100.0 | |||
| Wave 2 | 4,606 | 90.2 | 4,464 | 89.6 | 9,070 | 89.9 | |||
| Wave 3 | 4,386 | 85.9 | 4,332 | 86.9 | 8,718 | 86.4 | |||
| Between waves |
Percentage of previous main wave
|
|
|
Percentage of previous main wave
|
|
|
Percentage of previous main wave
|
||
| Wave 1.5 sent | 5,061 | 99.1 | 4,935 | 99.0 | 9,996 | 99.1 | |||
| Wave 1.5 returned | 3,573 | 70.0 | 70.6 | 3,594 | 72.1 | 72.8 | 7,167 | 71.0 | 71.7 |
| Wave 2.5 sent | 4,859 | 95.1 | 4,712 | 94.6 | 9,571 | 94.9 | |||
| Wave 2.5 returned | 3,246 | 63.6 | 66.8 | 3,252 | 65.3 | 69.0 | 6,498 | 64.4 | 67.9 |
| Wave 3.5 sent | 4,772 | 93.4 | 4,641 | 93.1 | 9,413 | 93.3 | |||
| Wave 3.5 returned | 3,012 | 59.0 | 63.1 | 2,972 | 59.6 | 64.0 | 5,984 | 59.3 | 63.6 |
Table 2 illustrates the demographic characteristics of the responding sample at each wave and mid-wave from Wave 1 to the mid Wave 3.5. Certain demographic characteristics of the sample (such as sex, state and region) have remained fairly stable over time and when comparing between mid and main wave.
For other characteristics there appear to be some important differences between waves. For example, the proportion of the sample where the mother has completed Year 12 shows two interesting and distinct patterns.
First, it appears that the proportion of the sample in which the mother completed Year 12 is smaller for main waves (B cohort: 67 per cent, 69 per cent, and 70 per cent for Waves 1, 2 and 3 respectively) compared to the mid-waves (for the B cohort: 74 per cent, 75 per cent, and 76 per cent for Waves 1.5, 2.5 and 3.5 respectively).
This suggests that mothers with a lower level of education are less likely to respond to the written, mail-out mid-wave survey compared to the face-to-face main wave interview. The data also show a second, related pattern: that mothers who completed Year 12 are an increasing proportion of the sample over time.
These two patterns can also be seen in both cohorts and in relation to the ethnicity variables and in families in which no parent works. This is consistent with research from other international social surveys,1 showing that people from lower socioeconomic backgrounds, people with a lower education level and people from culturally and linguistically diverse backgrounds are at a higher risk of non-response, particularly for written surveys.
The LSAC management group is very mindful of these differences and is continually developing strategies to support all families to stay in the study.
For data users, main wave data includes weighting variables to allow researchers to take into account a range of these demographic differences in response rates when making estimates about the Australian population.
A number of other patterns reflect some of the changes happening as study children grow older. For example, the number of only-child families in the B cohort decreased over time from 40 per cent in Wave 1 to 19 per cent in Wave 2 and 10 per cent in Wave 3.5. This decrease in only child families mirrors the increase in families where the study child had one or more siblings. The corresponding pattern in the older K cohort study families is also apparent, but much less pronounced. The proportion of K cohort study families with only one child is much lower at Wave 1 (12 per cent) and declines only gradually by Wave 3.5 (8 per cent). These changes in the sibling composition of study families reflect how parents in the B cohort are particularly likely to have had another child over the first three waves of the study, while the K cohort composition data suggests, as would be expected, that as children get older, parents are less likely to have more children.
|
B cohort
|
K cohort
|
|||||||||||
|---|---|---|---|---|---|---|---|---|---|---|---|---|
|
W1
|
W1.5
|
W2
|
W2.5
|
W3
|
W3.5
|
W1
|
W1.5
|
W2
|
W2.5
|
W3
|
W3.5
|
|
| Sex of study child | ||||||||||||
| Male | 51.2 | 51.8 | 51.1 | 50.9 | 51.2 | 50.8 | 50.9 | 51.4 | 51.0 | 51.0 | 51.1 | 51.3 |
| Female | 48.8 | 48.3 | 48.9 | 49.1 | 48.8 | 47.4 | 49.1 | 48.6 | 49.0 | 49.1 | 48.9 | 48.7 |
| Family type* | ||||||||||||
| Two resident parents/guardians | 90.7 | 93.5 | 89.0 | 91.9 | 88.9 | 92.0 | 86.0 | 89.3 | 85.2 | 88.8 | 85.6 | 89.6 |
| One resident parent/guardian | 9.3 | 6.5 | 11.0 | 8.1 | 11.1 | 7.8 | 14.0 | 10.7 | 14.8 | 11.2 | 14.4 | 10.4 |
| Siblings* | ||||||||||||
| Only child | 39.5 | 40.1 | 19.3 | 18.7 | 10.4 | 9.9 | 11.5 | 10.6 | 9.1 | 8.3 | 8.2 | 7.8 |
| One sibling | 36.8 | 38.3 | 49.1 | 51.5 | 48.1 | 50.9 | 48.4 | 51.4 | 45.2 | 47.7 | 44.2 | 47.2 |
| Two or more siblings | 23.7 | 21.6 | 31.6 | 29.7 | 41.5 | 39.3 | 40.1 | 38.0 | 45.7 | 44.0 | 47.6 | 45.0 |
| Ethnicity* | ||||||||||||
| Aboriginal or Torres Strait Islander | 4.5 | 2.6 | 3.9 | 2.3 | 3.4 | 2.0 | 3.8 | 2.5 | 3.4 | 2.3 | 2.9 | 1.8 |
| Mother speaks language other than English at home | 14.5 | 12.4 | 13.4 | 11.0 | 12.6 | 10.5 | 15.7 | 13.9 | 14.7 | 13.2 | 13.8 | 11.5 |
| Work status* | ||||||||||||
| Both parents or lone parent work | 47.9 | 51.8 | 56.9 | 59.6 | 63.0 | 62.2 | 55.5 | 59.1 | 65.4 | 69.1 | 72.8 | 72.2 |
| One parent works (in couple family) | 40.8 | 40.7 | 33.8 | 34.1 | 29.7 | 29.0 | 32.8 | 32.9 | 26.1 | 25.3 | 20.7 | 20.4 |
| No parent works | 11.3 | 7.5 | 9.3 | 6.3 | 7.4 | 8.5 | 11.6 | 8.0 | 8.6 | 5.6 | 6.5 | 7.2 |
| Educational status* | ||||||||||||
| Mother completed Year 12 | 66.9 | 73.5 | 69.0 | 74.7 | 69.8 | 76.0 | 58.6 | 63.1 | 60.1 | 64.3 | 61.4 | 65.9 |
| Father completed Year 12 | 58.5 | 61.4 | 59.7 | 63.1 | 60.4 | 58.7 | 52.7 | 55.8 | 53.2 | 56.5 | 54.0 | 51.1 |
| State | ||||||||||||
| New South Wales | 31.6 | 30.7 | 31.1 | 30.1 | 30.1 | 29.6 | 31.6 | 31.2 | 31.4 | 31.5 | 30.8 | 30.8 |
| Victoria | 24.5 | 25.4 | 24.3 | 25.0 | 24.6 | 25.7 | 25.0 | 25.3 | 23.8 | 24.3 | 24.4 | 24.9 |
| Queensland | 20.6 | 20.2 | 21.5 | 21.2 | 22.0 | 20.6 | 19.8 | 19.8 | 20.6 | 20.3 | 20.8 | 19.8 |
| South Australia | 6.8 | 7.3 | 6.7 | 7.0 | 7.0 | 7.0 | 6.8 | 6.7 | 6.9 | 7.1 | 6.9 | 6.8 |
| Western Australia | 10.4 | 10.4 | 10.6 | 10.4 | 10.3 | 10.5 | 10.2 | 10.4 | 10.6 | 10.2 | 10.2 | 11.0 |
| Tasmania | 2.2 | 2.3 | 2.3 | 2.5 | 2.3 | 2.4 | 2.7 | 2.9 | 2.9 | 2.9 | 3.0 | 3.1 |
| Northern Territory | 1.7 | 1.3 | 1.4 | 1.4 | 1.2 | 1.4 | 1.7 | 1.5 | 1.5 | 1.2 | 1.4 | 1.2 |
| Australian Capital Territory | 2.1 | 2.6 | 2.3 | 2.5 | 2.4 | 2.7 | 2.3 | 2.2 | 2.3 | 2.5 | 2.5 | 2.5 |
| Region | ||||||||||||
| Capital city statistical division | 62.5 | 63.8 | 61.9 | 61.9 | 61.8 | 62.4 | 62.1 | 62.3 | 61.6 | 62.7 | 61.4 | 62.3 |
| Balance of state | 37.5 | 36.2 | 38.1 | 38.1 | 38.2 | 37.6 | 37.9 | 37.7 | 38.4 | 37.3 | 38.6 | 37.7 |
| Number of observations | 5,107 | 3,573 | 4,606 | 3,246 | 4,386 | 3,012 | 4,983 | 3,594 | 4,464 | 3,252 | 4,331 | 2,972 |
- Stoop, I, Billiet, J, Koch, A & Fitzgerald, R 2010, Improving survey response: lessons learned from the European Social Survey, Wiley, UK.
Wave 3.5 findings
In this section we highlight some of the findings from Wave 3.5, using unweighted data. Because some population groups were less likely to respond to the mail-out survey, and the mid-wave data are not weighted to account for this, the percentages may differ slightly from the estimated proportions in the Australian population.
For the B cohort, in about 95 per cent of cases the form was filled out by the child’s mother and 5 per cent were filled out by the child’s father. The corresponding figures for the K cohort were 93 per cent and 7 per cent. In both cohorts, an extremely small number of questionnaires were filled out by somebody else caring for the child.
Schooling
At the time of the mid-wave survey, 78 per cent of younger study children were in their first year at school (known as prep, kindergarten, reception) and around 18 per cent were in their second year at school (Year 1). The majority of parents (96 per cent) whose child attended school (defined as Grade 1 and kindergarten/prep/reception) reported their child looking forward to school every day or most days and only 2 per cent reported their child was upset going to school most days or every day. The majority of parents whose children attended school found their child’s transition to school easy (96 per cent), while a small number found it difficult (4 per cent).
Starting school is a critically important time in children’s lives. This transition can be challenging for some children and can have significant impacts on the child’s ongoing learning. To better understand this transition, the Wave 3.5 questionnaire asked about support the B cohort study children who were attending school received before they first started (as shown in Figure 2). The majority attended orientation programs (79 per cent) at their schools before starting their first year, 60 per cent met their teacher and 59 per cent attended an open day at the school before starting. Most parents also received some form of introduction to the school such as attending orientation programs (81 per cent), receiving mail-out information (81 per cent) or meeting with the principal or the class teacher (78 per cent). Figure 2 shows the type of introduction B cohort families received prior to the study child starting school.
Figure 2: B cohort child's contact with school before starting full-time
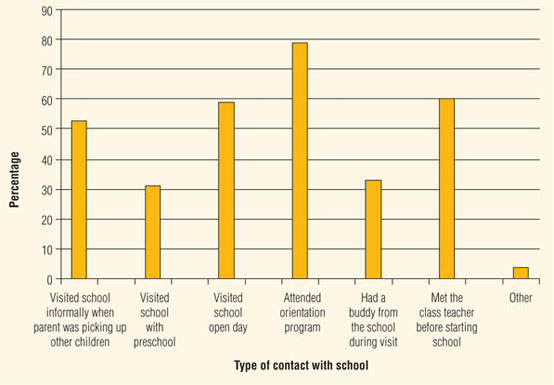
Source: LSAC B cohort, Wave 3.5 data.
Parents of both cohorts reported being satisfied or very satisfied with the quality of education their child received (B=98 per cent; K=94 per cent). Parents of the older cohort said they were either satisfied or very satisfied with the study child’s progress with maths (91 per cent), reading (93 per cent) and their overall progress (94 per cent). Just over half the K cohort parents (52 per cent) said they believed their child’s overall achievement to be above average and 48 per cent rated their child’s achievement as average or below.
Three-quarters (75 per cent) of the B cohort parents helped the study child daily with homework tasks set by their teacher while only 15 per cent of parents of K cohort study children reported doing this (Figure 3). The difference between the B and K cohorts is likely to reflect how the older cohort is increasingly able to engage with homework activities with less direction from their parents. It also may be due to the emphasis placed on parents listening to their children read every night during the early years of school.
Figure 3: How often parents help the study child with their homewok
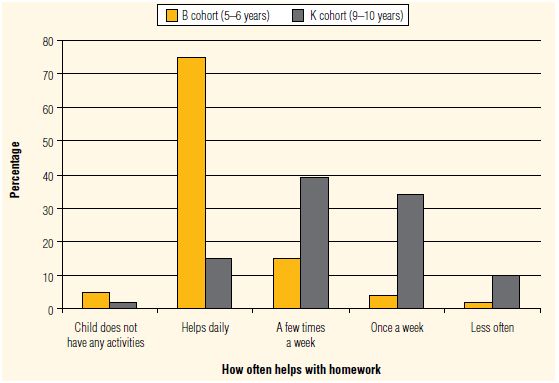
Source: LSAC B and K cohorts, Wave 3.5 data.
Parents overwhelmingly reported positive relationships between: the study child and their teacher (B=99 per cent, K=99 per cent), themselves and the child’s teacher (B=98 per cent, K=97 per cent), and themselves and the child’s school (B=99 per cent, K=99 per cent). These numbers paint a positive picture of the interactions between study families and their child’s school.
While parents report satisfaction with their relationships with the child’s school, it is interesting that 33 per cent of parents of the B cohort attended parent-teacher meetings very often or often, 49 per cent did occasionally and 18 per cent never attended parent-teacher meetings (see Figure 4). Nearly 30 per cent of parents from the K cohort attended parent-teacher meetings very often or often while 57 per cent did occasionally and 14 per cent never attended them. There are many possible explanations for these responses. Many schools may only hold parent-teacher meetings once or twice a year, which parents would be likely to report as occasionally. Some parents may rely on their partner to attend these events or may see no reason to attend if their child is doing well. There is probably also a subset of parents who chose not to engage with the school.
Figure 4: How often parents attend parent-teacher meetings
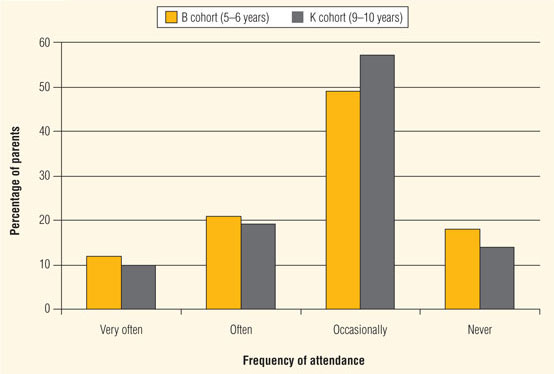
Source: LSAC B and K cohorts, Wave 3.5 data.
The Wave 3.5 questionnaire also asked parents how their children travelled to and from school. By looking at the different types of transport children use, we can gain an insight into some of the regular incidental physical activities children are involved in, about the impact on parents who accompany their children to school, and how this changes as children take on more personal responsibility. We can also look at how distance from school impacts on the method of transport used.
Parents of both cohorts were asked what type of transport their child used for (a) going to school and (b) coming home from school, for each day of the week. Only very small numbers of children used a type of transport involving physical activity or public transport to and from school every day of the week. To get an understanding of the number of children undertaking at least some physical activity in their trip to school, a new variable was created showing children who walked, bicycled or used a scooter to go to school on at least six trips (either to or from school) per week. A similar variable was created for children who used public transport on at least six trips (either to or from school) per week. The percentage of children in these two categories, those who were driven to school every day, and children who used a variety of different transport types is shown in Figure 5.
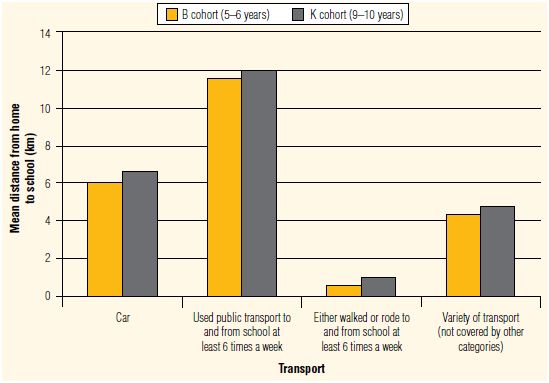
Figure 5: Comparison of the types of transport used to get to and from school by cohort
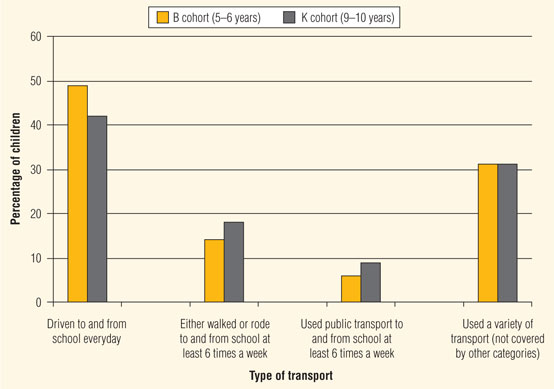
Source: LSAC B and K cohorts, Wave 3.5 data.
While children are mostly driven to and from school everyday (B cohort=49 per cent; K cohort=42 per cent), 18 per cent of K cohort children and 14 per cent of B cohort children rode or walked on at least six trips (to or from school) per week. Only 9 per cent of the K cohort and 6 per cent of B cohort children used public transport on at least six trips per week. The remaining study children used a mixture of modes of transport to get to and from school not covered by these other categories (31 per cent of B and K cohort children).
The type of transport used to get to and from school could be influenced by a range of factors including the distance from home to school, the other responsibilities of the child’s parents (especially work), the safety of the neighbourhood and the maturity of the child. For example, as might be expected, Figure 5 shows that the older K cohort children are more likely to take other forms of transport than have their parents drive them to and from school.
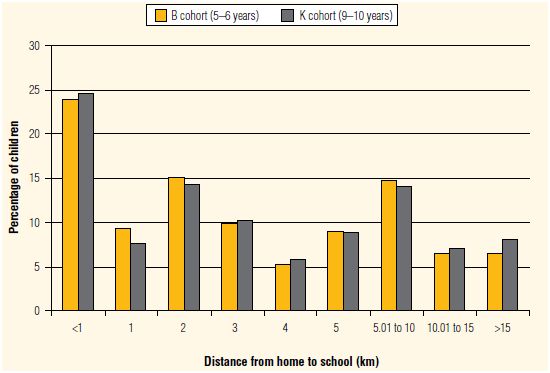
The majority of parents across the two cohorts reported living five kilometres or less from the study child’s school. Figure 6 shows the distribution of distances the B cohort and K cohort children live from their school. As illustrated below, the two cohorts show a very similar distribution. Fifty-eight per cent of B cohort children and 56 per cent of the K cohort children live within three kilometres of their school. Around 71 per cent of both B and K cohort children live within five kilometres of their school.
Figure 6: Reported distance from school to home by B and K cohort children
Source: LSAC B and K cohorts, Wave 3.5 data.
Figure 7 plots the mean distance between home and school by the type of transport taken and cohort. For families where the study child is driven to and from school every day, families lived an average of 6 and 6.5 kilometres from school for the B and K cohort children respectively. Children who use public transport on six or more trips week, live on average 11.5 kilometres (B cohort) and 12 kilometres (K cohort) from school. Those who ride or walk at least six times a week live much closer to school, at an average of 0.6 kilometre (B) and 1 kilometre (K).
Figure 7: Mean distance between school and home by mode of transport and cohort
Source: LSAC B and K cohorts, Wave 3.5 data.
Health
The health section of the Wave 3.5 explored parents’ overall perception of their child’s health, sleep patterns and pubertal development for the older group. Over 90 per cent of parents in each cohort thought their child’s health was good, very good or excellent.
Parents were also asked about the study child’s sleeping patterns, on both school days and non-school days.
Child development experts recommend that children aged 5 to 12 years should get about 10 to 11 hours sleep per night.2
On average, the B cohort children slept 10 hours and 49 minutes on a school night and 10 hours and 41 minutes on a non-school night. The K cohort children slept, on average, 10 hours and 12 minutes on a school night and 10 hours and 5 minutes on a non-school night. On average children in both cohorts do get the amount of sleep recommended by experts.
However, some children do fall outside the recommended amount of sleep they should be getting. Twelve per cent of the B cohort children slept less than 10 hours and 24 per cent slept more than 11 hours on a non-school night. On a school night, 6 per cent of B cohort children received less than 10 hours sleep, while 33 per cent had more than 11 hours of sleep.
On a school night, 57 per cent of B cohort children were reported to be in bed by 7:30pm, with 99 per cent in bed by 9pm. On non-school nights, 51 per cent of B cohort children were in bed by 8pm and 99 per cent were in bed by 10pm.
A higher number of children in the K cohort received less than the recommended amount of sleep when compared to the B cohort. On a school night, 24 per cent of K cohort children received less than 10 hours of sleep while only 5 per cent received over 11 hours. On a non-school night, 36 per cent of K cohort children received less than 10 hours and 7 per cent received over 11 hours.
On a school night, 44 per cent of K cohort parents reported their children went to bed by 8pm while 99 per cent of parents stated their child was in bed by 10pm. On a non-school night, 59 per cent of K cohort children were in bed by 9pm, increasing to 98 per cent by 10:30pm.
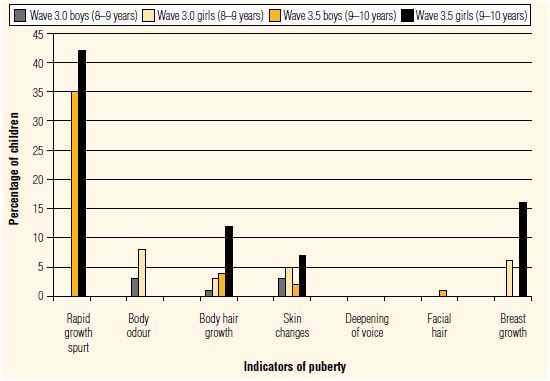
Wave 3 saw the introduction of questions about the onset of puberty for the K cohort. Four questions were asked in Wave 3 increasing to seven in Wave 3.5. Previous research shows that the first stages of puberty in girls can become evident from the age of 8 years continuing until 16 years of age, while in boys puberty starts anywhere between 10 to 12 years and can continue until 18 years of age.3
The study children at Wave 3.5 were 9 to 10 years of age and therefore we expected that some children would begin to show signs of puberty. Figure 8 shows the percentage of K cohort children showing signs of puberty, who participated in both Wave 3 and Wave 3.5, as reported by the main parent.
Figure 8: Parent report of puberty signs by sex of study child in Wave 3 and 3.5
Source: LSAC K cohort, Wave 3 & Wave 3.5.
Notes: Only those who completed both Wave 3 and Wave 3.5 included.
Skin changes, presence of body hair, and breast development were asked in both Wave 3 and 3.5, where as body odour was only measured in Wave 3. Deepening of the voice, rapid growth spurt and facial hair were only measured in Wave 3.5. Onset of menstruation was asked in Wave 3.5 but omitted due to unreliable data.
Figure 8 shows that the most common signs of puberty in the K cohort are rapid height increase (42 per cent of girls and 35 per cent of boys), followed by breast growth in girls (16 per cent), the appearance of body hair (12 per cent of girls and 4 per cent of boys) and skin changes (7 per cent of girls and 2 per cent of boys). Only 1 per cent of boys had started to experience facial hair growth while voice deepening does not appear to have started at this stage. The observed difference between the sexes is in line with the literature indicating that girls tend to start puberty younger than boys do.4
Media and technology
Parents of both cohorts reported they had rules surrounding their child’s use of media and technology in terms of both how much they use and what they watch. The vast majority of parents from both cohorts said they had rules about what programs the study child was allowed to watch on television (B=96 per cent; K=96 per cent). Just over three-quarters of both parent groups also reported they had rules on the amount of television children watched (B=77 per cent; K=76 per cent).
In July 2009, the Australian Communications and Media Authority (ACMA) released a paper using LSAC Wave 2.5 data: Use of electronic media and communications: early childhood to teenage years—findings from Growing Up in Australia: The Longitudinal Study of Australian Children (3 to 4 and 7 to 8 years), and media and communications in Australian families (8 to 17 year olds), 2007. The study found that ‘rules regarding both television content and timing were more often in place for younger children, and declined with age’ (p. 13).
In Wave 3.5, both cohorts had rules on what they could do on the computer (B=94 per cent and K=94 per cent) while 3 per cent of both B and K cohort children did not have any rules and a further 3 per cent of B and K cohort parents reported that the question did not apply to their family. Parents reporting that rules on computer use did not apply could indicate these households do not have access to a computer.
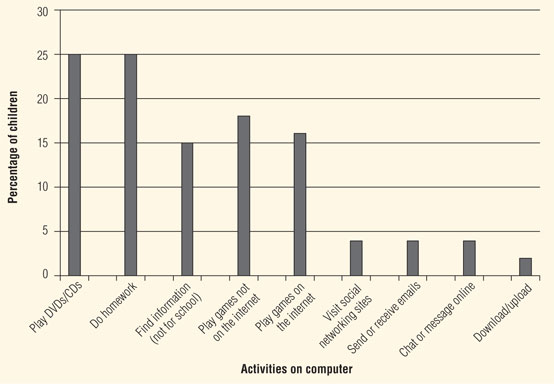
In Wave 3.5, 96 per cent of K cohort children had a computer at home and parents of these children were asked questions about their child’s use of the computer. Figure 9 shows what activities K cohort study children with access to a computer do on the computer at least once a week. Fifty-nine per cent of the K cohort children used it at least once a week to do their homework, 46 per cent played DVDs, 44 per cent used the computer to find information that was not related to school and 44 per cent used the computer to play games (that were not on the internet) at least once a week. Thirty-three per cent of K cohort children played games on the internet at least once a week, 30 per cent used the computer to send or receive emails, 11 per cent visited social networking websites, 9 per cent used the computer to chat or message online and 8 per cent used it to download or upload at least once a week.
Figure 9: The percentage of K cohort children (with access to a computer) and the type of activities they use it for at least once a week
Source: LSAC K cohort, Wave 3.5 data.
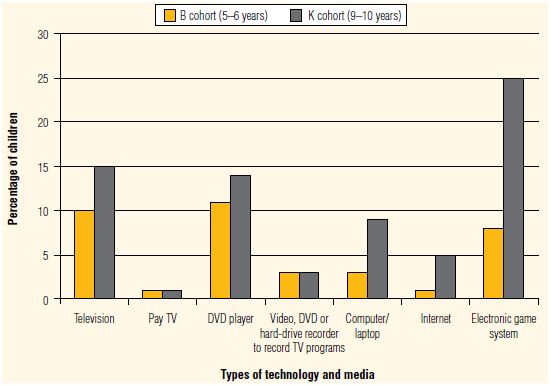
Parents also reported what types of media or technology their children had in their rooms. About 10 per cent of the B cohort and 15 per cent of the K cohort children had televisions in their rooms while fewer than 15 per cent of each group had a DVD player (B cohort=11 per cent; K cohort=14 per cent) in their rooms. This is interesting given that most experts recommend keeping television out of children’s bedrooms (see: <www.youngmedia.org.au> and <www.raisingchildren.net.au>). Figure 10 illustrates these findings.
Figure 10: Type of technology in study child's bedroom by percentage of children
Source: LSAC B and K cohorts, Wave 3.5 data.
The ACMA study reported similar findings on media technology in children’s bedrooms using Wave 2.5 of LSAC. They found children were more likely to have a television in their room than computer or internet access. They also found that older children were more likely to have a television, computer and/or internet access.5
In Wave 3.5, the largest difference between the B and K cohorts appeared with electronic games machines (such as Playstation, Xbox, Nintendo and handheld games devices). About one-quarter of K cohort children had access to gaming machines in their rooms compared to 8 per cent of the younger group.
Mobile phones are another form of media and technology children are increasingly using, with about one in 10 parents in the K cohort reporting that their child had a mobile phone for their own use. Of the 10 per cent of children who had a mobile phone for their own use, only 15 per cent of them used their phones to call friends one or more times a week while 30 per cent of them used their phones to text friends one or more times a week.
Study children are increasingly exposed to different forms of media and technology and the study asked parents about their concerns with what their children were doing and watching. Only a relatively small proportion of parents had concerns regarding their child’s use of media and technology, including TV and DVD watching, playing electronic games and using the internet (Figure 11). K cohort parents had higher levels of concern about their child’s media use compared to the B cohort. K cohort parents were most concerned about their child playing electronic games (21 per cent), followed by their TV watching (18 per cent), internet use (16 per cent), and DVD watching (10 per cent). By contrast, B cohort parents were most concerned about their child’s TV watching (12 per cent), followed by their electronic game use (8 per cent), DVD watching (7 per cent) and internet use (5 per cent).
Figure 11: Percentage of parents in B and K cohorts reporting concerns regarding media and technology use
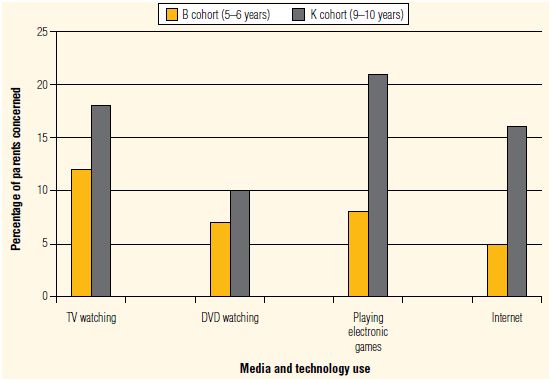
Source: LSAC B and K cohorts, Wave 3.5 data.
- Sigelman, CK & Rider, AE 2008, Life-span human development, 6th edition, Wadsworth Cengage Learning, Belmont.
- Stedman, TL 2000, Stedman’s Medical Dictionary, 27th edition, Lippincott Williams & Wilkins, Baltimore.
- Stedman, TL 2000, Stedman’s Medical Dictionary, 27th edition, Lippincott Williams & Wilkins, Baltimore.
- Australian Communications and Media Authority 2009, Use of electronic media and communications: early childhood to teenage years—findings from Growing Up in Australia: The Longitudinal Study of Australian Children (3 to 4 and 7 to 8 years), and media and communications in Australian families (8 to 17 year olds), 2007, Australian Media and Communications Authority, Canberra, p. 6.
Key personnel
| AIFS Management Team | |
| Executive Project Manager Dr Matthew Gray General Manager Dr Ben Edwards (2010) Diana Smart (2009) Project Manager Carol Soloff (2009) Design Manager Dr Jacqueline Harvey |
Data Manager Sebastian Misson (2009) Data Administrator Mark Sipthorp Senior Research Officer (2010)/Data Administrator (2009) Brigit Maguire Survey Officers Elaine Kong Suzanne MacLaren |
| FaHCSIA Management Team | |
| Branch Manager Carol Ey Dr Andrea Lanyon (A/g) Section Manager Dr Helen Rogers |
Research Officers Dr Helene Shin Hugh Webb Helen Harkin Amanda Knight Elaine Teran Adrian Fitzpatrick |
| ABS Management Team | |
| Director Celia Moss (until 2009) Justin Harvey (2009-2010) Research Officers Kathryn McGrouther (2010) Joanne Corey Karen Mornement |
Kym Byars Jennifer Gallagher Leesa McNaughton Annabel Parolo Byron Kemp Anneka Branson Melieta Bianchi Christopher Hoitinik |
| Consortium Advisory Group | |
| Professor Stephen Zubrick (Chair) University of Western Australia Professor Ann Sanson (Principal Scientific Advisor) University of Melbourne Dr John Ainley Australian Council for Educational Research Professor Donna Berthelsen Queensland University of Technology Professor Michael Bittman University of New England Associate Professor Jan Nicholson Murdoch Children’s Research and The McCaughey Centre Professor Bryan Rodgers Australian National University |
Professor Sven Silburn Menzies School of Health Research, Centre for Developmental Health Dr Lyndall Strazdins Murdoch Children’s Research Dr Bruce Bradbury University of New South Wales Associate Professor Linda Harrison Charles Sturt University Professor Michael Sawyer University of Adelaide Professor Graham Vimpani University of Newcastle Professor Melissa Wake Murdoch Children’s Research Institute |
| Consultants | |
| Dr Sheldon Rothman Australian Council for Educational Research |
Professor Peter Brandon Australian National University |
| Data Expert Group | |
| Professor Stephen Zubrick (Chair) Telethon Institute for Child Health Research Professor John Carlin Murdoch Children’s Research Institute Dr Ben Edwards Australian Institute of Family Studies Dr Sam Rothman Australian Council for Educational Research |
Stephen Horn Department of Families, Housing, Community Services & Indigenous Affairs Mark Sipthorp Australian Institute of Family Studies Dr Gerry Redmond Social Policy Research Centre Graeme Thomson Australian Bureau of Statistics |
Data users and website activities
At the end of the 2009-10 financial year there were approximately 370 registered users of LSAC data. Twenty-four per cent of users were from Victoria and New South Wales, 19 per cent were from the Australian Capital Territory and 15 per cent were from Queensland. A small number of data users were from South Australia, Western Australia and overseas and no data users registered from the Northern Territory or Tasmania.
The Growing Up in Australia website, <http://www.aifs.gov.au/growingup/>, established in March 2002, undertook changes in 2009-10, with links now available for participants to update their contact details online. Links also allow participants to easily access updates from the study. The website has areas to cater for study participants (children and parents), data users, researchers and policy makers. There continues to be an ongoing interest in publications and papers produced on the LSAC study, as illustrated in the table below.
|
Release date
|
2004-05
|
2005-06
|
2006-07
|
2007-08
|
2008-09
|
2009-10
|
|
|---|---|---|---|---|---|---|---|
| Total site visits | 57,227 | 85,966 | 107,890 | 155,144 | 182,263 | 202,264 | |
| All publications | 14,860 | 19,664 | 37,387 | 51,501 | 55,919 | 88,172 | |
| 2004 Annual Report | 24 May 2005 | 501 | 10,831 | 9,024 | 5,183 | 2,747 | 925 |
| 2005-06 Annual Report | 11 December 2006 | 8,026 | 4,817 | 1,339 | 426 | ||
| 2006-07 Annual Report | 19 June 2008 | 2,938 | 4,122 | 691 | |||
| 2007-08 Annual Report | 3 December 2008 | 1,970 | 998 | ||||
| 2008-09 Annual Report | November 2009 | 5,562 | |||||
| Discussion Paper 1 | 27 March 2002 | 3,002 | 17,844 | 15,198 | 4,927 | 3,734 | 2,575 |
| Discussion Paper 2 | 22 September 2003 | 1,483 | 1,721 | 2,987 | 2,830 | 1,743 | 1,316 |
| Discussion Paper 3 | 3 May 2004 | 10,317 | 10,389 | 9,471 | 9,104 | 1,574 | 1,196 |
| Discussion Paper 5 | 28 June 2007 | 196 | 2,182 | 1,573 | 1,228 | ||
| Technical Paper 1 | 26 September 2005 | 2,521 | 3,401 | 4,702 | 8,823 | 6,042 | |
| Technical Paper 2 | 11 January 2006 | 2,322 | 1,960 | 1,945 | 1,454 | 1,367 | |
| Technical Paper 3 | 25 May 2006 | 103 | 1,351 | 1,188 | 1,165 | 1,030 | |
| Technical Paper 4 | July 2007 | 1,896 | 1,392 | 1,061 | |||
| Technical Paper 5 | October 2007 | 671 | 1,210 | 936 | |||
| Technical Paper 6 | August 2009 | 701 | |||||
| Newsletters | 7,928 | 8,257 | 12,431 | 18,589 | 20,699 | 15,286 | |
| Data dictionary | 30 May 2005 | 150 | 2,237 | 2,625 | 1,931 | 2,374 | 1,099 |
Publications and presentations
Government reports
Australian Communications and Media Authority 2009, Use of electronic media and communications: early childhood to teenage years—findings from Growing Up in Australia: The Longitudinal Study of Australian Children (3 to 4 and 7 to 8 years), and media and communications in Australian families (8 to 17 year olds), 2007, Australian Media and Communications Authority, Canberra.
Australian Institute of Family Studies 2010, The best start: supporting happy, healthy childhoods, Australian Institute of Family Studies, Melbourne.
Australian Institute of Health and Welfare 2009, A picture of Australia’s children 2009, Australian Institute of Health and Welfare, Canberra.
Publications
Baxter, J 2009a, Parental time with children: do job characteristics make a difference?, Research Policy Paper no. 44, Australian Institute of Family Studies, Melbourne.
Baxter, J 2009b, ‘Mother’s timing of return to work by leave use and pre-birth job characteristic’, Journal of Family Studies, vol. 15, no. 2, pp. 153-66.
Baxter, J 2010, An exploration of the timing and nature of parental time with 4-5 year olds using Australian children’s time use data, Research Paper no. 45, Australian Institute of Family Studies, Melbourne.
Baxter, J, Cooklin, AR & Smith, J 2009, ‘Which mothers wean their babies prematurely from full breastfeeding?: An Australian cohort study’, Acta Paediatrica, vol. 98, no. 8, pp. 1274-77.
Brennan, D 2009, ‘Australia: the difficult birth of paid maternity leave’, in S Kamerman & P Moss (eds), The politics of parental leave policies: children, parenting, gender and the labour market, The Policy Press, Bristol, p. 15.
Blakemore, T, Strazdins, L & Gibbings, J 2009, ‘Measuring family socioeconomic position’, Australian Social Policy, vol. 8, pp.121-68.
Bowes, J & Race, R (eds) 2009, Research on children, families and communities, Oxford University Press, South Melbourne.
Brown, JE, Broom, DH, Nicholson, JM & Bittman, M 2010, ‘Do working mothers raise couch potato kids? Maternal employment and children’s lifestyle behaviours and weight in early childhood’, Social Science & Medicine, vol. 70, no. 11, pp. 1816-24.
Davis, E, Sawyer, MG, Lo, SK, Priest, N & Wake, M 2010, ‘Socioeconomic risk factors for mental health problems in 4-5-year-old children: Australian population study’, Academic Pediatrics, vol. 10, no. 1, pp. 41-47.
Edwards, B & Bromfield, LM 2010 ‘Neighbourhood influences on young children’s emotional and behavioural problems’, Family Matters, vol. 84, pp. 7-19.
Edwards, B, Baxter, J, Smart, D, Sanson, A & Hayes, A 2009, ‘Financial disadvantage and children’s school readiness’, Family Matters, vol. 83, pp. 23-31.
Emerson, E & Einfield, S 2010, ‘Emotional and behavioural difficulties in young children with and without development delay: a bi-national perspective’, Journal of Child Psychology & Psychiatry and Allied Disciplines, vol. 51, pp. 583-93.
Emerson, E & Robertson, J 2010, ‘Obesity in young children with intellectual disabilities or borderline intellectual functioning’, International Journal of Paediatric Obesity, vol. 5, no. 4, pp. 320-26.
Emerson, E, Einfield, S & Stancliffe, RJ 2010, ‘The mental health of young children with intellectual disabilities or borderline intellectual functioning’, Social Psychiatry and Psychiatric Epidemiology, vol. 45, no. 5, pp. 579-87.
Gray, M & Smart, D 2009, ‘Growing Up in Australia: the Longitudinal Study of Australian Children: a valuable new data source for economists’, Australian Economic Review, vol. 42, no. 3, pp. 367-76.
Harrison, LJ & McLeod, S 2010, ‘Risk and protective factors associated with speech and language impairment in a nationally representative sample of 4- to 5-year-old children’, Journal of Speech, Language & Hearing Research, vol. 53, no. 2, pp. 508-29.
Harrison, LJ, McLeod, S, Berthelsen, D & Walker, S 2009, ‘Literacy, numeracy, and learning in school-aged children identified as having speech and language impairment in early childhood’, International Journal of Speech-Language Pathology, vol. 11, no. 5, pp. 329-403.
Harrison, L, Ungerer, J, Smith, G, Zubrick, S & Wise, S with Press, F, Waniganayake, M & The LSAC Research Consortium 2010, Child care and early education in Australia, Social Policy Research Paper no. 40, Department of Families, Housing, Community Services and Indigenous Affairs, Australia.
Khanam, R, Hong Son, N & Connelly, LB 2009, ‘Child health and the income gradient: evidence from Australia’, The Journal of Health Economics, vol. 28, no. 4, pp. 805-17.
McLeod, S & Harrison, LJ 2009, ‘Epidemiolology of speech and language impairment in a nationally representative sample of 4- to 5 year-old children’, Journal of Speech, Language & Hearing Research, vol. 52, no. 5, pp. 1213-29.
Ou, L, Chen, J & Hillman, K 2010, ‘Health service utilisation disparities between English speaking and non-English speaking background Australian infants’, BMC Public Health, vol. 10, p. 182.
Ou, L, Chen, J, Hillman, K & Eastwood, J 2010, ‘The comparison of health status and health services utilisation between Indigenous and non-Indigenous infants in Australia’, Australian and New Zealand Journal of Public Health, vol. 34, no. 1, pp. 50-56.
Renda, J, Baxter, J & Alexander, M 2009, ‘Exploring the work-family policies mothers say would help after the birth of a child’, Australian Journal of Labour Economics, vol. 12, no. 1, pp. 65-87.
Rutherford, L, Bittman, M & Biron, D 2010, Young children and the media: a discussion paper, Australian Research Alliance for Children & Youth, Melbourne.
Sanson, A, Hawkins, MT, Mission, S & The LSAC Consortium 2010, ‘The development and validation of Australian indices of child development—Part I: Conceptualisation and development’, Child Indicators Research, vol. 3, pp. 293-312.
Sanson, A, Hawkins, MT, Mission, S & The LSAC Consortium 2010, ‘The development and validation of Australian indices of child development—Part II: Validity support’, Child Indicators Research, vol. 3, pp. 293-312.
Strazdins, L, Shipley, M, Clements, M, Obrien, LV & Broom, DH 2010, ‘Job quality and equality: parents’ jobs and children’s emotional and behavioural difficulties’, Social Science and Medicine, vol. 70, no. 12, pp. 2052-60.
Walker, S & Berthelsen, D 2010, ‘Social inequalities and parent involvement in children’s education in the early years of school’, in V Green & S Charrington (eds), Developing diversity: an international exploration of issues in diversity in education, Nova Science Publishers, pp. 139-49.
Yamachi, C 2010, ‘Parental investment in children: differential pathways of parental education and mental health’, The Economic Record, vol. 86, no. 273, pp. 210-26.
Yu, M, Ziviani, J, Baxter, J & Hyanes, M (in press), ‘Time use, parenting practice and conduct problems in four- to five-year-old Australian children’, Australian Occupational Therapy Journal.
Yu, M 2010, Physical, structural, and social aspects of activity engagement and conduct disorders in young Australian children, PhD Thesis, School of Health & Rehabilitation Sciences, The University of Queensland.
Conference presentations
Baxter, J & Smith, J 2009, Breastfeeding and infant time use, paper presented at the Growing Up in Australia: the Longitudinal Study of Australian Children 2nd Research Conference, Melbourne, 3-4 December.
Bayer, JK, Ukoumunne, OC, Scalzo, K, Wake, M, Lucas, N & Nicholson, J 2009, Early childhood aetiology of mental health problems: a national longitudinal study, paper presented at the Growing Up in Australia: the Longitudinal Study of Australian Children 2nd Research Conference, Melbourne, 3-4 December.
Berthelsen, D, Walker, S & Nicholson, J 2009, How well are Australian children doing in their first year of school?, paper presented at the 14th European Conference on Developmental Psychology, Vilnius, Lithuania, 18-22 August.
Bittman, M & Chalmers, J 2009, Investing in working families: which policies promote the best balance of time and money for parents and children?, paper presented at the 11th Australian Social Policy Conference, Sydney, 8-10 July.
Bittman, M, Rutherford, L & Unsworth, L 2009, Digital natives, issues and evidence about children’s use of new and old media, paper presented at the Growing Up in Australia: the Longitudinal Study of Australian Children 2nd Research Conference, Melbourne, 3-4 December.
Blakemore, T & Shipley, M 2009, Whom do we reach? Exploring health and community service use by Australian families with young children, paper presented at the 11th Australian Social Policy Conference, Sydney, 8-10 July.
Blakemore, T, Shipley, M, Waters, S & Zubrick, S 2009, Measuring family disadvantage in the Longitudinal Study of Australian Children, paper presented at the Growing Up in Australia: the Longitudinal Study of Australian Children 2nd Research Conference, Melbourne, 3-4 December.
Brown, J 2009, The impact of socio-economic background on the association between television viewing and developmental outcomes among young Australian children, paper presented at the 11th Australian Social Policy Conference, Sydney, 8-10 July.
Burke, KJ 2009, The role of dietary habits in the psychosocial health of Australian children, paper presented at the Growing Up in Australia: the Longitudinal Study of Australian Children 2nd Research Conference, Melbourne, 3-4 December.
Claessens, A 2009, School readiness and achievement in middle childhood, paper presented at the Growing Up in Australia: the Longitudinal Study of Australian Children 2nd Research Conference, Melbourne, 3-4 December.
Edwards, B, Fiorini, M & Taylor, M 2009, Does it matter at what age children start school in Australia? Investigating the effects of school starting age on six-year old children’s outcomes, paper presented at the 11th Australian Social Policy Conference, Sydney, 8-10 July.
Emerson, E, Einfeld, S & Stancliffe, R 2009 Persistence and emergence of conduct difficulties in children with intellectual limitations, paper presented at the Growing Up in Australia: the Longitudinal Study of Australian Children, 2nd Research Conference, Melbourne, 3-4 December.
Fenech, M, Sweller, N & Harrison, L 2009, Identifying high quality centre-based childcare using quantitative data sets: what numbers do and don’t tell us, paper presented at the 11th Australian Social Policy Conference, Sydney, 8-10 July.
Fiorini, M & Keane, M 2009, How the allocation of children's time affects cognitive and non-cognitive development, paper presented at the Growing Up in Australia: the Longitudinal Study of Australian Children, 2nd Research Conference, Melbourne, 3-4 December.
Grahman, B & Losoncz, I 2009, The effect of mothers’ experience of extended work-life tension on child outcomes, paper presented at the Growing Up in Australia: the Longitudinal Study of Australian Children, 2nd Research Conference, Melbourne, 3-4 December.
Hand, K, Berthelsen, D, Walker, S & Nicholson, J 2009, The quality of teacher-child relationships for young children with parent reported language concerns, paper presented at the 16th Biennial Conference of the Australasian Human Development Association, Adelaide, 6-8 July.
Harrison, LJ, McLeod, S, Berthelson, D & Walker, S 2009, Impact of speech and language impairment at 4- to 5-years on literacy, numeracy, and learning at 6- to 7-years, paper presented at the Growing Up in Australia: the Longitudinal Study of Australian Children, 2nd Research Conference, Melbourne, 3-4 December.
Hillman, K, Khoo, ST & Ozolins, C 2009, Growth in receptive vocabulary among four to eight year olds: using growth modelling with the LSAC K cohort, paper presented at the Growing Up in Australia: the Longitudinal Study of Australian Children, 2nd Research Conference, Melbourne, 3-4 December.
Hiscock, H, Scalzo, K, Canterford, L & Wake, M 2009, Does sleep duration predict increasing BMI in children aged 0-7 years?: Longitudinal Study of Australian Children, paper presented at the Growing Up in Australia: the Longitudinal Study of Australian Children, 2nd Research Conference, Melbourne, 3-4 December.
Kalil, A, Ryan, RM, Claessens, A & Corey, M 2009, Maternal education and the developmental gradient in time with children: evidence from Australia, paper presented at the Growing Up in Australia: the Longitudinal Study of Australian Children, 2nd Research Conference, Melbourne, 3-4 December.
Kanjanapan, W 2009, Early maternal employment and children’s development in Australia, paper presented at the Growing Up in Australia: The Longitudinal Study of Australian Children, 2nd Research Conference, Melbourne, 3-4 December.
Katz, I, Redmond, G & Smart, D 2009, Inter-generational mobility in Australia, paper presented at the Growing Up in Australia: the Longitudinal Study of Australian Children, 2nd Research Conference, Melbourne, 3-4 December.
Khanam, R, Ngheim, HS & Connelly, LB 2009, Child health and income gradient in Australia: the role of chronic condition, paper presented at iHEA 7th World Congress on Health Economics International Health Economic Association, Beijing, 12-15 July.
Khanam, R, Ngheim, HS & Connelly, LB 2009, Child health and chronic conditions: does income mediate?, paper presented at the 38th Australian Conference of Economists, Adelaide, 28-30 September.
Khanam, R, Ngheim, HS & Connelly, LB 2009, Does maternity leave effect child health? Evidence form Parental Leave in Australia Survey, paper presented at the 31st Australian Conference of Health Economists, Tasmania, 1-2 October.
Lee, JS 2009, The negative effects of persistent poverty on children's physical, socio-emotional, and learning development, paper presented at the Growing Up in Australia: the Longitudinal Study of Australian Children, 2nd Research Conference, Melbourne, 3-4 December.
Leigh, A & Yamauchi, C 2009, Which children benefit from non-parental care?, paper presented at the Growing Up in Australia: the Longitudinal Study of Australian Children, 2nd Research Conference, Melbourne, 3-4 December.
Lucas, N, Kilpatrick, N, Neumann, A, Chapman, J & Nicholson, J 2009, Inequalities in reported oral health and dental service utilization of Australian children aged 2-3 and 6-7 years, paper presented at the Public Health Association of Australia Conference, Canberra, 28-30 September and at the Growing Up in Australia: the Longitudinal Study of Australian Children, 2nd Research Conference, Melbourne, 3-4 December.
McLeod, S, Harrison, L, McAllister, L & McCormack, J 2009, Prevalence of communication impairment in 4-to 5-year-old Australian children, paper presented at the HCSNet Event: The Australian Language and Speech Conference, Sydney, 3-4 December.
McLeod, S, McCormack, J, McAllister, L & Harrison, LJ 2010, Severity and nature of speech impairment in a community sample of 4- to 5-year-old children, paper presented at the International Clinical Phonetics and Linguistics Association (ICPLA), Oslo, Norway, 23-26 June.
Nicholson, J, Bethelsen, D, Lucas, N & Wake, M 2009, Socio-economic inequalities in physical, behavioural and cognitive outcomes for Australian children, birth to 6 years, paper presented at the 14th European Conference on Developmental Psychology, Vilnius, Lithuania, 18-22 August & the Growing Up in Australia: the Longitudinal Study of Australian Children, 2nd Research Conference, Melbourne, 3-4 December.
Nicholson, J, Bethelsen, D, Lucas, N & Wake, M 2010, Early impacts of socio-economic inequalities vary by age and physical/developmental outcome: National Australian Study, paper presented at the Pediatric Academic Societies’ Annual Meeting, Vancouver, BC, Canada, 1-4 May.
Nicol, A 2009, What event matters? Exploring the relationship between stressful events and psychological distress in mothers of infants, paper presented at the 11th Australian Social Policy Conference, Sydney, 8-10 July.
Ou, L & Chen, J 2009, The gaps in health outcome and health services utilization between Indigenous and non-Indigenous Australian infants and attributable causal effects: where to intervene and how big impact are they?, paper presented at the Growing Up in Australia: the Longitudinal Study of Australian Children, 2nd Research Conference, Melbourne, 3-4 December.
Redmond, G 2009, Using LSAC to examine the adequacy of Australia children’s living standards, paper presented at the Growing Up in Australia: the Longitudinal Study of Australian Children, 2nd Research Conference, Melbourne, 3-4 December.
Rothman, S 2009, The development and use of educational measures in the Longitudinal Study of Australian Children, paper presented at the Growing Up in Australia: the Longitudinal Study of Australian Children, 2nd Research Conference, Melbourne, 3-4 December.
Sanson, A, Smart, D & Misson, S 2009, Children’s physical, cognitive and socio-emotional outcomes: do they share the same drivers?, paper presented at the Growing Up in Australia: the Longitudinal Study of Australian Children, 2nd Research Conference, Melbourne, 3-4 December.
Sanson, A, Smart, D, Baxter, J, Edwards, B & Hayes, A 2009, Home to school transitions for financially disadvantaged children: findings from LSAC Waves 1 and 2, paper presented at the 16th Biennial Conference of the Australasian Human Development Association, Adelaide, 6-8 July.
Shin, H 2009, Talking to children early but respectfully: the effect of inductive reasoning and hostile parenting at age 4-5 on child’s conduct problems at age 6-7 using LSAC Waves 1 and 2, paper presented at the Growing Up in Australia: the Longitudinal Study of Australian Children, 2nd Research Conference, Melbourne, 3-4 December.
Shipley, M & Blakemore, T 2009, Parenting in place: exploring parenting behaviours and socioeconomic position in the context of neighbourhoods, paper presented at the 11th Australian Social Policy Conference, Sydney, 8-10 July & at the Growing Up in Australia: the Longitudinal Study of Australian Children, 2nd Research Conference, Melbourne, 3-4 December.
Silburn, SR & Brinkman, SA 2009, The Australian Early Development Index (AEDI) and other measures of early child development as predictors of children’s school learning and behaviour, paper presented at the Growing Up in Australia: the Longitudinal Study of Australian Children, 2nd Research Conference, Melbourne, 3-4 December.
Smart, D, Sanson, A, Baxter, J, Edwards, B & Hayes, A 2009, Home to school transitions for financially disadvantaged children: findings from Growing Up in Australia, the Longitudinal Study of Australian Children, paper presented at the 11th Australian Social Policy Conference, Sydney, 8-10 July.
Smart, D, Sanson, A, Baxter, J, Edwards, B & Hayes, A 2009, The school progress of children from financially disadvantaged and non-disadvantaged families, paper presented at the Growing Up in Australia: the Longitudinal Study of Australian Children, 2nd Research Conference, Melbourne, 3-4 December.
Soloff, C 2009, Growing Up in Australia: The Longitudinal Study of Australian Children: study overview, paper presented at the 16th Biennial Conference of the Australasian Human Development Association, Adelaide, 6-8 July.
Soloff, C 2009, Data linkage: benefits and pitfalls, paper presented at the Maximising the value of longitudinal studies for policy and science: methodological and analysis issues workshop Canberra, 12-13 November.
Taylor, M, Fiorini, M & Edwards, B 2009, Does it matter at what age children start school in Australia? Investigating school starting age and six-year old children’s outcomes, paper presented at the Growing Up in Australia: the Longitudinal Study of Australian Children, 2nd Research Conference, Melbourne, 3-4 December.
Taylor, M & Gray, M 2009, The impact of child support payments on the labour supply decisions of resident mothers, paper presented at the Growing Up in Australia: the Longitudinal Study of Australian Children, 2nd Research Conference, Melbourne, 3-4 December.
Taylor, N & Thapa, P 2009, The production of cognitive and non-cognitive gaps in children: the contribution of family income, resources and parenting, paper presented at the Growing Up in Australia: the Longitudinal Study of Australian Children, 2nd Research Conference, Melbourne, 3-4 December.
Wake, M & Smith, K 2009, Changes in preschooler obesity between 2004 and 2008: is there hope after the hype?, paper presented at the Growing Up in Australia: the Longitudinal Study of Australian Children, 2nd Research Conference, Melbourne, 3-4 December.
Walker, S & Berthelsen, D 2009, Quality of the home learning environment and the transition to school, paper presented at the Growing Up in Australia: the Longitudinal Study of Australian Children, 2nd Research Conference, Melbourne, 3-4 December.
Walker, S & Berthelsen, D 2009, Gender difference in children’s classroom behaviour and teacher-child relationships in early childhood: an Australian study, paper presented at the 14th European Conference for Developmental Psychology, Vilnius, Lithuania, 18-22 August.
Waters, A, Poulos, LM, Ampon, RD, Zinoviev, A, Xuan, W, Reddel, HK & Marks, GB 2009, Prognostic significance of parental reports of ‘asthma’ and ‘wheeze’ in kindergarten children, paper presented at the Growing Up in Australia: the Longitudinal Study of Australian Children, 2nd Research Conference, Melbourne, 3-4 December.
Whitehouse, G, Romaniuk, H, Lucas, N & Nicholson, J 2009, Parental leave, maternal mental wellbeing, couple relationship and quality of parenting: evidence from the Longitudinal Study of Australian Children, paper presented at the Growing Up in Australia: the Longitudinal Study of Australian Children, 2nd Research Conference, Melbourne, 3-4 December.
Technical papers
Misson, S 2009, Wave 3 weighting and non-response, Institute of Family Studies, Melbourne.
Data access
Data from Growing Up in Australia: the Longitudinal Study of Australian Children is warehoused at the Australian Institute of Family Studies and is available to researchers approved by the Australian Government Department of Families, Housing, Community Services and Indigenous Affairs. Prospective users must abide by strict security and confidentiality protocols and are required to complete a dataset application and read and sign a deed of licence.
Data from Waves 1, 1.5, 2, 2.5, 3 and 3.5 are currently available. Application forms and deeds of licence are available on the study’s website <www.aifs.gov.au/growingup>. A nominal fee is charged to cover the administrative costs of delivering datasets.
The Australian institute of Family Studies (AIFS) provides user support services. Datasets are accompanied by a user manual that includes a description of the sample design, how the study was conducted, details of weighting procedures and item derivations, and a listing of variable names, labels and response categories. User training sessions are conducted to expand upon the information provided in the user manual. Please contact the AIFS data manager if you are interested in attending a data user training session.
For data requests, contact
Growing Up in Australia Data Manager
Phone: (03) 9214 7803
Fax: (03) 9214 7839
Email: <aifs-lsac@aifs.gov.au>
More information on Growing Up in Australia can be found on the study website <www.aifs.gov.au/growingup>. People with an interest in the study can join the email alert group to receive regular information on the study.
To join, send the following email:
To: <majordomo@aifs.gov.au>
Subject: (leave blank)
In the body of the email, type: subscribe growingup-refgroup
For general enquiries contact:
Growing Up in Australia Senior Research Fellow
Phone: (03) 9214 7853
Fax: (03) 9214 7839
Email: <aifs-lsac@aifs.gov.au>
For study participant enquiries contact:
ABS
Phone: 1800 005 508
Email: <growingup@abs.gov.au>
Last updated: