SFCS National Evaluation Baseline Report on Communities for Children Process Evaluation
Attachments
Baseline Report on Communities for Children Process Evaluation
- List of tables
- Executive Summary
- 1. Introduction
- 2. Demographic profiles
- 3. Service mapping
- 4. Service coordination study
- 5. Fieldwork - service coordination study and partnership model study
- 6. Discussion
- References
- Appendices
List of tables
Table 1: National evaluation components
Table 2: Summary profile of CfC sites
Table 3: CfC sites by SEIFA Index of Disadvantage rankings, Statistical Local Areas, 2001
Table 4: Revised Service Mapping Typology sent to FPs
Table 5: Baseline Service Mapping for selected sites by Service Category
Table 6: Snapshot questionnaire: domains and indicators
Table 7: Respondents' position within their organisation
Table 8: Full-time equivalent staff employed by agencies in the LGA/CfC site
Table 10: Respondents' knowledge of CfC
Table 11: Agency's role in relation to CfC
Table 12: Proportion of services devoted to 0-5 year olds and their families by Agency Role in CfC
Table 14: Use of SFCS Outcomes Framework data by agency role in CfC
Table 15: Interagency involvement in various activities, and helpfulness score
Table 16: Level of involvement in interagency arrangements
Table 19: Perceived accuracy of statements describing circumstances in communities
Table 20: Awareness of services for 0-5 year olds and their families
Table 21: Pre-CfC interagency groups or committees designed to meet the needs of children aged 0-5
Table 22: Helpfulness of pre-CfC interagency groups or committees
Table 24: Current working relationship with other services
Table 25: Providing services in partnership with other agencies
Table 26: Helpfulness of providing services in partnership with other agencies
Table 28: Day-to-day Co-ordination - Score/Colour Code
Table 29: Effective Partnerships - Score/Colour Code
Table 30: Day-to-day Co-ordination - Site Mean Comparison
Table 31: Effective Partnerships - Site Mean Comparison
Table 32: Day-to-day Co-ordination - SFIA/Non-SFIA Group Comparison (Percentages)
Table 33: Effective Partnerships - SFIA/Non-SFIA Group Comparison (Percentages)
Table 34: Number of interviews by CfC site
Table 35: Number of interviews by contact type
Executive summary
This report contains a description of the methods and baseline results of the process evaluation of the Communities for Children (CfC) program, which is part of the Stronger Families and Communities Strategy (SFCS). The process evaluation reported here represents a subset of the National Evaluation of the SFCS and includes information from:
- Demographic profiles
- Service mapping
- Service coordination survey
- Field work relating to partnership model and service coordination.
Demographic profiles
A demographic profile of each community was compiled using data from the Census of Population and Housing, 2001. The key purpose was to provide contextual information about the social and economic characteristics of CfC sites, and the demographic characteristics of children aged five and under and their families. This provides a backdrop that helps to understand the different contexts in which CfC has been implemented.
Populations in CfC sites were more disadvantaged than the Australian population on most relevant indicators. CfC sites had higher proportions of children aged 0-5 years who lived in lone parent households than the national average, higher proportions with a parent unemployed, and higher proportions who lived in low-income families. Families with children aged 0-5 years in CfC areas were also more culturally diverse. Although the same proportion of the overall population was born outside the main English speaking countries in Australia and in CfC sites, there were higher proportions of children in CfC sites with mothers who did not speak English very well. CfC sites also had higher proportions of children who were of Aboriginal or Torres Strait Island descent, compared with Australia as a whole. Populations in CfC areas were also less likely to have attained Year 12 or equivalent levels of qualifications.
Service mapping
In the CFC sites at the commencement of the initiative, education services were the most prevalent services for children aged 0-5 years and their families (39%), followed by general child and family services (23%) and health services (20%). An additional 12% of services targeted population groups with a high risk of disadvantage. Nearly all FPs reported the existence of relevant networks in their site.
There was substantial variety in the number and type of services and networks available in each site. Overall, the number of services in the sites ranged from 39 to 227. Looking at the range in numbers of specific service categories, the number of educational services ranged from 11 to 87, the number of general child and family services ranged from 6 to 56 services, the number of general health services ranged from 2 to 61, and the number of services for population groups with a high risk of disadvantage ranged from 0 to 36. The number of supportive networks in each site ranged from 0 to 22.
Service coordination survey
The Service Coordination Study was built on the data collected in the baseline service mapping. It provided information about how services in CfC sites worked together. The logic model of the SFCS indicates that outcomes for children and families depend not just on service output, but also on how services and other initiatives are coordinated and work together at a strategic and operational level.
Most services used a combination of information sources to plan, allocate resources and identify service gaps in their communities. Just over three-quarters of services used feedback from service users, while many also used client information from services and community-level information. Just over half of all agencies involved with CfC used the SFCS Outcomes Framework data, compared with 5% of those without any involvement in CfC.
Respondents who held senior positions were significantly less involved in interagency arrangements than service delivery staff who responded to the survey. Respondents in frontline and service coordinator positions were most often the ones carrying out interagency activities. Agencies most commonly collaborated by referring clients to one another, exchanging information and conducting interagency meetings.
Respondents most frequently believed that the lack of integration between different levels of government, staff problems and competition for funding between agencies were the factors most likely to hinder effective partnerships. The factors most likely to be reported as promoting effective partnerships were 'respect and understanding of the needs of families' and a 'willingness to work together'. Many respondents also called for more commitment to interagency cooperation from senior staff, with many believing that strong leadership from agency administrators and a common goal of cooperation could facilitate effective partnerships.
Most respondents believed that there was a good understanding of the importance of the early years and were moderately confident that there was a shared vision about the needs of young children in their agencies.
The majority of respondents did at least some work with other service providers (70%), with about one-third saying that their service worked closely with other services most of the time. However, relatively few respondents (12%) thought that services currently worked together as a well-coordinated team and 58% thought that services were only partially coordinated at present.
A similar picture emerged when respondents were asked how often they believed services were provided in partnership with other agencies. About half of all respondents believed that services were provided though interagency partnership 'quite often' or 'sometimes' and very few said that services were 'rarely' or 'never' provided in partnership (11%).
Respondents were generally positive about providing services in partnership with other agencies, with 63% of respondents finding it 'very helpful' or 'mostly helpful'. Respondents working in agencies that currently provided services in partnership with other agencies most or all of the time were even more positive, and 96% of these respondents found interagency partnerships to be 'very helpful' or 'mostly helpful'.
To compare the level of service coordination between Stronger Families in Australia (SFIA) study sites, two composite indicators, Day-to-day Co-ordination and Effective Partnerships, were created. These indicators suggested that the majority of the sites had Moderate levels of Day-to-day Coordination and High levels of Effective Partnerships at baseline. A comparison of the SFIA and non-SFIA sites showed a similar spread between the indicators overall and suggests that the indicators are quite robust.
It seems that while many services are currently cooperating with one another to provide services to young children and their families, more could be done to collaborate further. A stronger commitment from senior managers and an explicitly stated goal of coordination could bring about more meaningful cooperation between agencies and improve service provision.
Fieldwork relating to partnership model and service coordination
As part of the Service Coordination Study and the Partnership Model Study, in-depth interviews with CfC key personnel were held during October and November 2006 in the 10 CfC sites where the SFIA study was being conducted. In each site between seven and 12 semi-structured interviews were conducted with key personnel involved with CfC. Respondents included senior managers and Project Managers of the Facilitating Partner (FP) organisations, CfC committee members, service providers, community members, local government representatives and FaCSIA State and Territory Officers.
Under the Facilitating Partner (FP) model, a Non-Government Organisation (NGO) was chosen as the lead agency in each CfC site. Often the NGO was locally based and well integrated into the site's existing service network. Overall the community-based nature of CfC was regarded by participants as positive. Most interviewees found that it gave the project credibility and instilled a sense of community ownership.
However, the effectiveness of the NGO in implementing CfC varied depending on the skills of the FP personnel and the resources at their disposal. In sites where FP personnel were able to develop relationships with stakeholders easily and to spread enthusiasm about CfC the implementation process progressed more smoothly. Support from the NGO's state or national offices was also important in the implementation process due to the complex administrative, management and legal tasks required from them as the leaders of a multi-million-dollar project.
Facilitating Partners (FPs) also received support from the government funding body, FaCSIA. The department's regional representatives, the State or Territory Officers, provided interpretation of FaCSIA requirements and guidance for the implementation.
In addition, many interviewees said that they thought there was a lack of clarity in the FaCSIA requirements and also said that delays in responses from the Department created difficulties. However it should be recognised that CfC represented an entirely new format for Government funding of NGOs, and in addition was a relatively large initiative. From a governmental perspective, therefore, comprehensive accountability arrangements are necessary whenever substantial funding is committed to a new model. FaCSIA responded to feedback from FPs. This included streamlining reporting requirements and decreasing the frequency of reports.
The implementation of CfC appears to have been useful as a vehicle for increasing the level of service cooperation in the sites. Under the model, the FPs were required to establish the Communities for Children Committee (CCC), a working group of child and family services and other stakeholders in their site. Most interviewees regarded the CCC very positively. They reported that the FPs had made a genuine effort at being open and inclusive by inviting all relevant stakeholder organisations as well as community members into the CCC. Many CCC members said how useful and rewarding their involvement was, especially in sites where no other early years network existed. Service providers could interact with others in the field and share knowledge. Most interviewees felt that the CCC had reduced segregation and competition among services and created mutual respect.
However, most sites had difficulties in recruiting all relevant stakeholders to the CCC especially parents of young children or other community members and representatives from some disadvantaged populations, such as Aboriginal people or people with a disability. Also many found it difficult to engage local businesses and most child care providers. Some FPs developed other avenues to engage these stakeholders.
Due to its community-based nature, CfC appears to have facilitated some improvements in service delivery and quality in the sites. Local plans were developed that gave stakeholders the opportunity to build on community strengths and address some service gaps and put early years strategies in place that they felt were most helpful for their site.
The selection of sites was a government decision based on a range of information. Some FPs believed the implementation of CfC was inhibited in some areas by the constructed boundaries of the CfC sites. Sites usually encompassed several suburbs or settlements, or even large rural or remote areas. These sites were sometimes contrary to locally defined geographic communities. In these areas this created significant obstacles to the FPs' ability to engage all relevant stakeholders, improve service coordination long-term and deliver services to young children and their families in all parts of the site.
At this stage it is not clear whether the implementation of CfC, using the FP model, has had a strategic impact in the sites; that is, whether it has been able to build sustainable service networks and improved services. It appears that continued financial engagement by state and federal governments remains essential.
1. Introduction
- 1.1 The Stronger Families and Communities Strategy: CfC
- 1.2 Description of the National Evaluation Framework
- 1.3 This report
A National Evaluation Consortium, comprising the Social Policy Research Centre (SPRC), UNSW, Australian Institute of Family Studies (AIFS) and research advisers, was contracted by the Australian Government Department of Families, Community Services and Indigenous Affairs (FaCSIA) to develop the evaluation framework for the Stronger Families and Communities Strategy (SFCS) 2004-2008.
The SFCS aims to: help families and communities build better futures for children; build family and community capacity; support relationships between families and the communities they live in; and improve communities' ability to help themselves. It contains four strands: Communities for Children (CfC), Invest to Grow (ItG), Local Answers (LA) and Choice and Flexibility in Child Care.
The national evaluation (NE) was designed to evaluate both the SFCS as a whole and each of three strands (CfC, ItG and LA) with the main focus on CfC. The NE is both formative - contributing to the development and refinement of policy and practice in relation to the Strategy - and summative - addressing the effectiveness of the Strategy and its implementation. This report contains a summary of the baseline data for the process evaluation for CfC. It provides an indication on the demographic and service delivery contexts in which CfC has been implemented in its 45 sites, and also reports on some of the issues relating to the early implementation of the CfC initiative. The various strands of data collection will be repeated in 2008, giving an indication of how these issues have changed as a result of the implementation of CfC.
1.1 The Stronger Families and Communities Strategy: CfC
Under the CfC initiative, non-government organisations are funded as 'Facilitating Partners' in 45 community sites around Australia to develop and implement a strategic and sustainable whole of community approach to early childhood development, in consultation with local stakeholders.
In implementing their local initiative, Facilitating Partners establish a CCC with broad representation from stakeholders in the community. The Facilitating Partner oversees the development of a four year Community Strategic Plan and annual Service Delivery Plans with the Committee and manages the overall funding allocation for the community. Most of the funding has been allocated to other local service providers to deliver the activities identified in the Community Strategic and Service Delivery Plans.
Examples of activities that have been implemented in the sites are:
- home visiting programs
- early learning and literacy programs
- early development of social and communication skills
- parenting and family support programs
- child nutrition programs
- community events to celebrate the importance of children, families and the early years. 1
According to the logic model of the Initiative, service effectiveness is dependent not only on the nature and number of services, but also on how seamless the service delivery is. Thus much of the CfC effort has been devoted not only to providing new services, but to 'joining up' existing services by increasing service coordination and cooperation.
1.2 Description of the National Evaluation Framework
The national evaluation framework is designed to evaluate the SFCS in relation to the Outcomes Framework developed by FaCSIA2. The Outcomes Framework aligns with the four priority areas of the National Agenda for Early Childhood: healthy young families; supporting families and parents; early learning and care; and child-friendly communities. A fifth priority area specifically relates to the CfC initiative; family and children's services work effectively as a system.
The key questions for the NE are:
- Have outcomes for children and families in relation to the four key action areas improved as a result of the Strategy?
- Which lessons have been learnt on how to achieve and sustain better outcomes for children 0-5 and their families /communities?
- Is early investment effective in terms of cost and outcomes for children?
- For which children, families or communities is it effective?
- What aspects of the model are effective?
- How effectively have resources been used?
- Has the SFCS achieved its objectives?
To answer these questions, the national evaluation framework consists of the interlocking components presented in Table 13.
| Process evaluation | Outcome evaluation | Process & outcome | |
|---|---|---|---|
| Communities for Children | Comprehensive Community Profile: - demographic profile - service mapping Service coordination study Partnership model study |
Longitudinal survey of families in 10 CFC sites (3 waves) Monitoring of secondary data |
Cost effectiveness study |
| Invest to Grow | Analysis of local evaluation reports | ||
| Cross-strategy | Themed studies Promising practice profiles Progress reports analysis |
The bulk of the National Evaluation is focused on evaluating CfC. The overall evaluation questions for CfC are:
- Have outcomes for children and families in CfC sites improved as a result of the Initiative?
- Do services in CfC sites work more effectively as a system?
- Are CfC communities more child-friendly?
- How successful has the Facilitating Partner model been in bringing about these changes?
The evaluation of CfC comprises an outcomes, process and a cost effectiveness evaluation. This report is concerned with the process evaluation. The logic model of CfC asserts that the Facilitating Partner model will improve services in CfC communities and strengthen communities, ultimately improving outcomes for children and families. The aim of the CfC process evaluation is to determine whether and how services in the communities have improved. The process evaluation includes a comprehensive community profile of each of the CfC communities, an assessment of how well services for young children in the community work together, and a study of the effectiveness of the SFCS partnership model.
1.3 This report
This report contains information on baseline data for the process evaluation in CFC sites (the shaded cell in Table 1). That is:
- Demographic profiles
- Service mapping
- Service coordination survey
- Field work relating to partnership model and service coordination.
1. Further details of the SFCS and CfC are available from www.facs.gov.au/internet/facsinternet.nsf/aboutfacs/programs/sfsc-sfcs.htm
2. The SFCS national evaluation outcomes framework is available from www.facs.gov.au/internet/facsinternet.nsf/vIA/sfcs_evaluation/$File/sfcs_%20evaluation_program.pdf
3. The national evaluation framework is available from www.facs.gov.au/internet/facsinternet.nsf/vIA/sfcs_evaluation/$File/sfcs_evaluation.pdf
2. Demographic profiles
A demographic profile of each community was compiled using data from the Census of Population and Housing, 2001. The key purpose was to provide contextual information about the social and economic characteristics of CfC sites, and the demographic characteristics of children aged under five and their families. This provides a backdrop that helps to understand the different contexts in which CfC have been implemented. The National Evaluation will use this data for understanding the implementation and impact of CfC in each area.
2.1 Method
The profiles draw on customised and publicly available data from the Census of Population and Housing, other Australian Bureau of Statistics (ABS) data and other relevant data. Data was obtained for populations living within the CfC boundaries, as negotiated between the individual CfC sites and FaCSIA. As a result, each CfC site has been defined differently, and site boundaries do not necessarily share the geographic boundaries used in statistical data collections. For example, some sites were defined as one or more suburbs or postcodes and others were defined as one or more Statistical Local Areas or Collection Districts (as defined by the ABS). While data has been tailored for the precise area as far as possible, it should be recognised that statistical areas do not perfectly match service delivery areas. Further, the areas may not perfectly capture children and families who are potential service users. Living within the defined boundaries is not an explicit requirement for service use, so CfC programs can serve some children and families who live outside their boundaries.
The data in the demographic profiles includes information about 0-5 year olds in the CfC site before the CfC initiative began (primarily using 2001 Census data). The data includes information about the families of 0-5 year olds in each site, including family structure, parental unemployment, and mothers' language and English proficiency. Some socio-economic data in the profiles relates to the broader population (not just children 0-5 and their families) including participation in education, educational attainment, birthplace, unemployment rates, motor vehicle ownership, and the SEIFA Index for disadvantage.
The demographic profiles include information about the:
- number 0-5 year olds as a percent of the total population (excluding overseas visitors)
- proportion of children 0-5 who are ATSI
- proportion of children 0-5 attending preschool
- proportion of children 0-5 living in lone parent households
- proportion of children 0-5 living in families with gross incomes of less than $500 per week
- proportion of children 0-5 with mothers who speak English 'not well' or 'not at all'
- proportion of children with one or two parents unemployed
- proportion of households with no motor vehicle
- proportion of persons aged 15 years and over who attained Year 12 or equivalent as highest level of schooling
- proportion of the population born outside main English speaking countries
- proportion of children living in relatively disadvantaged areas (according to SEIFA)
- Rise/decline in proportion of the population who are 0-5 1991-2001
To help Facilitating Partners and Local Evaluators to understand population trends in their community and to plan and target early intervention and prevention initiatives within their communities, reports on each site were distributed to Facilitating Partners. A report for Australia, which provides comparative information, was posted on the Communities and Families Clearinghouse Australia (CAFCA) website (http://www.aifs.gov.au).
2.2 Results
Demographic data in CfC sites and Australia are summarised in Table 2 and discussed below.
| CfC sites (%) | Australia (%) | |
|---|---|---|
| Proportion of population aged 0-5 | 9 | 8 |
| 0-5 year olds who are ATSI | 9 | 4 |
| 0-5 year olds in lone parent households | 21 | 15 |
| 0-5 year olds in families with weekly incomes <$500 | 26 | 18 |
| 0-5 year olds with mothers who speak English 'not well' or 'not at all' | 5 | 3 |
| 0-5 year olds with one or two parents unemployed | 10 | 7 |
| Households with no motor vehicle | 11 | 10 |
| Persons aged 15 years and over who attained Year 12 or equivalent as highest level of schooling | 28 | 38 |
| Persons born outside main English speaking countries | 20 | 20 |
Children in CfC sites
In August 2001, there were 113 695 children aged 0-5 years living in 81 071 families in the areas now covered by CfC.
In the CfC areas, children comprised on average 9% of the population, compared with 8.0% of the population throughout Australia. The sites with the highest proportions of children aged 0-5 were those with large Indigenous populations. In Katherine, 19.9% of the population were aged 0-5, as were 13.6% of the population in East Arnhem and 12.9% of the population in the Palmerston/Tiwi site.
Indigenous children
There were 9780 Indigenous children aged 0 to 5 years in the CfC sites. Indigenous children represented 9% of children aged 0-5 in the sites, compared with 4.0% across Australia. East Arnhem had the highest proportion of children who were Indigenous (73%), followed by Katherine (58%) and East Kimberley (48%). Less than 1% of the 0-5 year old population was Indigenous in Fairfield, Hume/Broadmeadows, Brimbank and Greater Dandenong.
Family type
Three quarters (75%) of children aged 0 to 5 years (84 976 children) counted at home in CfC sites (not visitors) were living in couple families, compared with 82% in Australia as a whole. 23403 children aged 0 to 5 (21%) counted at home in CfC sites were living in sole parent families, compared with 15% across Australia. 5316 children aged 0-5 (or 5%) were living in multifamily arrangements, compared with 3% of children in this age group across Australia.
However, the pattern was different for Indigenous children. A smaller proportion of Indigenous children aged 0-5 were living in sole parent families in CfC sites compared with Australia (27% compared with 29% across Australia) and a larger proportion were living in multi-family households (19% compared to 13%).
The sites with the highest proportions of children 0-5 living in sole parent families included Launceston (35% of children); Kingston-Loganlea (34% of children), and Inala-Ipswich (30% of children). The sites with the lowest proportion of children living in sole parent families were in sites with high proportions of Indigenous children- East Arnhem (3%), West Pilbara (8%) and Katherine (10 %).
Parental unemployment
In 2001, there were 11,470 children aged 0-5 years counted at home in the CfC areas living in families with at least one parent who was unemployed (10%). In contrast, 7% of children aged 0-5 across Australia lived in families with at least one parent unemployed. The sites with the highest proportions of children aged 0-5 years living in families with an unemployed parent (between 14 and 15%) were Kingston/Loganlea, Fairfield, Hume/Broadmeadows, Inala-Ipswich and Mirrabooka. Sites with the lowest proportions of children living in families with an unemployed parent were East Arnhem, West Pilbara and East Kimberley (less than 4% of children 0-5)4.
Family income
In 2001, over a quarter of children aged 0 to 5 years (26%) in CfC sites lived in families with incomes under $500. CfC sites had higher proportions of children in low income families than across Australia, where 18% lived in families with incomes under $500. The sites with the highest proportion of children 0-5 living in families with weekly incomes under $500 were in Hume/Broadmeadows, Inala-Ipswich, Mirrabooka, Launceston, and East Arnhem. The lowest were in West Pilbara (8% of children 0-5 in families earning less than $500 per week) and Mount Isa (13%).
Parental language and English proficiency
In CfC sites, there were 88188 (78%) children 0-5 who had mothers who spoke English only. Only 4540 children (4%) had mothers who spoke other languages and spoke English 'not well' or 'not at all'. The proportion of children aged 0 to 5 years with mothers who spoke English 'not well' or 'not at all' was slightly higher in CfC sites (5%) than across Australia (3%).
Compared with the national average (78%), a higher proportion of children aged 0-5 years in CfC sites had mothers who spoke languages other than English (78% compared to 74%). The largest group of children in CfC sites with mothers who spoke languages other than English were those who spoke Vietnamese (3%); Arabic (2%) and Turkish (1%).
The sites with the lowest proportions of children aged 0-5 with mothers who spoke only English were in Fairfield (21%), Hume/Broadmeadows (29%) and East Arnhem (33%). More than 95% of children in Gladstone, East Gippsland, Bendigo, South East Tasmania and Dubbo/Narromine had mothers who spoke English only.
Cultural diversity in CfC sites
In CfC sites, about the same proportion of the population were born in Australia as for the country as a whole (72% of the population in CfC sites were born in Australia compared with 72% nationally). In CfC sites and in Australia as a whole, the largest groups born outside Australia were born in the United Kingdom and New Zealand.
Twenty percent of people in CfC sites and in Australia as a whole were born outside the main English speaking countries (Australia, Canada, Ireland, New Zealand, South Africa the United Kingdom and United States). The largest group born outside the main English speaking countries were those born in Italy and Vietnam, in both CfC sites and the country as a whole.
The sites with the highest proportions of the population born outside the main English speaking countries were Fairfield (59%) and Brimbank (50%). Dubbo/Narromine, Bendigo and South East Tasmania each had less than 8% of the population born outside the main English speaking countries.
Educational attainment, persons aged 15 and over
A lower proportion of persons aged 15 and over in CfC sites had completed Year 12 or an equivalent level of schooling than across Australia (28% compared with 38%). The sites with the lowest proportions of the population aged 15 and over who had completed Year 12 or equivalent were South East Tasmania (17%), Burnie (18%), Launceston (20%), Port Augusta (20%) and East Arnhem (21%). The sites with the highest proportion of the population who had completed Year 12 were Inner North Canberra (62%) and Fairfield (35%).
Motor vehicle ownership
A similar proportion of households in CfC sites (11%) had no motor vehicle, compared with the national figure (10%). High proportions of households had no vehicle in East Arnhem (28%) and Katherine (19%). Less than 6% of households had no motor vehicle in Cranbourne, Coomera- Northern Gold Coast and West Pilbara.
Socio-Economic Indices for Areas (SEIFA) Index of Disadvantage
Based on 2001 Census data, the SEIFA Index of Disadvantage includes variables that either reflect or measure disadvantage, such as education, income and occupation, housing, access to the Internet, and Indigeneity. The Indices show relative disadvantage (but do not quantify it).
Indices of Disadvantage were ranked for the Statistical Local Areas that cover the Communities for Children site. Sites could be covered by more than one SLA, or by part (or parts) of an SLA. As shown in Table 3, 23 of the 45 sites are covered by an SLA with a score that placed them in the most disadvantaged 10% of areas in Australia. The sites that contained the lowest ranked SLAs were East Arnhem, East Kimberley, Palmerston / Tiwi, Katherine, Inala-Ipswich and North-West Adelaide (scores all under 800). Fourteen sites had SEIFA scores in the highest 50% of areas in Australia. The sites with SLAs with the highest scores (lowest relative disadvantage) were Inner North Canberra, East Arnhem, North-West Adelaide, Salisbury, Palmerston / Tiwi, East Gippsland, Dubbo / Narromine and Lower Great Southern.
| Had one or more SLA in the lowest 10 percent in Australia | SLA in lowest 10 to 25 percent of areas | SLA in lowest 25 to 50 percent of areas | SLAs in lowest 50 to 75 percent of areas | SLAs in lowest 75 to 90 percent of areas | SLAs in highest 10 of areas in Aust |
|---|---|---|---|---|---|
| Bendigo | Bendigo | Armadale | Bendigo | Inner North Canberra | Inner North Canberra |
| Blacktown | Blacktown | Bendigo | Dubbo / Narromine | ||
| Brimbank | Campbelltown | Burnie | East Arnhem | ||
| Burnie | Cranbourne | Cairns | East Gippsland | ||
| Cairns | Dubbo / Narromine | Dubbo / Narromine | Frankston | ||
| Deception Bay | Gladstone | East Gippsland | Inner North Canberra | ||
| East Arnhem | Inala-Ipswich | Frankston | Lower Great Southern | ||
| East Kimberley | Launceston | Gladstone | Nthn Gold Coast (Coomera) | ||
| Fairfield | Lismore | Inner North Canberra | NW Adelaide | ||
| Greater Dandenong | Lower Great Southern | Katherine | Palmerston / Tiwi | ||
| Hume/Broadmeadows | Miller | Launceston | Salisbury | ||
| Inala-Ipswich | Mirrabooka | Lower Great Southern | Swan Hill | ||
| Katherine | Murray Bridge (RC) | Mirrabooka | West Pilbara | ||
| Kingston Loganlea | Murwillumbah | Mt Isa | Wyong | ||
| Kwinana | NW Adelaide | Murray Bridge | |||
| Launceston | Onkaparinga | Murwillumbah | |||
| Murray Bridge | Port Augusta | Nthn Gold Coast (Coomera) |
|||
| NW Adelaide | Raymond Terrace | NW Adelaide | |||
| Onkaparinga | SE Tas | Raymond Terrace | |||
| Palmerston / Tiwi | Shellharbour | Salisbury | |||
| Salisbury | Taree | West Pilbara | |||
| SE Tas | West Townsville | ||||
| West Townsville | Wyong | ||||
| 23 sites | 23 sites | 21 sites | 14 sites | 1 site | 1 site |
Summary
In summary, populations in CfC sites appear more disadvantaged on most of the relevant indicators. More than half of the sites (23) were covered by an SLA (or part thereof) which had a SEIFA score that placed it amongst the most disadvantaged 10 percent of areas in Australia. CfC sites had higher proportions of children aged 0-5 who live in lone parent households than the national average, higher proportions with a parent unemployed, and higher proportions who live in low-income families. Families with children aged 0-5 years in CfC areas were also more culturally diverse. Although the same proportion of the overall population was born outside the main English speaking countries in Australia and in CfC sites, there were higher proportions of children in CfC sites with mothers who don't speak English very well. CfC sites also had higher proportions of children who were Indigenous, compared with Australia as a whole. Populations in CfC areas were also less likely to have attained Year 12 or equivalent levels of qualifications.
4. That there are lower proportions of children living in families with unemployed parents in sites with high Indigenous populations may be because there are high rates of participation in CDEP in Indigenous areas.
3. Service mapping
This section of the report provides an overview of the baseline service mapping component of the process evaluation. The aim was to establish a baseline measure of the range of services and initiatives in place prior to, or early in the implementation of the local community strategic plan in each CfC site. The analysis was based on data collected from a variety of sources including service directories, planning documents, previous mapping exercises and a short questionnaire sent to organisations in the local area. The service mapping will be repeated towards the end of 2007 to build a picture of types of interventions provided by CfC and determine changes in the range and type of services available in the site.
3.1 Method
In December 2005, the baseline service mapping questionnaire was distributed via email to the 45 Project Managers in each Facilitating Partner organisation. The questionnaire asked for baseline data concerning services specifically for children 0-5 years and their families operating within the CfC site. Project managers were also asked to identify any service gaps as a result of their service mapping and to list any Local, State or Commonwealth Government initiatives currently operating in the area.
Analysis of the data supplied by the 45 sites revealed significant inconsistencies in the manner in which the questionnaires had been completed. For example, some respondents included venues that did not deliver specific services to young children and their families, such as retail outlets, RSL clubs and swimming pools. In other cases whole sections of the service network appeared to be missing. Some sites, for example, listed no general practitioners (GPs) and others no education services.
To get a more accurate reflection of the service network, a second round of data collection was conducted. The services listed for each site were sorted and coded into new categories. All data were categorised in the same way to ensure comparability across the 45 sites. Inappropriate services were removed and the gaps in the data provided were highlighted. From this re-categorisation process, a very specific service typology was developed. This typology took into account the kinds of services being reported in the sites and accommodated the different nature of services and the different roles of organisations in each area. For example, many of the service maps included organised networks that did not deliver services on the ground but played a crucial role in the sector and thus needed to be reflected in the mapping.
The new typology (see Table 4) allowed for meaningful comparison between the sites and identification of any gaps in the data that could be checked with Project Managers. Service maps were re-sent with the new typology for Project Managers to check how accurately the initial data reflected the service network in their site. Project Managers were asked to add any services that had been omitted from the original mapping exercise.
The returned data varied considerably between sites. It is not known how much of the variation is a result of differences in the nature and number of services in each site and how much was due to reporting bias or error.
Although the number of services varied between sites, the number of services was more consistent in the revised service mapping than in the original service maps. When FPs supplied the original Baseline Service Mapping data, the mean number of reported services in each site was 80. After this data was categorised and FPs revised their original spreadsheets, the average reported number of services in each site rose to 97 (a 10% increase). There was a dramatic increase in the number of services reported by some sites. In one site, for example, the number of reported services rose from 38 to 227 when they revised their data (a 493% increase). The increase was less marked in many other sites, but almost all reported a larger number of services in the revised service mapping. Some reported fewer services as initial data had included venues or services not specific to young children and their families.
| Service Category | Service type |
|---|---|
| 1. Education | 1.1 Early education services e.g. -
1.2 Primary schools 1.3 Other e.g. -
|
| 2. Population groups with higher risk of disadvantage |
2.1 Culturally and Linguistically Diverse (CALD)
|
| 3. General child & family | 3.1 Community hubs e.g.
3.6 Early intervention 3.7 Family support e.g. -
3.9 Other e.g. -
|
| 4. Health | 4.1 Allied Health e.g. -
4.4 GPs and medical centres 4.5 Hospital 4.6 Maternal health e.g. -
4.8 Specialist services e.g. -
|
| 5. Supportive networks, e.g. organisations involved with the planning and development of services |
5.1 State Government Departments
5.2 Interagency chairs 5.3 GP Peak bodies 5.4 Childcare peak bodies 5.5 Early years partnerships e.g.
|
Venues where no specific service can be listed should be omitted e.g.
|
|
| Site | 1. Education | % | 2. Population groups with a higher risk of disadvantage |
% | 3. General child & family |
% | 4. Health | % | 5. Supportive networks |
% | Total |
|---|---|---|---|---|---|---|---|---|---|---|---|
| Armadale | 66 | 29 | 29 | 13 | 56 | 25 | 54 | 24 | 22 | 10 | 227 |
| Blacktown | 47 | 30 | 13 | 8 | 25 | 16 | 59 | 38 | 12 | 8 | 156 |
| Brimbank | 42 | 44 | 25 | 26 | 27 | 28 | 2 | 2 | 0 | 0 | 96 |
| Cairns | 51 | 48 | 16 | 15 | 28 | 26 | 7 | 7 | 5 | 5 | 107 |
| Campbelltown | 19 | 28 | 5 | 7 | 22 | 32 | 15 | 22 | 7 | 10 | 68 |
| Dubbo | 67 | 37 | 28 | 16 | 42 | 23 | 37 | 21 | 6 | 3 | 180 |
| East Arnhem | 21 | 37 | 4 | 7 | 10 | 18 | 12 | 21 | 10 | 18 | 57 |
| East Gippsland | 87 | 55 | 11 | 7 | 13 | 8 | 39 | 25 | 7 | 5 | 157 |
| East Kimberley | 11 | 26 | 8 | 19 | 9 | 21 | 13 | 31 | 1 | 2 | 42 |
| Frankston North | 33 | 47 | 3 | 4 | 17 | 24 | 15 | 21 | 2 | 3 | 70 |
| Gladstone | 68 | 34 | 14 | 7 | 38 | 19 | 61 | 31 | 17 | 9 | 198 |
| Greater Dandenong | 34 | 40 | 13 | 15 | 22 | 26 | 14 | 16 | 3 | 4 | 86 |
| Hume/ Broadmeadows | 46 | 41 | 36 | 32 | 16 | 14 | 2 | 2 | 11 | 10 | 111 |
| Inala | 32 | 33 | 9 | 9 | 29 | 30 | 18 | 19 | 9 | 9 | 97 |
| Inner North ACT | 41 | 42 | 3 | 3 | 32 | 33 | 17 | 18 | 4 | 4 | 97 |
| Katherine | 47 | 52 | 15 | 17 | 13 | 14 | 9 | 10 | 7 | 8 | 91 |
| Kingston Loganlea | 28 | 39 | 9 | 13 | 25 | 35 | 6 | 9 | 3 | 4 | 71 |
| Kwinana | 28 | 41 | 3 | 4 | 29 | 42 | 6 | 9 | 3 | 4 | 69 |
| Launceston | 22 | 42 | 6 | 11 | 11 | 21 | 9 | 17 | 5 | 9 | 53 |
| Lismore | 41 | 39 | 20 | 19 | 25 | 24 | 14 | 13 | 6 | 6 | 106 |
| Mirrabooka | 35 | 48 | 10 | 14 | 15 | 21 | 8 | 11 | 5 | 7 | 73 |
| Mt Isa | 25 | 40 | 11 | 18 | 12 | 19 | 8 | 13 | 6 | 10 | 62 |
| Murwillumbah | 18 | 46 | 5 | 13 | 7 | 18 | 8 | 21 | 1 | 3 | 39 |
| North Gold Coast | 32 | 60 | 0 | 0 | 6 | 11 | 12 | 23 | 3 | 6 | 53 |
| Onkaparinga | 49 | 36 | 7 | 5 | 37 | 27 | 33 | 24 | 9 | 7 | 135 |
| Palmerston | 26 | 41 | 5 | 8 | 15 | 24 | 16 | 25 | 1 | 2 | 63 |
| Port Adelaide | 46 | 47 | 9 | 9 | 18 | 18 | 16 | 16 | 9 | 9 | 98 |
| Port Augusta | 21 | 26 | 24 | 29 | 23 | 28 | 12 | 15 | 2 | 2 | 82 |
| Raymond Terrace | 15 | 22 | 7 | 10 | 13 | 19 | 21 | 31 | 12 | 18 | 68 |
| Salisbury | 25 | 46 | 3 | 6 | 13 | 24 | 11 | 20 | 3 | 6 | 55 |
| SE Tasmania | 35 | 38 | 2 | 2 | 23 | 25 | 23 | 25 | 10 | 11 | 93 |
| Shellharbour | 53 | 38 | 6 | 4 | 31 | 23 | 40 | 29 | 8 | 6 | 138 |
| Southern Lakes | 41 | 38 | 10 | 9 | 17 | 16 | 35 | 32 | 5 | 5 | 108 |
| Swan Hill Robinvale | 49 | 38 | 25 | 19 | 25 | 19 | 29 | 23 | 1 | 1 | 129 |
| Townsville | 15 | 22 | 14 | 21 | 25 | 37 | 12 | 18 | 2 | 3 | 68 |
| Total | 1316 | 39 | 408 | 12 | 769 | 23 | 693 | 20 | 217 | 6 | 3403 |
Data from other sites will be added to subsequent reports.
Note: May not add up to 100% due to rounding.
3.2 Results
FPs were asked to return their revised baseline service mapping data by the end of March 2007. At 1 May 2007, 35 of the 45 sites had returned their data and so this preliminary presentation of baseline service mapping data does not take into account services that were available in the remaining 10 sites.
The total number of reported services varied from 53 in Launceston to 227 in Armadale. Most sites reported that the highest proportion of services fell into the broad categories of 'Education' or 'General Child and Family', which included community hubs, information services, counselling and family support services (Table 5). Overall, 39% of services in each site fell within the category of 'Education' and 23% were classified as 'General Child and Family'.
The rates varied between sites. More than 55% of services for young children and their families in East Gippsland and just under half of these services in the Cairns, Frankston North and Murwillumbah sites were reported to be educational (48%, 47% and 46% respectively). In contrast, only 22% of services in Townsville and 29% of those in Armadale were reported to be educational.
The number of 'Health' services reported in each site varied markedly. The Brimbank and Hume/ Broadmeadows sites listed only two 'Health' services each, and Kingston Loganlea and Kwinana only six, compared to Blacktown and Armadale, which listed 59 and 54 services respectively.
FPs were asked to assign services to more detailed categories. A comprehensive list of these categories can be found in the Service Mapping Typology (Table 4).
No GPs, dentists or applied health practitioners were reported in Brimbank and Hume/ Broadmeadows, and neither FP reported any hospitals serving their site. Conversely, several other sites provided extensive listings of medical services in their areas. The wide range of responses could be a result of respondent error or could reflect the actual range of medical services available in each site.
As with the 'Health' category, the Armadale site reported one of the largest numbers of services in the 'Supportive Services' category, which incorporates organisations involved with the planning and development of services. There were 22 'Supportive Services' reported in Armadale and 17 reported in Gladstone, compared to 1 or 2 in several sites including Swan Hill/Robinvale and Palmerston and none in Brimbank.
Neither Swan Hill/Robinvale nor Palmerston reported any services for several sub-categories beneath 'Supportive Services' including 'State Government departments', 'Local Councils' and 'Associations and Committees'. Again, it is likely that some of these services were available in these areas.
3.3 Summary and discussion
In summary, the data provided as at 1 May 2007 suggest that education services are the most prevalent services for children aged 0-5 years and their families in the CFC sites (39%), followed by general child and family services (23%) and health services (20%). An additional 12% of services targeted population groups with a higher risk of disadvantage. Nearly all FPs reported the existence of supportive networks in their site.
There was substantial variety in the number and type of services and networks available in each site. Overall, the number of services in the sites ranged from 39 to 227. Looking at the range in numbers of specific service categories, the number of educational services ranged from 11 to 87, the number of general child and family services ranged from 6 to 56 services, the number of general health services ranged from 2 to 61, and the number of services for population groups with a higher risk of disadvantage ranged from 0 to 36. The number of supportive networks in each site ranged from 0 to 22.
Despite substantial effort to ensure the service mapping data was accurate, comprehensive and consistent between the sites, it is likely that some errors and inconsistencies remain. Despite the problems in data accuracy, the results are likely to represent a reasonable picture of the number and variety of services for children aged 0-5 years and their families in the CFC sites at the commencement of the initiative.
The service mapping exercise highlighted the considerable difficulties inherent in an exercise such as this. Definitional issues are very problematic as there are no clear and universally accepted definitions of a 'service'. More importantly, it is very difficult for FPs to know the sum total of services in their area. In order to do so they need to rely on a variety of sources, as there is no central database or register of services. In addition services are in a continuous state of change. New services emerge, services change their remit, move premises or cease to operate. So even though FPs were required to undertake a service mapping exercise as part of the development of their strategic plans, they found this mapping exercise - which was considerably more rigorous than that required for their plans - enormously challenging.
4. Service coordination study
The Service Coordination Study was built on the data collected in the baseline service mapping. It provides information about how services in CfC sites work together. The logic model of the SFCS indicates that outcomes for children and families depend not just on service output, but also on how services and other initiatives are coordinated and work together at a strategic and operational level.
4.1 Method
The service coordination study involved:
- A postal and email survey of contacts in relevant agencies in each CfC community, administered by the SPRC ('the snapshot questionnaire').
- Additional semi-structured interviews with approximately ten key personnel from those CfC communities in which the Stronger Families in Australia study was conducted. Most of these interviews were held face-to-face by the SPRC. Key personnel who were unavailable during the fieldwork period participated in a telephone interview. The findings from this intensive fieldwork stage of the service coordination study are reported below (see Section 5).
The lists of services collected in the baseline service mapping formed the sample for the survey.
4.2 The Snapshot survey
The snapshot survey was designed to assess how services in CfC areas are working together to achieve outcomes for children aged 0-5 and their families. The term 'snapshot' was used to denote that the survey was taking a picture of the extent of coordination at a particular time, with the intent of taking another picture after CfC had been in operation for some time. The survey was conducted in 2006.
Instruments
Initially two questionnaires were developed, one for assessing service coordination at the strategic level and one, at the operational level. The strategic level questionnaire was developed to establish the level of interagency working and cooperation in relation to planning, coordinating and commissioning services. The operational level questionnaire addressed how well services work together on the ground - do they know about each other? Do they find it easy to refer to each other? Are there information-sharing protocols, which allow services to know who else is involved with families? Are there ways of coming together to discuss cases that cause concern?
Questions were developed following a literature search of indicators for collaboration among agencies, and of questions and questionnaires used in similar studies, both in Australia and overseas. Several authors discussed indicators of successful collaboration and different types of collaboration among agencies. For example, Sullivan, Gilmore and Foley (2002) distinguished between three basic methods of collaboration: activity (e.g. multi-agency working groups); structural (e.g. co-location of offices); and financial (e.g. cost-sharing for services). Walker (2000) suggested that different forms of collaboration can be placed along a continuum from less to more collaboration, with a referral network as the least complex form and a collaborative alliance the most complex. Similarly, Himmelman (2001) grouped collaboration activities into four basic categories along a developmental continuum: networking, coordinating, cooperating and collaborating. A selection of indicators covering all methods and categories of collaboration were included in the questionnaires.
Questions relating to the current level, barriers and facilitators to collaboration were based on questions from the National Center for Family Support (2000) and the VicHealth Partnerships Analysis Tool (The Victorian Health Promotion Foundation, hereafter VicHealth 2003). Other questions were based on those used by the SPRC in the evaluation of the Demonstration Projects in Integrated Community Care for the NSW Ageing and Disability Department.
Both questionnaires were piloted with strategic and operational level personnel in three CfC sites: Miller, East Gippsland and Mirrabooka. The Strategic level questionnaire was piloted with a total of nine people, and the Operational level one, with eight. Both questionnaires were then refined according to the interviewees' feedback. In addition, feedback from other researchers, including evaluators employed by CfC at a local level (Local Evaluators (LE)), was incorporated.
After the initial distribution of the questionnaires, it became clear that many services found it confusing to deal with two separate questionnaires (see below). Therefore the Strategic and Operational level snapshot questionnaires were condensed into a single 'Snapshot questionnaire' (Appendix A). This questionnaire explored different aspects of service coordination as outlined in Table 6 below.
| Domain | Indicators |
|---|---|
| Better service coordination | Involvement in joint activities (Q.10) Ratings of joint activities (Q.10) Level of staff involved in coordination (Q.11) History, extent and ratings of service coordination (Q.15-21) |
| Facilitators of coordination | Facilitating factors (Q.13) |
| Barriers to coordination | Hindrances (Q.12) |
| Use of key principles of SFCS | Use of information to guide planning (Q.9) Incorporation of key principles (Q.14) |
Sample
The sample for this study was based on the service networks in the sites, as defined in the service mapping exercise described above. The entire network of agencies providing services to children aged 0-5 and their families in CfC sites was included, not only those funded under CfC or involved in some other way so that changes in how services work together throughout the service network could be examined.
Initially, both questionnaires were sent to a single contact in each agency listed in the baseline service maps completed by FPs. That single contact was then requested to forward each questionnaire to two relevant staff members in their agency (an operational level manager and a strategic level manager). Follow up with FPs and LEs indicated that this step in the process was confusing for some services, especially for small services, which may have only one relevant staff member performing both ‘strategic’ and ‘operational’ roles. In response, the strategic and operational snapshot questionnaires were condensed into a single ‘Snapshot Questionnaire’. The refined distribution process and format of the questionnaire made it easier to understand and quicker to complete, reducing the burden on respondents. Note, however, that the completed strategic and operational versions were still used in the analysis.
To further improve the survey response rates, FPs and LEs were actively involved in the distribution process. Distribution of the survey was tailored according to the advice and preferences of the FPs and LEs in each site. The questionnaires were administered either by post or email (in some sites, both), and in some cases accompanied by an introductory letter from FPs and LEs. Many FPs and LEs also played a role by distributing the questionnaires in person throughout their communities and at interagency or other meetings.
The snapshot questionnaires were distributed to services in 41 of the 45 CfC sites. Consultations with the FPs and LEs of four sites containing remote Indigenous communities (Palmerston & Tiwi Islands, Katherine, East Kimberley and East Arnhem) indicated that the survey instrument was not culturally appropriate for the service providers of those areas. Consequently, the surveys were not distributed in Katherine, East Kimberley, East Arnhem and the Tiwi Islands. They were, however, distributed to services in Palmerston, an urban area with a mainly non-Indigenous population.
4.3 Results
Data was collected from staff of agencies that were identified through the CfC Baseline Service Mapping. The sample included staff from agencies that were not in any way involved with CfC, as well as staff from agencies involved with the initiative.
More than one-third of respondents (36%) did not record their position within their agency in any of the categories prescribed by the questionnaire (Table 7). Instead, some respondents wrote down their profession, for example teacher, GP, social worker or librarian. Of those respondents who did tick one of the prescribed positions, the highest proportion worked as Service Coordinators or Service Managers (32%) within their agencies, followed by Frontline Workers (15%), Senior or Area Managers (11%) and CEOs (5%).
| Per cent | |
|---|---|
| CEO | 5 |
| Senior or Area Manager | 11 |
| Service Coordinator or Service Manager | 32 |
| Frontline Worker | 15 |
| Other | 36 |
| Missing | 2 |
| Total | 100 |
(N = 482)
Note: May not add up to 100% due to rounding
Most agencies with which respondents were affiliated employed at least some full-time equivalent staff (Table 8), but they tended to be small enterprises. Only 12 per cent of respondents’ agencies had no full-time equivalent staff employed in the Local Government Area (LGA)/CfC site. Most agencies had a small number of full-time equivalent staff: 42% had less than five, and more than 55% had less than ten full-time staff.
| Per cent | |
|---|---|
| 0 | 12 |
| 0.1-0.5 | 3 |
| 0.6-0.9 | 2 |
| 1-1.9 | 8 |
| 2-2.9 | 7 |
| 3-3.9 | 5 |
| 4-4.9 | 5 |
| 5-5.9 | 3 |
| 6-9.9 | 11 |
| 10-49.9 | 13 |
| 50-400 | 6 |
| Missing | 25 |
| Total | 100 |
(N = 482)
Table 9 shows that only 27% of all agencies provided services solely to 0-5 year old children and their families. Just under half of all agencies devoted at least half of their activities to services for 0-5 year olds and their families.
(N = 482)
Note: May not add up to 100% due to rounding
Overall, survey respondents had a high level of recognition of CfC. The results in Table 10 show that 70 per cent of all respondents had heard of the initiative.
| Per cent | |
|---|---|
| Yes | 70 |
| No | 8 |
| Missing | 22 |
| Total | 100 |
(N = 482)
Level of Agency Involvement in CfC
Although many agencies in CfC sites had some role in relation to CfC, Table 11 shows that two thirds of survey respondents were from agencies that were not involved with the project in any way. A sizeable minority (36 percent) of respondents came from an agency that was a member of the CfC committee and only 28 percent came from an agency that provided services funded under CfC. Since the defined criteria are not exclusive, the agency roles can overlap.
|
Per cent |
||||
|---|---|---|---|---|
| Yes | No | Missing | Total | |
| Member of Communities for Children Committee | 36 | 50 | 14 | 100 |
| Provides services funded under CfC | 28 | 58 | 14 | 100 |
| None | 19 | 67 | 14 | 100 |
(N = 482)
The proportion of activities devoted to services for 0-5 year old children and their families was similar for agencies with and without involvement in CfC. Table 12 shows that 62 percent of agencies with some involvement with CfC devoted 50 percent or more of their activities to services for 0-5 year olds and their families. In comparison, agencies with no involvement in CfC devoted 58 percent to such services.
|
Per cent |
||||||
|---|---|---|---|---|---|---|
| All of it | Most of it | About Half | Some | Very little | Total | |
| Member of CfC Committee | 24 | 17 | 18 | 34 | 7 | 100 |
| Provides services funded under CfC | 36 | 18 | 11 | 28 | 8 | 100 |
| None | 37 | 15 | 6 | 26 | 15 | 100 |
(N = 482)
Note: May not add up to 100% due to rounding
Table 13 shows the extent to which information sources such as the SFCS Outcomes Framework were used as a guide to plan services, allocate resources and identify service gaps in the community. Most services used a variety of information sources, with feedback from service users being the most popular method. More than three quarters of services (76 percent) used service user feedback, followed by client information from services (used by 68 percent), community-level information (62 percent), and population-level information (52 percent).
Relatively few services (28 percent) used SFCS Outcomes Framework data. A fairly high proportion of respondents (16 percent) stated that they did not know whether or not this data was used, perhaps reflecting many respondents' limited involvement with CfC and a lack of communication about the SFCS Outcomes Framework.
|
Per cent |
|||||
|---|---|---|---|---|---|
| Yes | No | Don't Know | Missing | Total | |
| Population-level information (e.g. census data) | 52 | 18 | 6 | 24 | 100 |
| Community-level information (e.g. from council or non-govt organisations, or from Australian Early Dev Index) | 62 | 11 | 5 | 22 | 100 |
| Client Information from services | 68 | 7 | 4 | 21 | 100 |
| Feedback from service users (parents of small children) | 76 | 3 | 3 | 18 | 100 |
| SFCS Outcomes Framework data | 28 | 28 | 16 | 29 | 100 |
(N = 482)
Note: May not add up to 100% due to rounding
Table 14 shows the use of SFCS Outcomes Framework data by agencies that have a role in CfC. The results show that 54 percent of agencies involved with CfC used the SFCS Outcomes Framework data, compared with 5 percent of those without any involvement in CfC.
|
Per cent |
||||
|---|---|---|---|---|
| Yes | No | Don't Know | Total | |
| Member of Communities for Children Committee | 47 | 31 | 22 | 100 |
| Provides services funded under CfC | 61 | 22 | 18 | 100 |
| None | 5 | 71 | 24 | 100 |
(N = 482)
Note: May not add up to 100% due to rounding
Strategic Level Coordination
The Strategic Level Coordination component of the study was intended to establish the level of interagency cooperation relating to planning, coordinating and commissioning services, and to measure changes during the funding period.
For the purposes of the Snapshot Survey, interagency working and cooperation in the planning, coordinating and commissioning of services was refined into the range of activities shown in Table 15. The activities were grouped into five categories: planning, service delivery, shared information, professional development and other.
Respondents were also asked which interagency activities they believed were most helpful. The helpfulness score was recorded on a scale from 1 (least helpful) to 5 (most helpful), with a midpoint of 3 (neither helpful nor unhelpful).
|
Agency involvement |
Average helpfulness score (from 1 [low] to 5 [high]) |
||||
|---|---|---|---|---|---|
| Yes | No | Missing | Total | ||
| Planning: | |||||
| Joint planning | 66 | 27 | 8 | 100 | 4.0 |
| Ensuring strategic plans reflect common goals | 55 | 27 | 19 | 100 | 3.9 |
| Coordinating planning cycles between agencies | 26 | 54 | 20 | 100 | 3.6 |
| Sharing membership of one another's organisational structures (e.g. boards of directors or management committees) |
27 | 54 | 19 | 100 | 3.7 |
| Service delivery: | |||||
| Referring clients between agencies | 82 | 13 | 5 | 100 | 4.1 |
| Joint monitoring or quality assurance of services | 28 | 53 | 19 | 100 | 3.7 |
| Joint service delivery | 60 | 33 | 0 | 100 | 4.0 |
| Joint case management | 44 | 48 | 8 | 100 | 3.9 |
| Sharing costs for services provided to shared clients | 25 | 55 | 19 | 100 | 4.0 |
| Shared information: | |||||
| Exchanging information (about projects, funding sources etc.) | 80 | 14 | 6 | 100 | 4.0 |
| Joint promotional campaigns | 52 | 41 | 8 | 100 | 4.0 |
| Sharing client information | 49 | 43 | 9 | 100 | 3.9 |
| Professional development: | |||||
| Interagency staff training | 53 | 40 | 7 | 100 | 4.1 |
| Joint recruitment of personnel | 16 | 70 | 14 | 100 | 3.9 |
| Other: | |||||
| Interagency meetings | 79 | 17 | 4 | 100 | 4.0 |
| Co-location (where services may share the same premises) | 41 | 51 | 8 | 100 | 4.0 |
Note: May not add up to 100% due to rounding
As Table 15 shows, each of the interagency activities listed was performed by at least some agencies. The interagency activities with which agencies were most commonly involved were:
- Referring clients between agencies (82per cent);
- Exchanging information (about projects, funding sources, etcetera) (80 per cent);
- Interagency meetings (79 per cent);
- Joint planning (66 per cent); and
- Joint service delivery (60 per cent).
Respondents believed that the following interagency activities were the most helpful:
- Referring clients between agencies (4.1);
- Interagency staff training (4.1);
- Joint service delivery (4.0);
- Exchanging information (about projects, funding sources etcetera.) (4.0); and
- Co-location (where services may share the same premises) (4.0).
Three interagency activities - referral of clients between agencies, the exchange of information, and joint service delivery - were among the most common interagency activities and were, at the same time, seen to be among the most helpful.
Table 16 shows the positions of staff involved in interagency arrangements. Most commonly, staff close to the ground level of service delivery - service coordinators/managers and frontline staff - were the ones carrying out interagency activities. For example, 33 per cent of frontline staff and 29 per cent of service coordinators/ managers collaborated with other agencies when delivering services. By contrast, senior staff - CEOs and senior or area managers - were significantly less involved in interagency arrangements.
|
Per cent |
|||||||
|---|---|---|---|---|---|---|---|
| CEO | Senior or Area Manager |
Service coordinator or service manager |
Frontline Staff |
Not Involved |
Missing | Total | |
| Planning (e.g. joint planning, coordination, membership of management committees etc.) | 11 | 20 | 28 | 21 | 9 | 11 | 100 |
| Service delivery (e.g. joint service delivery, joint quality assurance, joint case management, sharing of costs; referrals between agencies) | 5 | 12 | 29 | 33 | 10 | 12 | 100 |
| Shared information (e.g. exchange of information about projects and funding sources, sharing client information, joint promotional campaigns) | 9 | 17 | 31 | 28 | 6 | 10 | 100 |
| Professional development (e.g. interagency staff training, joint recruitment) | 7 | 15 | 27 | 26 | 14 | 12 | 100 |
| Interagency meetings | 9 | 17 | 31 | 27 | 7 | 10 | 100 |
| Co-location (where services may share the same premises) | 6 | 11 | 20 | 19 | 27 | 16 | 100 |
(N = 482)
Note: May not add up to 100% due to rounding
Factors that could hinder effective partnerships and barriers to service coordination are presented in Table 17. Respondents were asked to rank a number of statements relating to partnerships in their site on a scale from 1 (not all accurate) to 5 (highly accurate). In other words, the higher the score, the more a statement was seen to be a hindrance to cooperation.
| Scale: 1 to 5 |
Per cent |
|||
|---|---|---|---|---|
| Average Score | Don't know | Missing | Total | |
| 'Turfism' or territoriality among agency administrators | 2.8 | 17 | 17 | 100 |
| Competition for funding among agencies | 3.3 | 16 | 17 | 100 |
| Differences in funding sources across agencies | 3.5 | 18 | 17 | 100 |
| Historical differences between agencies (e.g. terminology, service mandates or practices) | 3.2 | 18 | 17 | 100 |
| Different levels of government - local, state, federal - working separately | 3.5 | 10 | 17 | 100 |
| Staff problems (e.g. shortages, high turnover) | 3.4 | 9 | 17 | 100 |
| Long distances between services | 2.7 | 10 | 18 | 100 |
| Absence of a common vision for how to meet the needs of young children and their families | 2.6 | 8 | 18 | 100 |
| Absence of effective leadership in promoting interagency working | 2.8 | 13 | 17 | 100 |
(N = 482)
Note: May not add up to 100% due to rounding
Respondents believed the following factors were most likely to hinder effective partnerships:
- Differences in funding sources across agencies (3.5);
- Different levels of government (local, state, federal) working separately (3.5);
- Staff problems (e.g. shortages, high turnover) (3.4); and
- Competition for funding among agencies (3.3).
The factors that are likely to promote effective partnerships and facilitate better coordination are presented in Table 18. In a similar manner to the previous question, respondents were asked to rank a number of statements relating to partnerships in their site on a scale from 1 (not at all accurate) to 5 (highly accurate). In other words, the higher the score, the more is a statement seen to be promoting cooperation.
| Scale: 1 to 5 |
Per cent |
|||
|---|---|---|---|---|
| Average Score | Don't know | Missing | Total | |
| Respect for and understanding of the needs of families | 4.3 | 2 | 16 | 100 |
| Common philosophy that includes the goal to cooperate | 4.0 | 4 | 17 | 100 |
| Leadership among agency administrators | 3.8 | 7 | 18 | 100 |
| Leadership from the Facilitating Partner | 3.9 | 13 | 18 | 100 |
| Willingness among stakeholders to work together | 4.1 | 4 | 17 | 100 |
| Government mandates for more efficient and effective service provision | 3.4 | 11 | 17 | 100 |
| Common goal among agencies to secure funding | 3.5 | 12 | 17 | 100 |
(N = 482)
Note: May not add up to 100% due to rounding
From the results in Table 18, respondents thought that the following factors were most likely to promote effective partnerships:
- Respect for and understanding of the needs of families (4.3);
- Willingness among stakeholders to work together (4.1);
- Common philosophy that includes the goal to cooperate (4.0)
- Leadership from the Facilitating Partner (3.9); and
- Leadership among agency administrators (3.8).
Respondents were asked to rate the accuracy of statements regarding the commitment of local agencies to work together for the benefit of young children in their communities on a scale form 1 (not at all accurate) to 5 (highly accurate). Results are presented in Table 19. The higher the score, the more a particular attitude or procedure was seen to be an accurate description of local agencies. Overall, respondents reported that there was a good understanding of the importance of the early years (4.2). Respondents moderately agreed that there is a shared vision about the needs of children aged 0-5 in their agencies, that 'senior managers are committed to improved services and to agencies working together' (both 3.6) and that there is a 'shared commitment to involving community members in developing services for 0-5 year olds' (3.5). Attitudes and procedures which were reportedly least prevalent in the communities were 'agreement on the priorities for service development' and 'agreed procedures for identifying children or families at risk' (both 3.2), and 'agreed procedures for ensuring that families are offered appropriate interventions' (3.1).
| Scale: 1 to 5 |
Per cent |
|||
|---|---|---|---|---|
| Average Score | Don't know | Missing | Total | |
| There is understanding among agencies of the importance of the early years. | 4.2 | 3 | 15 | 100 |
| There is a shared vision among agencies about the needs of children aged 0-5 in this community. | 3.6 | 6 | 15 | 100 |
| Agencies agree on the priorities for service development. | 3.2 | 13 | 16 | 100 |
| There is understanding among agencies of evidence-based practice. | 3.4 | 14 | 15 | 100 |
| Senior managers are committed to improved services and to agencies working together. | 3.6 | 11 | 15 | 100 |
| There is mutual respect between senior managers in different agencies providing services to 0-5 year olds. | 3.7 | 16 | 16 | 100 |
| There is a shared commitment to involving community members in developing services for 0-5 year olds. | 3.5 | 9 | 15 | 100 |
| Services work together to reach out to the most disadvantaged families in the community. | 3.4 | 6 | 16 | 100 |
| There are agreed procedures for identifying children or families at risk. | 3.2 | 13 | 15 | 100 |
| There are agreed procedures for ensuring that families at risk are offered the appropriate interventions. | 3.1 | 13 | 16 | 100 |
(N = 482)
Note: May not add up to 100% due to rounding
Operational Level Coordination
The Operational Level component of the service coordination study addressed how services worked together in practice. It measured how well services were collaborating, whether they knew about each other and whether services found it easy to refer to one another. The Operational Level Coordination component also investigated whether or not protocols existed for sharing information between agencies.
Respondents had a relatively high level of awareness of the services available to 0-5 year olds and their families in their community (Table 20). Almost two-thirds of respondents believed that they were either fully or mostly aware of the full range of services.
| Yes, fully | Mostly | Somewhat | Not really | Not at all | Missing | Total | |
|---|---|---|---|---|---|---|---|
| Per cent | 16 | 44 | 17 | 9 | 1 | 13 | 100 |
(N = 482)
Pre-existing interagency groups or committees
The survey investigated whether any relevant cooperative structures among agencies existed in the sites before CfC. Table 21 shows that 39 per cent of respondents knew of interagency groups designed to meet the needs of children aged 0-5 years in their area before CfC was established. A further 35 per cent of respondents did not know whether any such groups were in existence before the establishment of CfC. Only 12 per cent could definitely assert that there were no interagency groups prior to the establishment of CfC.
| Per cent | |
|---|---|
| Yes | 39 |
| No | 12 |
| Don't know | 35 |
| Missing | 14 |
| Total | 100 |
(N = 482)
Respondents were asked to rank how helpful they believed interagency groups or committees were in conducting a range of joint agency arrangements (Table 22). Possible answers ranged from very helpful (1) to not helpful at all (5). This question had a very high non-response rate, perhaps reflecting many respondents' limited knowledge of interagency groups and the difficulty of assessing the impact that past groups may have had. Those who did respond found interagency groups that pre-dated CfC to be moderately helpful in all aspects of working together, especially in sharing information and interagency meetings (3.7 and 3.6 out of 5 respectively).
| (Range: 1 to 5) | Per cent | |
|---|---|---|
| Helpfulness of pre-CfC interagency groups or committee |
Non-response | |
| Planning (e.g. joint planning; coordination; membership of management committees etc.) | 3.4 | 72 |
| Service delivery (e.g. joint service delivery; joint quality assurance; joint case management; sharing of costs; referrals between agencies) | 3.2 | 72 |
| Shared information (e.g. exchange of information about projects and funding sources; sharing client information; joint promotional campaigns) | 3.7 | 71 |
| Professional development (e.g. interagency staff training; joint recruitment) | 3.2 | 73 |
| Interagency meetings | 3.6 | 72 |
| Co-location | 3.0 | 77 |
(N= 482)
| Staff from different services work closely together most of the time | Staff from different services work closely together occasionally | Staff from different services know little about each other's work | Missing | Total | |
|---|---|---|---|---|---|
| Per cent | 29 | 41 | 14 | 17 | 100 |
(N = 482)
Note: May not add up to 100% due to rounding
Table 23 shows that only 14 per cent of staff from different services had little knowledge about each other's work. Almost 30 per cent of respondents said that their service worked closely with staff from other services most of the time and 41 per cent said that staff from different services occasionally worked closely together.
| A well coordinated team of services | A partially coordinated team of services | A group of separate, uncoordinated services | Missing | Total | |
|---|---|---|---|---|---|
| Per cent | 12 | 58 | 16 | 14 | 100 |
(N = 482)
Table 24 shows that while relatively few respondents (12 per cent) thought that services currently worked together as a well-coordinated team. Most (58 per cent) thought that services were partially coordinated and 16 per cent thought that services were completely separate and uncoordinated at the time of the survey.
| All the time | Mostly | Quite often | Some-times | Rarely | Never | Missing | Total | |
|---|---|---|---|---|---|---|---|---|
| Per cent | 11 | 14 | 23 | 28 | 7 | 4 | 12 | 100 |
(N = 482)
Note: May not add up to 100% due to rounding
Regarding the provision of services,Table 25 shows that about half of all respondents (52 per cent) believed that services were provided in partnership with other agencies 'quite often' or 'sometimes'. Only 11 per cent said that services were 'rarely' or 'never' provided in partnership with other agencies, compared to a quarter of respondents who said that this happened 'mostly' or 'all the time'.
| Very helpful | Mostly helpful | Sometimes helpful | Rarely helpful | Missing | Total | |
|---|---|---|---|---|---|---|
| Per cent | 29 | 34 | 18 | 2 | 17 | 100 |
(N = 482)
Respondents were generally positive about providing services in partnership with other agencies (Table 26), with 63 per cent of respondents finding it 'very helpful' or mostly helpful. Only 2 per cent of respondents found the provision of services in partnership with other agencies to be rarely helpful.
To assess the relationship between the frequency of working in partnership and perceived helpfulness of working in partnership, the variables were cross-tabulated against data about how consistently agencies provided services in partnership with other agencies (Table 27). Of those respondents working in agencies that provided services in partnership with other agencies most or all of the time, 18 per cent found that these partnerships were 'very helpful' and 11 per cent found them 'mostly helpful'. A relationship is apparent, with ratings of helpfulness higher among those who used partnerships more often. The direction of causality is not known. A Spearman Rank-order Correlation also shows significant correlation between these factors. In other words, respondents who perceived partnerships to be more helpful were more likely to work in agencies that provide services in partnership with others.
|
How helpful overall do you find these partnerships? |
||||||
|---|---|---|---|---|---|---|
|
Per cent |
||||||
| Very helpful | Mostly helpful | Sometimes helpful | Rarely helpful | Total | ||
| Does your agency provide services in partnership with other agencies? | All the time | 10 | 3 | 1 | 0 | 14 |
| Mostly | 8 | 8 | 1 | 0 | 17 | |
| Quite often | 10 | 14 | 4 | 0 | 27 | |
| Sometimes | 6 | 15 | 12 | 2 | 34 | |
| Rarely | 2 | 1 | 5 | 1 | 8 | |
| Never | 0 | 0 | 1 | 0 | 1 | |
| Total | 35 | 41 | 22 | 3 | 100 | |
Spearman rank-order correlation = 0.470, p value = 0.00
Note(s):Tthe total observations are 400 due to a total of 82 missing observations in both variables.
Percentages may not add up to 100% due to rounding
(N = 482)
Day-to-day Coordination and Effective Partnerships
To compare the level of service coordination between SFIA sites, two composite indicators, Day-to-day Co-ordination and Effective Partnerships, were created using four questions from the survey. The day-to-day co-ordination indicator was compiled from Question 15 and 16 of the Service Coordination Survey. It captures the extent to which respondents believed assistance to individual clients was coordinated and how they perceived their current working relationship with services.
The effective partnerships indicator was compiled from Questions 17 and 18 of the Service Coordination Survey. It captures the extent to which respondents believed that services to 0-5 year olds and their families were provided in partnership with other agencies and their perceptions of how helpful these partnerships were.
Based on the combined responses to the relevant questions, each SFIA site was assigned to one of the following categories for Day-to-day Co-ordination and Effective Partnerships:
- Very High level of 'Coordination/Partnership'
- High level of 'Coordination/Partnership'
- Moderate level of 'Coordination/Partnership'
- Limited level of 'Coordination/Partnership'
- No 'Coordination/Partnership'
The frameworks by which sites were coded are shown in Table 28 and Table 29.
| 4 | Very High |
| 3.0-3.9 | High |
| 2.0-2.9 | Moderate |
| 1.0-1.9 | Limited |
| 0.0-0.9 | Not at all |
| 8.0-9.0 | Very High |
| 6.0-7.9 | High |
| 4.0-5.9 | Moderate |
| 2.0-3.9 | Limited |
| 0.0-1.9 | Not at all |
The mean scores for SFIA sites were compared with the mean scores of non-SFIA sites (Table 30 and Table 31). The majority of the sites seem to have Moderate levels of Day-to-day Coordination and High levels of Effective Partnerships. The results also roughly corresponded to researcher observations in the fieldwork stage and appear consistent for most of the sites except for those with a small sample size, such as Launceston and Palmerston/Tiwi Islands. Caution should be used when interpreting the results of sites with low response rates, such as Launceston, Palmerston/Tiwi Islands and Miller. The standard deviations for these sites (which show the spread of reported scores) also indicate that data from these areas should be interpreted with caution. For example, when reviewing data from the 'day-to-day co-ordination' indicator for Palmerston/Tiwi Islands and from the 'effective partnership' indicator for Miller, both have standard deviations of 0.00. This reflects that the individual scores were the same for every observation in these sites and that there may be an upward bias as a result.
SFIA scores appeared higher than non-SFIA scores in both the measure of 'day-to-day co-ordination' and the measure of 'effective partnerships'. The difference between SFIA and non-SFIA sites was most marked in the 'effective partnership' indicator. However, these results should be interpreted with caution because of the low response rates within some of the SFIA sites. Indeed, applying a chi-square test showed that the variation between SFIA sites and non-SFIA sites as a whole was not statistically different (see below).
| Name of CfC | Mean | N | Std. Dev | |
|---|---|---|---|---|
| Launceston | 3.00 | 2 | 0.71 | |
| Palmerston/Tiwi Islands | 3.00 | 5 | 0.00 | |
| Mirrabooka | 2.70 | 10 | 0.95 | |
| Miller | 2.67 | 3 | 1.15 | |
| Cairns | 2.36 | 14 | 1.22 | |
| Inala-Ipswich | 2.24 | 17 | 1.30 | |
| Shellharbour | 2.13 | 8 | 1.25 | |
| Frankston North | 2.00 | 14 | 1.03 | |
| Salisbury | 2.00 | 16 | 0.96 | |
| Bendigo | 1.67 | 15 | 1.05 | |
| SFIA | 2.38 | 104 | 1.11 | |
| Non-SFIA Sites | 2.06 | 291 | 1.08 | |
| Unlabelled Site | 1.00 | 1 | ||
| Total | 2.16 | 396 | 1.09 |
| Name of CfC | Mean | N | Std. Dev | |
|---|---|---|---|---|
| Launceston | 9.00 | 2 | 0.00 | |
| Palmerston/Tiwi Islands | 7.20 | 5 | 1.30 | |
| Miller | 7.00 | 3 | 0.00 | |
| Mirrabooka | 6.75 | 12 | 2.01 | |
| Shellharbour | 6.29 | 7 | 0.95 | |
| Inala-Ipswich | 6.19 | 16 | 1.56 | |
| Frankston North | 6.00 | 15 | 1.36 | |
| Cairns | 5.80 | 15 | 1.97 | |
| Salisbury | 5.38 | 16 | 1.75 | |
| Bendigo | 5.17 | 12 | 1.70 | |
| SFIA | 6.48 | 103 | 0.89 | |
| Non-SFIA | 5.88 | 296 | 0.87 | |
| Unlabelled Site | 4.00 | 1 | ||
| Total | 6.00 | 400 | 1.73 |
As reflected in Table 32 and Table 33, a comparison of the SFIA and non-SFIA sites shows a similar spread between the indicator overall. Thus, the smaller group (SFIA) matched the responses of the larger group (non-SFIA) as a whole. It was only when the scores were averaged per site that difference emerged. Differences between the SFIA mean scores and the non-SFIA mean scores appear to have been based on the response rates for each site.
| Site | Not at all | Limited | Moderate | High | Very High | Total |
|---|---|---|---|---|---|---|
| SFIA (n=104) | 9.6 | 12.5 | 37.5 | 28.8 | 11.5 | 100.0 |
| Non-SFIA (n=291) | 9.3 | 13.4 | 41.2 | 25.4 | 10.7 | 100.0 |
| Pearson Chi-Square | 0.717359 | p-value | 0.95 | |||
Note: May not add up to 100% due to rounding
| Site | Not at all | Limited | Moderate | High | Very High | Total |
|---|---|---|---|---|---|---|
| SFIA (n=103) | 0 | 9 | 32 | 39 | 20 | 100 |
| Non-SFIA (n=296) | 0 | 7 | 33 | 39 | 21 | 100 |
| Pearson Chi-Square | 0.312461 | p-value | 0.96 | |||
Summary
Most services used a combination of information sources to plan, allocate resources and identify service gaps in their communities. Just over three-quarters of services used feedback from service users, while many also used client information from services and community-level information. Just over half of all agencies involved with CfC used the SFCS Outcomes Framework data, compared with 5% of those without any involvement in CfC.
Respondents who held senior positions were significantly less involved in interagency arrangements than service delivery staff who responded to the survey. Respondents in frontline and service coordinator positions were most often the ones carrying out interagency activities. Agencies most commonly collaborated by referring clients to one another, exchanging information and conducting interagency meetings.
Respondents most frequently believed that the lack of integration between different levels of government, staff problems and competition for funding between agencies were the factors most likely to hinder effective partnerships. The factors most likely to be reported as promoting effective partnerships were 'respect and understanding of the needs of families' and a 'willingness to work together'. Many respondents also called for more commitment to interagency cooperation from senior staff, with many believing that strong leadership from agency administrators and a common goal of cooperation could facilitate effective partnerships.
Most respondents believed that there was a good understanding of the importance of the early years and were moderately confident that there was a shared vision about the needs of young children in their agencies.
The majority of respondents did at least some work with other service providers (70%), with about one-third saying that their service worked closely with other services most of the time. However, relatively few respondents (12%) thought that services currently worked together as a well-coordinated team and 58% thought that services were only partially coordinated at present.
A similar picture emerged when respondents were asked how often they believed services were provided in partnership with other agencies. About half of all respondents believed that services were provided though interagency partnership 'quite often' or 'sometimes' and very few said that services were 'rarely' or 'never' provided in partnership (11%).
Respondents were generally positive about providing services in partnership with other agencies, with 63% of respondents finding it 'very helpful' or 'mostly helpful'. Respondents working in agencies that currently provided services in partnership with other agencies most or all of the time were even more positive, and 96% of these respondents found interagency partnerships to be 'very helpful' or 'mostly helpful'.
To compare the level of service coordination between SFIA sites, two composite indicators, Day-to-day Co-ordination and Effective Partnerships, were created. These indicators suggested that the majority of the sites had Moderate levels of Day-to-day Coordination and High levels of Effective Partnerships at baseline. A comparison of the SFIA and non-SFIA sites showed a similar spread between the indicators overall and suggests that the indicators are quite robust.
It seems that while many services are currently cooperating with one another to provide services to young children and their families, more could be done to collaborate further. A stronger commitment from senior managers and an explicitly stated goal of coordination could bring about more meaningful cooperation between agencies and improve service provision.
5. Fieldwork - service coordination study and partnership model study
- 5.1 Introduction and methodology
- 5.2 Implementation of CfC
- 5.3 Service coordination, delivery and quality
- 5.4 Engagement of Indigenous and CALD populations
- 5.5 Location of the CfC site
- 5.6 Summary
5.1 Introduction and methodology
As part of the Service Coordination Study and the Partnership Model Study, in-depth interviews with CfC key personnel were held during October and November 2006 in the 10 CfC sites where the SFIA study was being conducted: Bendigo, Cairns, Frankston North, Inala/Ipswich, Launceston, Miller, Mirrabooka, Palmerston/Tiwi Islands, Salisbury and Shellharbour. Appendix B provides an overview of the main features of each fieldwork site.
In each site between seven and 12 semi-structured interviews were conducted with key personnel involved with CfC. Respondents included senior managers and Project Managers of the Facilitating Partner (FP) organisations, CfC committee members, service providers, community members, local government representatives and FaCSIA State and Territory Officers. In total, 97 face-to-face and telephone interviews were conducted across the 10 sites. Appendix C contains the interview schedules used.
Table 34 and Table 35 show the breakdown of interviews by site and contact type. Each interview took approximately one hour to complete.
| CfC site | Number of interviews |
|---|---|
| Bendigo | 12 |
| Cairns | 9 |
| Frankston North | 7 |
| Inala/Ipswich | 11 |
| Launceston | 7 |
| Miller | 8 |
| Mirrabooka | 9 |
| Palmerston/Tiwi Islands | 8 |
| Salisbury | 9 |
| Shellharbour | 9 |
| FaCSIA STOs | 8 |
| Total | 97 |
| Contact type | Number of interviews |
|---|---|
| FP Senior managers | 8 |
| FP Project managers | 8 |
| CfC Committee members | 26 |
| Frontline managers of CfC funded services | 15 |
| Early years contacts in local government | 10 |
| Interagency group chairpersons | 9 |
| Relevant stakeholders and community members | 11 |
| FaCSIA State and Territory Officers | 10 |
| Total | 97 |
Interview notes and voice recordings formed the basis of our analysis, which was conducted thematically and responds to the following evaluation questions:
- How effectively is CfC managed, both by FaCSIA and the Facilitating Partners?
- How has coordination among services been improved? What are the conditions that lead to better service coordination? What are the barriers to improved service coordination?
- How extensive is collaboration across government levels and sectors, and between the community, government and NGO sectors?
- Do higher quality services now exist, in that perceived service levels have improved with regard to access and reaching those most in need?
- Is there evidence that changes will be sustained?
The findings presented below are structured around the main themes emerging from the interviews, while considering the above questions. The report considers the implementation of CfC, changes in service coordination, delivery and quality, the different approaches taken by the sites to engage Aboriginal and culturally and linguistically diverse (CALD) people, and issues relating to the location of the sites.
5.2 Implementation of CfC
The following section outlines the main findings regarding the implementation of CfC. Findings are grouped into major themes relating to the choice and roles of the FP agencies; the relationship between the FPs and FaCSIA - both the department's State and Territory Officers and its national office; the structures and processes in the CfC sites, particularly the Communities for Children Committee (CCC); and different phases in the life of the CfC Strategy.
All themes also relate to the Facilitating Partner model. Unlike most other government programs, which are funded and implemented directly by government agencies, the implementation of CfC in each community was delegated to an NGO. This is a fairly new model and a central aspect of CfC and its implementation. Therefore each of the main findings reported in this section relate not only to the implementation of CfC in general, but also give insight into the strengths and limitations of the FP model.
The Facilitating Partner agency
In all the sites visited, a high level of support for the community-based nature of CfC existed. In most sites where a local NGO was chosen as the FP, the organisation was seen as an integrated part of the community. Their local experience and connections to other agencies and community members enabled them to quickly identify local needs and draw different stakeholders into the CfC project. Sometimes local experience seemed essential. In one site with a large Indigenous population, interviewees felt that the FP manager was accepted by Indigenous people due to their previous experience of working in the site.
In most areas interviewees felt that the choice of a local NGO as the lead agency for CfC gave the project credibility and instilled a sense of community ownership. For example, one state government representative commented:
It was a very good decision that the [FP] was chosen as the driver. It's very well resourced with administrative support…the FP is respected and known in the area. And we know they do good quality work and they are an organisation that is willing to work with others.
However, in one site some interviewees felt that the NGOs lacked the transparency of a public sector provider and were more likely to be subject to conflicts of interest. In this case, the FP agency was criticised for not contracting partner agencies on an equitable basis and not providing culturally appropriate services5.
The FP agency's effectiveness in working with other service providers and stakeholders rested heavily on the skills, experience and personality of its staff, in particular the CfC Project Managers. Unsurprisingly, CfC Project Managers with a history of working in the local area had the advantage of community knowledge and already established relationships and partnerships in the site. In most sites we visited, the FP agencies seem to have chosen the CfC staff well. Many interviewees commented on how widely connected the CfC Project Managers were in the community, how skilled they were in supporting existing networks and developing new relationships, that they operated in a collaborative and inclusive manner, and that they energised others with their enthusiasm.
Two interviewees from two different sites said that choosing a local agency to lead the project created tension with other agencies in the community. One interviewee, an FP Project Manager, found that taking on the CfC leadership made them the voice of the Commonwealth government and created resentment from other agencies. This seemed more likely in sites where multiple organisations had tendered for the role of FP. Where community consensus was already established over which organisation would tender for the role of FP, there seemed to be less conflict between the different service providers. In one case, an organisation that had unsuccessfully applied to be the FP found they were in a better position to seek funding from CfC without the administrative burden of being the FP organisation.
In another area some CfC funded services felt that having an NGO as the FP created tensions, regardless of which NGO undertook this role. This resulted from the NGO assuming the conflicting roles of a funding body that they reported to, and an organisation that worked alongside them in the community.
Internally, some FPs struggled with the organisational and managerial tasks required of them as facilitators of a complex, multi-million-dollar project. In some sites, FPs and their project staff did not have enough experience in developing or managing the tender process. In hindsight, some local FP staff felt the corporate services branch of their national organisation could have handled this aspect of CfC better. This had also prompted them to reflect on their core business and their organisational strength, which they felt was service provision rather than administration. They were concerned that in taking on the role of FP they may be compromising their own service provision. One FP felt they needed to acquire legal understanding to manage contracts with the CfC service providers. Staffing problems such as difficulties recruiting qualified staff and high turnover exacerbated these problems.
In one site local government agencies criticised FaCSIA's requirement that only an NGO can be a Facilitating Partner. They felt that they should have been allowed to tender because they were heavily involved in providing child and family services. Selection criteria stipulated that local governments could be a Facilitating Partner in a consortium capacity, but not the lead agency in the consortium. In many of the other sites, local governments were closely associated with the strategy from its very early stages. In most sites local government representatives were members of the CCC, although their level of engagement varied from site to site. In one site a local government Project Manager was seconded to the FP organisation.
The relationship between FaCSIA and the FP
FaCSIA's State and Territory Officers (STOs) were the Department's contact points for the FPs. STOs manage the contract between the FPs and FaCSIA, for example by assessing the sites' Community Strategic Plans (CSPs) and service delivery plans (SDPs). They were also a two-way conduit for information flowing between the FPs and the FaCSIA national office, which has overall responsibility for CfC. In practice, the STOs role included answering FPs' questions about CfC and their responsibilities, and generally managing the contract between FaCSIA and the FPs.
In the sites we visited, FPs had developed good working relationships with their STOs. FP Project Managers appreciated the support and advice they received from the STOs. The level of input required by CfC sites, particularly in the initial phases of the Strategy, varied greatly. While STOs felt it was important to support the FPs, one STO described the relationship as:
More challenging than the usual project management relationship because you have built up quite an intensive relationship, so when they aren't performing and when things are proving to be a bit difficult it is not as easy to address those concerns - especially in relation to a committee, which can see you as being aligned with the FP.
Some STOs felt that this was not their role, and that such close involvement challenged the FP model. Others argued that very close management was appropriate given the size and complexity of the program, particularly when they experienced poor FP compliance to financial and operational reporting.
STOs reported that their role changed somewhat as the CfC projects developed. During the establishment phase in the sites, STOs spent the majority of their time on contract management. Once services had been rolled out STOs were also able to provide additional support to the FPs, such as feedback on good practice in other sites as well as their contract management role.
While relationships with FaCSIA STOs were cordial, many interviewees directed considerable criticism at FaCSIA's reporting requirements. In all ten sites FPs and many CfC-funded services complained about the extent of FaCSIA's reporting requirements for CfC and the time taken for FaCSIA to respond to submitted reports.
Agencies found the reporting requirements at times unclear, overly bureaucratic and more onerous than for other government programs. Participants maintained that the reporting requirements and expectations should have been developed and resolved before the program was implemented. Several sites that were established early in the CfC program, commented on what they saw as a lack of clear guidelines on progress reporting. They felt that the delay in receiving FaCSIA's progress reporting template contributed to this. Some FPs felt that services blamed them, for the lack of clarity in reporting guidelines.
Participants felt that the administrative reporting tasks took resources away from community-based activities. As one participant stated:
I guess it's the red tape that comes with the Department and the reporting requirements and … the shifting almost of the goalposts. And we write a report and the next report is a different template or you get a report back and they say we need this ... but they haven't put it in the report that they require that… And it's systems that are really time consuming and too elaborate and really have an impact on how much time we can dedicate to doing our job.
One FP had streamlined the reporting processes required from community partners. When a community partner was appointed, the FP developed a work plan in partnership with them that reflected their service delivery plan. The community partners attended regular project worker meetings where all requirements were openly communicated. Community partners were also supported in writing their reports so that they conformed to the department's requirements.
From a governmental perspective, comprehensive accountability arrangements are necessary whenever substantial funding is committed to a new model. In response to FPs' concerns, FaCSIA decreased the frequency and complexity of the reporting requirements. Reporting templates have been streamlined and refocused in response to the feedback provided by FPs. The frequency of reporting required each year has also decreased from four to two reports.
Many FPs complained about the time FaCSIA took to respond to their submitted reports. In their view, FaCSIA had strict deadlines for the delivery of CSPs and other documentation, but its responses to these reports were delayed. For example one FP reported that they met a tight deadline for the delivery of their CSP, only to be left waiting for several months for FaCSIA's approval. Several FPs said that such delays had led to a loss of enthusiasm in the community, thereby reducing the effectiveness of CfC. One site reported that delays in receiving already allocated funding from FaCSIA resulted in the CfC initiatives losing several months of service provision. FaCSIA reported that they are working to reduce red tape and streamline approval processes.
The next stage of fieldwork (to be conducted in October/November 2008) will assess changes in perceptions of reporting requirements.
The Communities for Children Committee (CCC)
Many of the participants were very positive about the concept of a committee where local stakeholders meet to plan initiatives for children and families in their community. In most sites FPs had successfully created such a committee. Interviewees in all fieldwork sites reported that their FP had made a genuine effort to invite all relevant stakeholder organisation as well as community members to participate in the CCC. The committees were generally regarded as open and inclusive.
However, there appear to be differences in the extent of decision-making authority that FPs confer to their committees. Most CCCs operate like management committees, with members involved in decision-making. One CCC member commented:
I think the committee is broad enough …so there is a good measure of accountability, making sure that the programs are delivered the way they're meant to be.
However, a few CCCs were more like advisory groups making recommendations that were subject to the decision of FPs. In these sites, some CCC members complained that they had to rubber-stamp the FP's decisions. They felt either that they had no time to understand what they were agreeing to, or that the FP did not consider their opinions enough. In one site, both the FP and other committee members were unsure about the function of the CCC.
Overall, most CCC members said how useful and rewarding their involvement was. Their own services and organisations benefited because the CCC provided a forum to interact with other services, share knowledge and form new connections. They learned how similar services operate, and gained insight into the work of different fields in the early childhood sector. In one site, the service system was so fragmented that many providers met for the first time at a CCC meeting. In most sites, providers felt that the CCC had reduced segregation and competition among services and created mutual respect. On the other hand, in two sites interviewees said that their pre-existing networks remained pivotal in producing a coherent sector and that the local CCC had contributed little.
The success of CCCs is largely due to two factors: the willingness of stakeholders to work together, and the skill of the FPs to harness and enhance good will. FPs were generally praised for running CCC meetings in a professional and democratic manner. This helped the stakeholders to put their differences aside, display community spirit and plan initiatives for the benefit of local children and families.
However, most sites had not managed to get all stakeholders on board. Firstly, some service providers did not have the resources to attend meetings regularly. Secondly, most sites have had difficulties recruiting parents of young children or other community members to the CCC. According to FPs and CCC members, parents felt alienated by the formal structure of the meetings and found the language inaccessible. In at least two sites, however, parent and community representatives regularly attended meetings. In one site a community representative chaired one of the committees.
Thirdly, getting representation from some disadvantaged populations, such as new migrants, Aboriginal people or people with a disability, has proven difficult. And lastly, in most sites local businesses and most private child care providers have not joined the CCC.
Some FPs found other avenues to engage these stakeholders. Two sites successfully established CCC-style committees in the different suburbs belonging to the CfC site. These neighbourhood groups included services and community members who did not attend CCC meetings. In one suburb, for example, the group brought together representatives from child care and preschool services, playgroups, a parenting program, the public library reading program, some larger NGOs delivering services in the suburb, and resident parents. The neighbourhood groups report to the CCC, so their views are incorporated into the ongoing work of CfC.
One site tried to engage child care centres, which for the most part did not attend CCC meetings, through a common objective - namely transition to school - in a Transition Network that was partly funded by CfC. Another site's CCC approached a local Aboriginal organisation to deliver one of the services proposed in the community strategic plan. Local businesses were engaged only in very small ways. In one site, for example, shopkeepers were asked to display posters and pamphlets for parents, and to refer them to CfC-funded services. However, in one site a representative from the Chamber of Commerce was a member of the CCC.
Interviewees in one site observed tension within the CCC once its members started competing for CfC funds.
In one site a state government representative on a CCC felt that government agencies should be allowed to vote in the committee. In their view this would increase accountability of CfC; they felt governments should have a voice if they are an active player in the site. Nevertheless there was consistent active participation in CCCs of state government departments providing early childhood and family health services.
Phases in the life of the strategy
A strong theme common to all sites we visited was a series of pronounced changes in the work and attitudes of people involved in CfC as the project went through different stages in its life cycle. We identified three distinct stages: the establishment phase, the implementation phase and the sustainability phase.
The establishment phase
This was the initial phase of CfC. The FPs established their internal structures for managing CfC, they set up the CCC and possibly other committees in the sites, led the development of a community strategic plan, the development of tenders and expressions of interest, and funding of CfC services and initiatives. Virtually every interviewee who was involved with CfC during the establishment phase, including the STOs, commented on how time-consuming and labour-intensive it was.
This applied especially in sites that did not have a history of working groups for the early years. The consensus seemed to be that it takes between one and two years to build a stakeholder network. It also required a lot of effort and skill from the FP personnel. We often heard that the establishment phase was very tiring and draining, and that FP personnel burned themselves out. High staff turnover in the FP agency's coordinator role in the first year of CfC was criticised by partner agencies in one site as being very disruptive. In some sites putting the CCC together took so long that there was little time left to develop the CSP and consult with the community. One FP commented that the limited time available to adequately develop and establish some services, on the basis of sound research evidence and local needs, created challenges and problems that continued throughout the implementation of the program.
Once the CSPs were finalised and approved by FaCSIA, the FPs' attention shifted to selecting agencies that would provide CfC services. FaCSIA required that FPs ensured transparent and merit-based processes for the selection of sub-contractors, who then entered into an agreement with the FP. Generally, FPs awarded CfC services through an open, competitive tendering process. Only in a few instances did FPs ask agencies directly to provide a CfC service or develop a proposal. This usually happened where no tenders were received for a CfC activity proposed in the CSP, or where time or resources were not available for undertaking a tender process. The interviews showed that going through an open tendering process always required extensive administrative effort, was usually protracted, and sometimes led to tensions among local agencies. However, FPs pursued this option because of FaCSIA requirements and to ensure their processes were open, cooperative and democratic.
The implementation phase
The implementation phase began when tenders had been awarded and the CfC initiatives and services started their work. In all sites we visited, this was a positive time. Finally seeing CfC engaged on the ground and impacting directly on children and families energised the FPs, committee members and local services, and it made all the initial effort seem worthwhile. FPs and service providers told us that they were now free from intense negotiations among themselves and had more time to go out into the community, engage families and develop trust. However, a few interviewees said that a shortage of qualified staff had made it difficult to start new programs.
It was a common experience that during the implementation phase the CfC structures in the sites needed to be adjusted. This concerned the CCC in particular. Its original functions were to bring stakeholders together, identify the needs of children and families in the site, and devise a community strategic plan. Most sites also chose to involve their CCC in tender selections. Once all this had been accomplished and the work shifted to the agencies that deliver CfC services in the community, the CCC's role also changed. The new focus included contributing to annual service delivery plans, monitoring progress and reviewing performance, and contributing to FP progress reports. At that stage, many sites found some CCC members lost interest in meetings, and the network that had been built with so much effort and enthusiasm was compromised. In one site for example, attendance at CCC meetings was falling, there were no agendas, and the frequency of meetings was dropped from monthly to every three months.
FPs dealt with the problem in different ways. One site devised a new focus for their CCC. The committee now receives reports from the CfC services, supports the services and tries to develop sustainability strategies.
Several sites had reviewed their entire CfC governance structure. At the time of our fieldwork, one site was planning to disband the CfC executive, which consisted of the FP and two other major stakeholders in the site, and replace it with a group comprised of 7-8 key agencies and community representatives with different skills and types of expertise. The CCC would be a project reference group with an advisory role. Another site also established working groups of senior staff of all CfC projects in the site.
The sustainability phase
As a site moved towards the end of its CfC timeline, sustainability became the main focus - sustainability of both the services funded through CfC, and the partnerships that had been established. Although it should be noted that some sites have already put in place or were in the processing of developing sustainability and exit strategies in the establishment and implementation phases. The fieldwork indicated that some CfC services might continue to operate for a time after the program finishes. On the other hand, maintaining networks and cooperation among agencies and community members will probably require continued funding from other sources. A further concern of one FP was that the capacity of the private sector for corporate philanthropy was also restrained (by economies of scale) and it was unrealistic of FaCSIA to expect they could achieve corporate refunding of their activities.
In several sites, FPs and CfC service providers were developing strategies to keep direct services operating beyond the funding period. In some cases, CfC money was used for the establishment cost of a program that could continue with little financial input. In one site, a community centre used CfC money to start new playgroups, a parent drop-in and library reading groups. It offered these services for free. Once the groups are firmly established and CfC money runs out, the facilitator expects that they will be able to keep the groups going through charging parents a small fee. In another site, a playgroup facilitator who was paid with CfC funds was training parents to run playgroups by themselves. Some services tried to move families from CfC-assisted playgroups into community playgroups, while other agencies will receive ongoing state funding, if only for a reduced service. Several FPs were trying to engage local businesses to sponsor services after CfC funding ends. However, several interviewees feared that, once CfC programs finish, community morale would falter and the enthusiasm and good faith created through CfC may disappear.
Some fieldwork participants were also concerned about the difficulties of sustaining infrastructure once CfC funding ceases, for example child and family centres established under CfC. One site, which has located their centres on school grounds, hopes that the schools will continue to maintain the building and supply materials. In another site, CfC has convinced the local council to lease a building that can be used in the future for CfC-type services.
The most important goal of CfC, however, is not new service provision but better cooperation among existing agencies and changing practices in the local community by improving the levels of skills. As reported above, setting up partnerships in the sites required much time and enormous effort by FP personnel, and it was dependent on CfC funding. The question remains whether local partnerships will continue to operate after CfC, if there is no one to drive them or no other funding to support them.
In one site, for example, stakeholders felt that after three years of CfC the local service providers would be well connected. However, ongoing funding for personnel or a committee to hold the partnership together when CfC funding ends was not in sight when we visited. In another site the situation looked more promising. Here the FP was a member of a local early years network that was established previously under a state-funded initiative similar to CfC. This network included mostly agencies from different government levels, but also representatives from universities and key NGOs. It provided policy direction for several early years services and programs operating in the community, including CfC. Fortunately, both state and local governments have committed funds to keep the network operating in the future.
In one case a state government has already committed itself to an early years agenda which was incompatible with the CfC. However, in other sites the state government's early years agenda was an integral part of CfC and added impetus to the promotion of the importance of early intervention for children 0-5 and their families.
This latter point illustrates that the long-term sustainability of interagency working in the five-and-under age group is dependent on States and Territories and the Commonwealth working together and integrating their programs. Whilst NGOs are in a good position in many local areas to draw agencies together, and to focus resources on the needs of the local community, they cannot set the overall policy and funding context on which sustained service delivery and coordination is dependent.
5.3 Service coordination, delivery and quality
Impact of CfC so far
In the sites where CfC services had already been established at the time of the fieldwork, FPs and service providers felt they were meeting the needs of their community and ensuring seamless provision. Receiving a substantial amount of funding specifically earmarked for young children and their families provided a great boost to the communities and was much appreciated by our interviewees. CfC funding gave the sites opportunities to:
- conduct a needs assessment of young children and their families in the community;
- address some service gaps, e.g. assisted playgroups and parent drop-ins;
- improve access of parents and their young children to existing health, education and other services;
- trial new ways of service delivery, e.g. family centres on school grounds;
- establish preventative services, e.g. a speech therapist who visits playgroups or music and pre-literacy skills development for infants;
- complement state-funded services, e.g. help parents who were at risk of having their children taken away;
- increase awareness of the needs of young children and their families, and put the early years on the local agenda, especially of local government;
- coordinate different agencies to work together to achieve a common goal;
- rejuvenate or complement existing early years networks and involve new players;
- trial innovative programs, e.g. professional development for early years staff to work with vulnerable families;
- access some hard-to-reach families, e.g. Aboriginal people attending CfC-funded community events.
Many interviewees told us how excited they were about such opportunities, and that they felt CfC could make a real difference to individual families and the community. As discussed earlier, CfC has also helped agencies to cooperate more, specifically through meeting each other in the CCC and developing a Community Strategic Plan together. One interviewee said that CfC was:
… breaking silos. There's more willingness to work together. … It's given us a chance to learn more about other agencies and how we can connect our clients with others. There's more of a concerted effort to do more and embrace connectiveness between agencies.
It is too early to say, however, whether CfC has succeeded in building sustainable partnerships among agencies and in improving services and service delivery long-term. As mentioned above, it seems that continued financial support by state and federal governments is essential to achieve lasting change.
For example, in one site the state health department received CfC funding to establish a speech pathology outreach service. This initiative has been driven by one individual in the health department. It has proven highly successful at accessing children who would otherwise not use the service, at providing treatment early, and at educating parents of children with language difficulties. At the time of the interviews, it was a full-time service and still over-stretched because the need for speech pathology in the site was so great. However, when CfC funding ends the state government will continue the outreach service for only four hours a week.
Changes in service coordination, delivery and quality varied among the sites. At the time of the fieldwork, agency networks and services were more established in some sites than in others and therefore more likely to show the changes resulting from CfC. However, we observed a number of general factors that facilitated or inhibited changes to service coordination, delivery and quality in any of the sites. These factors are discussed in the two sections below.
Facilitators of improved service coordination, delivery and quality
We found a number of factors helped to improve services, and coordination among agencies, in a CfC site. An important factor seemed to be the presence of other successful interagency groups around child and family services. If CfC built on, or was integrated into, the work of such a group, the effectiveness of CfC would be enhanced. Less time and effort were needed to establish a service network, and resources could be maximised. In one site, for example, CfC started at the time as a similarly focused state-funded project was finishing. CfC piggy-backed on the partnerships, good will and services created under the state project.
CfC effectiveness was also enhanced where other substantial early years initiatives were being implemented simultaneously. In one site, CfC coincided with several substantial state initiatives to improve outcomes for young children and their families. Key stakeholders, including the CfC Facilitating Partner, formed a group to consult with the community and develop a common vision for children and families, and to link new with existing services.
Other factors that facilitated improved service coordination, delivery and quality included:
- high levels of skill on the part of the FP personnel to engage with different levels of government and community representatives and maintain engagement. As mentioned earlier, building good personal relationships with other stakeholders was a key to the successful implementation of CfC.
- strong support for the local FP staff by higher levels of the FP organisation. STOs have observed that FPs were more successful if they worked within an NGO that had a strong vision of child-friendly communities, or that offered administrative support.
- pre-existing community spirit and willingness by stakeholders to participate. In one site, for example, CfC made connections with families in a public housing estate through a state government-funded program that already operated there.
- structures set up by the FP in addition to the CCC. This included working groups and neighbourhood committees. Such structures ensured input from community members and other stakeholders who did not participate in the CCC (as explained above). They also helped to embed CfC in an extended service network and the wider community.
- cooperative and collaborative relationships, in some cases, between FPs (across a state or between neighbouring CfC sites) have been a useful resource for FPs.
- clear and regular communication of information by the FP;
- transparent and equitable decision making processes and
- the boundaries of the CfC site corresponded to an existing community. Where the suburbs or towns within the site were geographically close, share facilities and already formed a community, FPs found it easier to form partnerships with other agencies, local councils and with families, and to keep them engaged.
Barriers to improved service coordination, delivery and quality
Since the factors mentioned above facilitated the effectiveness of CfC, an absence of those factor inhibited the successful implementation of CfC. For example, in sites that had no pre-existing interagency group for the early years, the FP had to put in considerable effort into forming partnerships and developing common goals. Where existing inter-agencies were concerned with a broader age group of children, or participating agencies were drawn from a much larger or different geographical area, CfC could not capitalise as easily on pre-existing networks. In sites where other early years networks or initiatives existed, some interviewees expressed concern about duplication and confusion, and about multiple committees taking up people's time. Interviewees in several sites said that services were already over-stretched. In addition, qualified staff shortages and high staff turnover inhibited the effectiveness of CfC activities.
A substantial barrier to improving services and coordination existed where the boundaries of CfC sites did not correspond to locally defined natural communities, but rather contained an artificial grouping of towns or suburbs. Usually these were geographically dispersed: either situated next to one another forming a string, or one suburb or town being geographically distant from the others. Interviewees stated that it was difficult to engage services and families from isolated, diverse communities because they did not see themselves as belonging to the CfC site. In geographically dispersed sites, sheer distance and restricted transport options could limit access to CfC services, especially for disadvantaged families.
In one case, the suburbs belonging to the CfC site were situated well away from the regional business centre and therefore not regarded as a home base by many service providers. One interviewee felt that this contributed to delays in CfC establishing itself and linking services.
The selection of sites was a government decision based on a range of information including consultations with State and Territory governments, indicators of disadvantage (using SEIFA and other ABS data), the number of children in the community, and significant numbers of families receiving Family Tax Benefit. Also considered was the existing level of physical infrastructure to enable the implementation of CfC; the level of other similar existing services in the community; and a national spread of urban, regional and remote sites.
In addition to site boundaries, interviewees reported two other important factors they felt inhibited better service quality and coordination in the sites: FaCSIA funding restrictions and CfC time constraints. Interviewees in several sites criticised that all CfC funding had to be allocated at the start. They felt that sustained commitment by agencies to collaboration was often dependent on the possibility of future funding:
Another challenge is about the requirement by FaCSIA … about committing the money at the very beginning. Because for some of the committee members and the community and the agencies, once you've committed all your money there's a bit of "what's in it for me, then so what's the point of being involved?" And it doesn't matter how much you talk about collaborative work and the need for that, money helps.
Concerns were also voiced about perceived FaCSIA restrictions to adjusting service content and delivery in light of experience or evaluations of service effectiveness. In other words, if a CfC-funded program did not work well, they did not believe they were able to easily stop and change or amend programs. However, according to FaCSIA's guidelines, funding can be adjusted if negotiated with the department. While funding allocations in each site's strategic plan show the spread of funding across the years and broadly across the site's strategies, the service delivery plans, which detail the activities and organisations funded, are reviewed and approved annually. In addition, FPs can submit varied strategic and service delivery plans to FaCSIA for approval at any time.
In some areas problems arose because some community partners receiving CfC funding did not possess the capacity and skills required for managing and delivering the service. Additional resources were required to train and support staff to build capacity within the agencies.
Lastly, interviewees in every site we visited saw the short-term nature of CfC as a major barrier to its effectiveness. People from all stakeholder groups, including STOs, reported that four years was too short to get new services established, to break down the families' entrenched distrust of agencies and to install a commitment to early childhood in the community, especially in local government. Some interviewees feared that the community might be demoralised further if services were created and then reduced or withdrawn. Also, the time constraints might deter potential service providers from making the effort to develop a service that they have to wind up after a short while.
5.4 Engagement of Indigenous and CALD populations
Seven of the ten fieldwork sites had a sizeable proportion of Aboriginal and Torres Strait Islander or culturally and linguistically diverse residents (see site overview in Appendix B). Social and economic disadvantage was often more severe and more widely spread within these groups than within the general population in the sites, making CALD and Indigenous people important target groups for CfC interventions. This section reports in which ways and how successfully CfC has engaged with Indigenous and CALD populations in the fieldwork sites.
FPs commented that long-established links with Indigenous peoples had facilitated introducing CfC to the communities. One interviewee said the Indigenous residents knew and trusted her, and she respected existing networks and programs and was willing to fit in with them. The relationship was collaborative, to the point where the FP helped an Indigenous health organisation with restructuring and planning for sustainability.
Where links were not so strong, some fieldwork sites had made efforts to reach out to Indigenous and CALD communities. One site, for example, held a CCC meeting in an area with a large Aboriginal population to encourage people from the area to attend. One interviewee from an Aboriginal background appreciated that the FP had written an e-mail newsletter in plain language.
In another site, CfC had made a concerted effort to access hard-to-reach population groups such as CALD and Indigenous by creating so-called soft entry points: CfC took services to places and situations where people felt comfortable. For example, mobile playgroups operated in local parks and attracted families who otherwise did not access playgroups, speech pathologists and nutritionists visited playgroups, and CfC organised family days in community parks. A service provider commented:
Some of those community networking days have been really good (…). I saw a family there because I was working in one of the stalls that we have struggled to see and we know. I met the patriarch of this family (...) To see him there with all of those grandkids - they are really low socio-economically, lots of issues, Aboriginal, have all had child protection issues. To see them there connecting in with that community day - that's exactly what we want. (…) It was really, really lovely to see those masses of kids that we've been trying to get a hold of.
Other soft entry points in the site operated on an ongoing basis. These were family centres on school grounds funded through CfC and offering playgroups - including one specifically for Vietnamese children -, parenting information sessions and a host of additional services and activities, some in cooperation with other providers. Every interviewee in the site told us how successful these centres have been, particularly at engaging CALD and Aboriginal families. The centres were visited by parents of schoolchildren who had previously not been seen on school grounds, and teachers met young children from the community before they start school.
According to service providers in the site, the soft entry point strategy has raised families' awareness of issues and services provided in a non-intrusive, non-clinical and respectful way.
Apart from these successes, most of the sites we visited struggled with engaging CALD and Indigenous families. While CfC is a flexible model that is meant to enable appropriate responses to community needs driven by the local community, interviewees from all stakeholder groups talked about the difficulties of working with Indigenous communities in general. Remote Indigenous communities were found to be particularly difficult to work with and consequently, some interviewees raised concerns that the CfC model was not appropriate for these Indigenous communities. Cultural, technical, social and economic obstacles were mentioned. For example:
- In one remote Indigenous site, the FP had enormous difficulty finding community partners to deliver CfC services. The site would need a period of community capacity building first.
- Indigenous communities often have funerals, taking several days each. During that time, services close their offices, and reports get delayed.
- Telephones and internet do not always work, and people lose reports.
- Difficult living conditions - overcrowded houses, lack of sleep - and inadequate nutrition make participation in meetings difficult. FPs and STOs reported that they took food when they visited remote communities.
- Indigenous peoples have experienced repeated short-term government interventions, but no sustained engagement by authorities. This has eroded trust and made them wary of working with CfC.
Other barriers to engaging Indigenous and CALD populations related to FaCSIA's guidelines and implementation of CfC. An Indigenous interviewee felt it was a problem that CfC was about a region, not individual communities. She noted that it was difficult to bring regional issues to the local level, especially in a geographically large site; and that information needed to be put into a local context to make individuals understand it and feel valued.
Although the model is designed to be flexible, there was a perception that the model was not sufficiently flexible to appropriately consult with and engage Indigenous people. On the other hand, one STO remarked that they had to actively encourage FPs to consider Indigenous residents so that this important target group was not overlooked in CfC planning.
5.5 Location of the CfC site
The CfC sites visited during the fieldwork spanned a wide range of locations - metropolitan suburbs, compact regional towns, dispersed outer metropolitan and regional communities, and remote areas. One of the aspects investigated during the fieldwork was whether there were any issues in the implementation of CfC, or in its impact on service coordination, delivery and quality, due to the location of the site.
A major issue was that sites in remote areas had to cope with long distances between communities. One FP commented that they did a lot of work by telephone, but had to visit communities as often as possible to build rapport with local residents and services. Time and monetary costs involved in travelling have been considerable. In tropical areas, FPs pointed out that overland travel was possible only during the dry season. During the wet, even air travel was weather-dependent, as storms could ground aeroplanes at any time.
Otherwise, the interviews showed that most sites, regardless of their location, had some difficulty because they consisted of several suburbs or settlements rather than one locally defined natural community. Several participants were somewhat sceptical about the criteria that the government used to choose the CfC sites and felt that other areas could have benefited more from the additional funding. In addition it was noted by several participants that the available funding varied considerably from site to site.
In metropolitan areas or regional towns, the suburbs of a CfC site were usually adjacent to each other, but residents did not necessarily feel they belonged to the same community. This was even more pronounced in several sites that consisted of a string of discrete communities, often very different in character. The Cairns site, for example, encompassed outer metropolitan suburbs, a separate, mostly Indigenous community, and a rural area. In all sites, many child and family services established before CfC were provided either in the individual suburbs or communities, or in the nearest central business district, usually outside the CfC site.
The regional rather than local character of CfC made it difficult for FPs and their community partners to treat the site as one entity and to enhance service coordination long-term. Some sites incorporated a number of different local government areas and area health boundaries which made it difficult and time consuming for FPs to engage all relevant stakeholders and to actively promote CfC across all these organisations and departments. As a result, in some locations CfC operated as a collection of separate communities. Some sites have established neighbourhood groups at the community level to feed into the CCC, as mentioned above. Likewise, many CfC-funded services were provided at the local level, for example playgroups, family centres and community events in local parks. One FP commented that this drained resources.
5.6 Summary
The FP model forms a central aspect of CfC. Therefore the fieldwork findings reported above regarding the implementation of CfC and its impact on services in the sites also gave insights into the strengths and limitations of the FP model. These insights relate - as does the entire report - only to the initial stages of CfC. The repeat of the service coordination study will provide far better information about the impact of CfC in the sites and the extent to which they have been able to transform service provision for the early years.
The FP model represents an alternative method of funding government services. Most government services are provided directly, either through government agencies or through private or non-profit providers that have been contracted by the government to provide particular services to the population. Funding models such as the FP model have rarely been used, and evaluations are not yet publicly available. It is therefore important to assess the effectiveness of the FP model as a vehicle for distributing government funding.
Under the FP model, an NGO was chosen as the lead agency in each CfC site. Often the NGO was locally based and well integrated into the site's existing service network. Overall the community-based nature of CfC was regarded by participants as positive. Most interviewees found that it gave the project credibility and instilled a sense of community ownership.
However, the effectiveness of the NGO in implementing CfC depended to a large extent on the skills of the FP personnel and the resources at their disposal. In sites where FP personnel were able to develop relationships with stakeholders easily and to spread enthusiasm about CfC the implementation process progressed more smoothly. Support from the NGO's state or national offices was also important in the implementation process due to the complex administrative, management and legal tasks required from them as the leaders of a multi-million-dollar project.
FPs also received support from the government funding body, FaCSIA. The department's regional representatives, the STOs, provided interpretation as needed of FaCSIA requirements and guidance for the implementation.
Due to the flexible and new processes involved in rolling out this large scale program, there were some teething problems reported. These included the view that the implementation of CfC was inhibited by administrative burdens and tight timelines imposed by FaCSIA. In all fieldwork sites, FP's struggled with reporting requirements that they considered overly extensive and complicated. They felt that complying with the requirements diverted resources away from working in the community. In addition, many interviewees said the lack of clarity in the FaCSIA requirements and delays in responses from the department created difficulties. Nevertheless some of the respondents acknowledged the need for accountability and active engagement by FaCSIA. FaCSIA has also been responding to feedback and streamlining processes.
The implementation of CfC appears to have been useful as a vehicle for increasing the level of service cooperation in the sites. Under the model, the FPs were required to establish the Communities for Children Committee (CCC), a working group of child and family services and other stakeholders in their site. Most interviewees regarded the CCC very positively. They reported that the FPs had made a genuine effort at being open and inclusive by inviting all relevant stakeholder organisations as well as community members into the CCC. Many CCC members said how useful and rewarding their involvement was, especially in sites where no other early years network existed. Service providers could interact with others in the field and share knowledge. Most interviewees felt that the CCC had reduced segregation and competition among services and created mutual respect.
However, most sites had difficulties in recruiting all relevant stakeholders to the CCC especially parents of young children or other community members and representatives from some disadvantaged populations, such as Aboriginal people or people with a disability. Also many found it difficult to engage local businesses and most child care providers. Some FPs developed other avenues to engage these stakeholders.
Due to its community-based nature, CfC appears to have facilitated some improvements in service delivery and quality in the sites. Local plans were developed that gave stakeholders the opportunity to build on community strengths and address some service gaps and put early years strategies in place that they felt were most helpful for their site.
However, the implementation of CfC was inhibited in some ways by the artificially constructed boundaries of some CfC sites, which were contrary to locally defined communities. The sites usually encompassed several suburbs or settlements, or even large rural or remote areas which were not always one locally defined natural community. This created significant obstacles to the FPs' ability in these cases to engage all relevant stakeholders, improve service coordination long-term and deliver services to young children and their families in all parts of the site.
At this stage it is not clear whether the implementation of CfC, using the FP model, has had a strategic impact in the sites, i.e. whether it has been able to build sustainable service networks and improved services. It appears that continued financial engagement by state and federal governments remains essential.
5. Such an approach is contrary to FaCSIA's CfC Service Provider Guidelines, which require FPs to establish a fair and transparent funding process. While FPs may approach service providers within their community who they are already familiar with, the selection of these providers must be supported by the CCC. Alternatively the committee may decide to invite submissions from the community. In order to promote and further improve cultural sensitivity, FaCSIA has conducted a number of forums for FPs on the topic.
6. Discussion
This report provides an overview of the early implementation of the CfC initiative. It shows that CfC has been targeted at disadvantaged (although not the most disadvantaged) communities in Australia. It also shows that although there has been some history of working together between agencies, in most cases this had been embryonic.
The report highlights the considerable challenges faced by policy makers, managers and practitioners attempting to implement this complex and ambitious Government strategy. Overall the findings indicate that the challenges have been addressed, and CfC has made a significant impact on the delivery and configuration of services in the 45 sites in which it is operating. There is universal agreement with the basic principle underlying this initiative - that coordination of services and community engagement are crucial for the effective provision of services to children in their early years and their families. The evaluation has shown that in most sites CfC provided 'step change' in the level of awareness and recognition of the need for agencies to work more closely together. It has also already funded many innovative services.
On the other hand, the difficulties have also been very considerable. Although this report highlights many barriers to effective implementation of CfC, it is clear that there are four underlying challenges which underpin most of the concerns expressed by respondents:
- The short term nature of the funding
- The trade off between local determination/empowerment and accountability/prescription
- Engagement of the States and Territories at a strategic level
- Difficulty engaging with 'hard to reach' groups in the communities.
For some sites, an additional issue relates to the definition of the site itself - either its size (encompassing several communities), its shape (not being coterminous with 'natural' community boundaries and/or administrative boundaries) or its demography. This raises issues regarding the definition of 'community intervention' in the Australian context.
All the CfC initiatives had made considerable efforts to deal with these issues, as is described above, and in most cases they have been relatively successful. However there are lessons to be learned for the implementation of place based programs in the future. In particular there is some consensus that these will benefit considerably from
- Longer funding period
- Longer lead-in times
- More flexible use of resources so that funding can be more easily adjusted throughout the life of the program
- Engagement of State and Territory policy makers in the initiative
- A better understanding and communication of what is required in each site, and what is discretionary
Successful implementation of the initiative seems to depend considerably on the skills and networking abilities of the FP, and in particular the Project Manager. The optimal model for CfC seems to be one in which the Project Manager has a history of positive engagement in the local community, and has built up trust and respect of local services. This needs to be combined with access to the resources of large NGO - procurement, accounting etc - which are essential for running a complex program such as CfC. However the strength of the FP model is also its major weakness. In sites where the Project Manager is weak, or more likely, where there have been changes of Project Manager, this has caused major disruption to the Initiative. This also is a concern for sustainability because Project Managers are unlikely to remain in post until the conclusion of the funding period. Ultimately CfC will have to develop a model which is embedded in the local service provision and not dependent for its progress on the Project Manager.
It is important to remember that this is a 'baseline' report, which is intended only to address the initial implementation of CfC, and so all the conclusions and findings herein should be considered as tentative. Nevertheless we believe that there are some important lessons from this stage of the evaluation which will be important learnings not only for CfC but for all place based initiatives.
References
Department of Employment and Workplace Relations (DEWR) (2005) Small Area Labour Markets, Australia, September Quarter 2005. DEWR, Canberra.
Himmelman, A.T. (2001), 'On coalitions and the transformation of power relations: Collaborative betterment and collaborative empowerment', American Journal of Community Psychology, April, 227(8).
National Center for Family Support (2000), Fast Fact Results, Topic: Collaboration, available at: http://www.familysupport-hsri.org/resources/ff_2.html, accessed 6.6.2005.
Sullivan, J., D.S. Gilmore and S. Foley (2002), Research to Practice: Findings from the National Survey of State Systems and Employment for People with Disabilities. Collaboration Between Medicaid and Other Agencies, Institute for Community Inclusion-Publications, v.8, no.1, December.
VicHealth (2003), The Partnership Analysis Tool, VicHealth, Carlton South, Victoria.
Walker, R. (2000), Collaboration and Alliances: A Review for VicHealth, VicHealth, Carlton South, Victoria.
Appendices
- Appendix A: Snapshot questionnaire
- Appendix B: Overview of fieldwork sites
- Appendix C: Interview schedules
Appendix A: Snapshot questionnaire

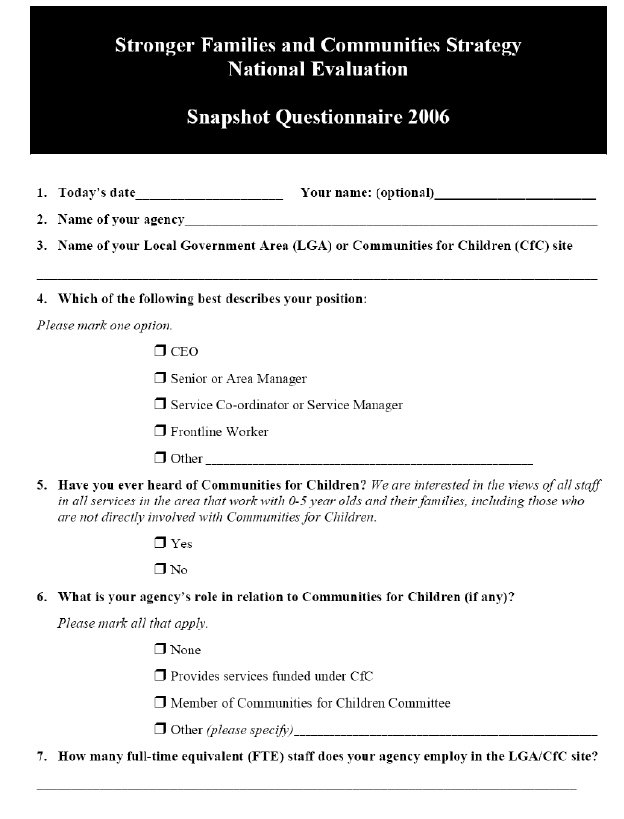
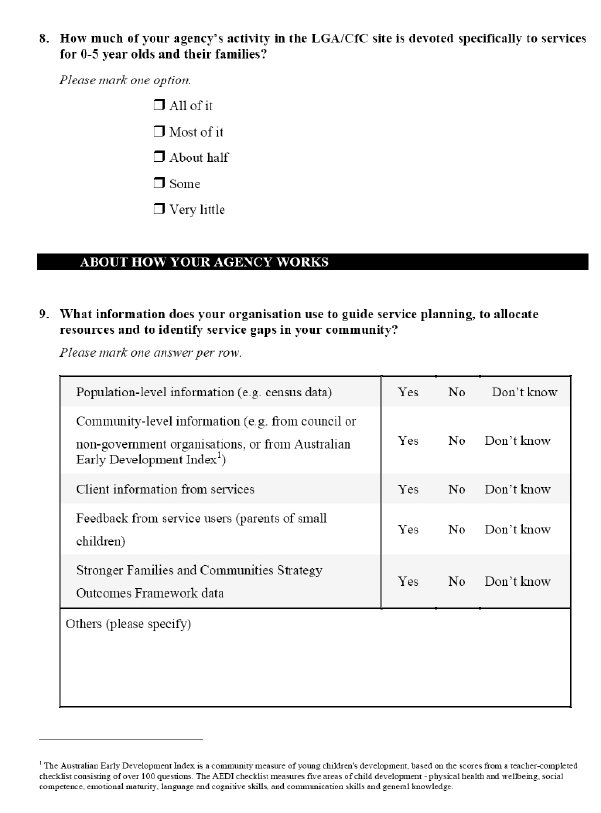
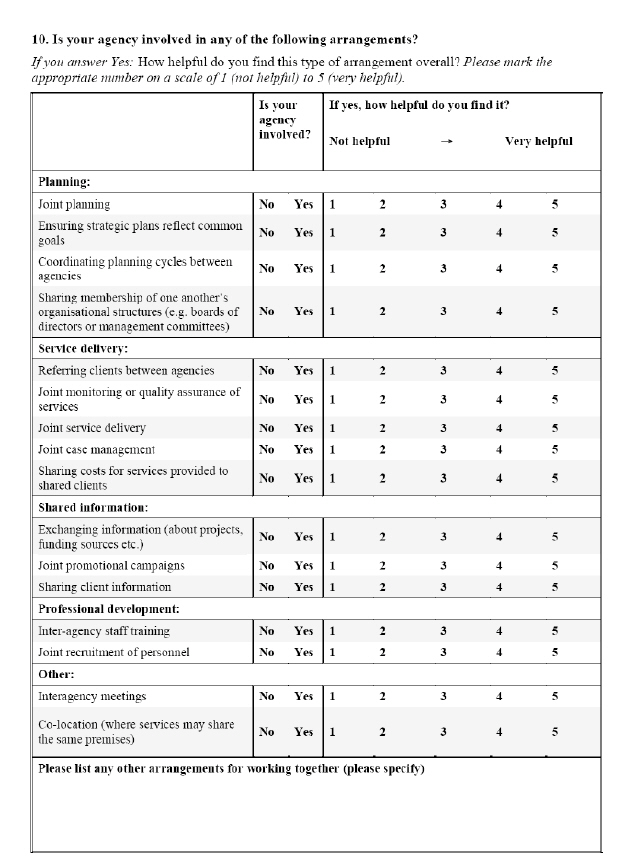
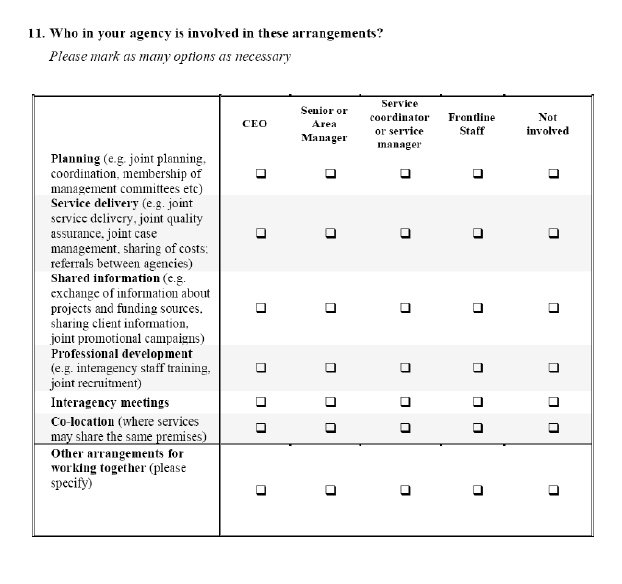
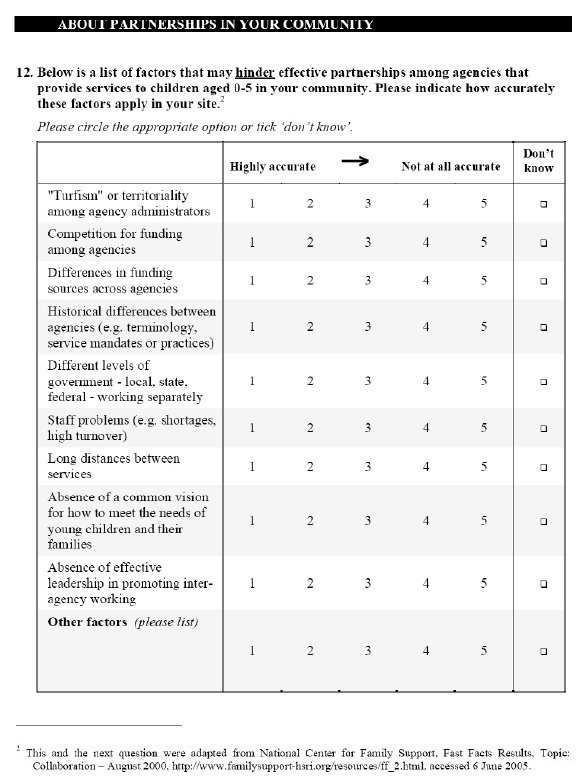
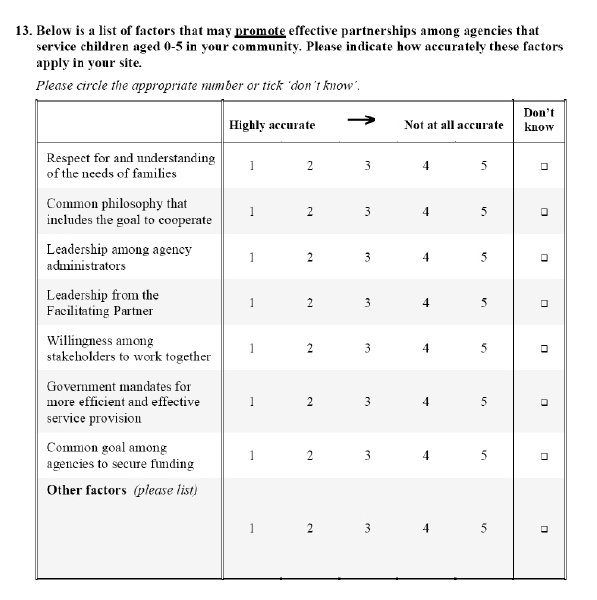
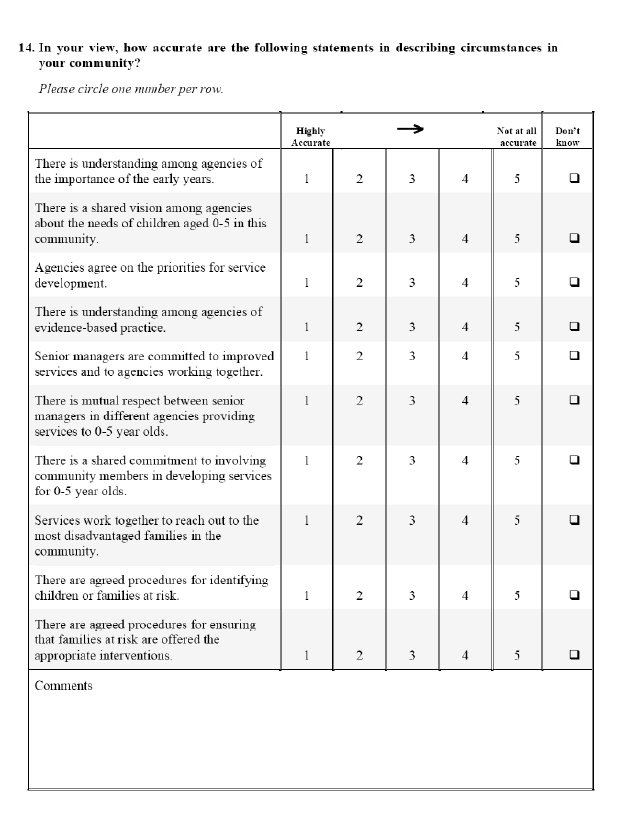
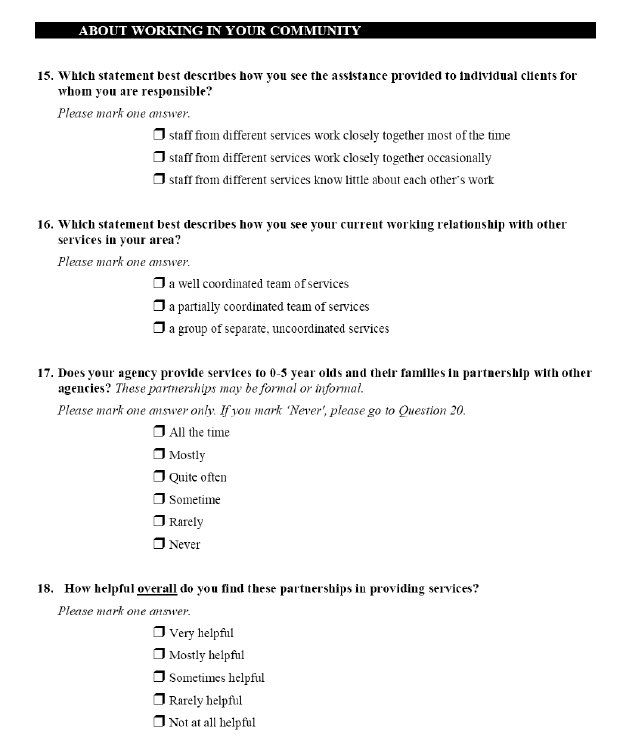
Appendix B: Overview of fieldwork sites
The following site descriptions include basic geographical and demographic information including employment, level of relative disadvantage, an overview of the FPs, key CfC initiatives and service providers' perception of the level of day-to-day coordination and the effectiveness of partnerships.
These descriptions are based on data from the 2001 Census of Population and Housing, 2005 small area employment figures published by the Department of Employment and Workplace Relations and Community Strategic Plans provided by the FPs in 2006. For most indicators, 2001 Census data were the most current available at the time of writing. It is likely that some of the demographic indicators will have changed since 2001 but in general, these data should offer a reasonably accurate reflection the current characteristics of each site.
Site descriptions also include preliminary summary results of services' day-to-day coordination and effective partnerships. This is based on data from the Service Coordination Study. For the detailed analysis of these results, see the Operational Level Coordination in Section 4.3 Results.
Further
Bendigo
The Bendigo CfC site is located within the Greater City of Bendigo, a regional city in Victoria. The site covers six suburbs and has a population of 35 000, about a third of Greater Bendigo. In 2001, there were 2963 children in the CfC site aged 0-5 years. This equated to 8.4% of the population, which was slightly higher than in Australia as a whole (7.6%). Ninety per cent of Bendigo residents were born in Australia, and 0.7% identified as Indigenous, slightly more than the state average (0.5%).
Only three of the 39 Collection Districts (CD) in the Bendigo CfC area had SEIFA scores above the mean of 1000. Several CDs had low rankings, reflecting a relatively high level of disadvantage, with the lowest at 599.
Unemployment rates were slightly higher than in metropolitan Melbourne. While most families with young children in the CfC site had at least one parent in employment, many are relatively poor. In 2001, 35% of children in the Bendigo CfC area lived in families with gross incomes of less than $500 per week.
Bendigo is in the second CfC wave. The CfC Executive is formed by a partnership between the Facilitating Partner (St Luke's Anglicare) and two other agencies - Bendigo Community Health Service and the City of Greater Bendigo.
Among other initiatives, CfC supports schools to become community hubs, joins with two large state-funded programs to try and make Bendigo a more child-friendly city, and reaches out to the growing numbers of Aboriginal residents in the site.
Preliminary analysis of the snapshot survey indicates that early years services in the Bendigo site seem to have a relatively low level of day-to-day coordination and moderately effective partnerships.
Cairns
The Cairns CfC site is located in the City of Cairns, a regional city on the North Queensland coast. In June 2005, 39 500 people lived in the Cairns CfC site, almost a quarter of the population of the City of Cairns. The CfC site encompasses Cairns' southern growth corridor as well as Yarrabah Shire and some rural areas up to 75 kilometres to the south and east of the city. Some areas are experiencing rapid population growth. Several areas of the site are inaccessible and physically isolated. The lack of adequate public transport together with the area's large transient population makes service delivery challenging.
In 2001, the Cairns CfC site was home to a relatively high proportion of children aged 0-5. They made up 10.4% of the population, compared with 8.2% in Queensland and 7.6% in Australia as a whole. One-fifth of those children were of Aboriginal or Torres Strait Islander descent. Several suburban areas had young populations with high proportions of children younger than fifteen years. Yarrabah, for example, had a median age of 20 years.
Most mothers of young children in the CfC site spoke English as a first language. At less than five per cent, the site's level of unemployment is lower than average and significantly lower than in surrounding areas like Cairns City, where unemployment was 13% in 2005.
However, many families had low incomes. In 2001, one-fifth of children aged 0-5 were living in families earning less than $500 per week. More than eight per cent of households in the Cairns CfC site had no motor vehicle.
Several CDs within the CfC site had SEIFA scores below the mean of 1000 and thus reflect a relatively high level of disadvantage in the area. Scores went as low as 872.
The Cairns site was in the third CfC wave. Mission Australia is the Facilitating Partner. Activities carried out under CfC include parenting and family support programs, early learning and literacy programs, child nutrition, social and communication skills, and community events.
Preliminary analysis of the snapshot survey indicates that early years services in the Cairns site have a moderate level of day-to-day coordination and moderately effective partnerships.
Frankston North
Frankston is a seaside town on the outskirts of Melbourne with areas of high socio-economic disadvantage. The Frankston North CfC site includes the suburbs Frankston North, Carrum Downs and Karingal. It is mostly residential, but contains large retail and light industrial areas. Of the 110 000 people living in the site in 2001, 8.3% were children aged 0-5 (Australia 7.6%). Most residents speak English as the main language. Lack of social connections and support for parents, lack of local facilities, poor take-up of ante- and post-natal care, and poor access to public transport are key issues in the site.
The CfC site encompasses a wide socio-economic spectrum, ranging from relatively advantaged to fairly disadvantaged. While parts of Carrum Downs had SEIFA scores above the mean of 1000, the score in the suburb Frankston North was as low as 812. Furthermore, 38% of children aged 0-5 in Frankston North lived in low income families with gross weekly incomes of $500 or less, compared to 20% of children in the CfC site as a whole.
Frankston North is in the second CfC wave. Anglicare is the Facilitating Partner. In addition to the CCC, Anglicare has established locality groups in the three suburbs of the site. These groups give local service agencies and community members - who for the most part did not want to join the CCC - the opportunity to work together and provide input into CfC. The FP also participates in a local early years network that was established previously under the state-funded Best Start initiative. This network provides policy direction for several early years services and programs operating in the community, including CfC.
The main CfC initiatives are: setting up networks of local service agencies and community members in the three suburbs of the CfC site, establishing local venues where activities are offered to children and families, improving ante- and post-natal support, providing school transition programs, and offering professional development support for service providers.
Preliminary analysis of the snapshot survey indicates that early years services in the Frankston North site seem to have a moderate level of day-to-day coordination and highly effective partnerships.
Inala/Ipswich
The Inala-Ipswich CfC site is located on the south-western outskirts of Brisbane, and is split between two local government areas and two Regional Districts. It encompasses the localities of Inala, Durack, Richlands, Carole Park, Wacol, Gailes and Goodna, an area fragmented by motorways and industrial thoroughfares. Several suburbs are isolated from one another, contributing to uneven provision of services across the site.
In 2001, of the 63 000 people living in the CfC site 10.3% were children aged 0-5. Three years later, this proportion had declined to 8.7%, despite an increase in the overall number of residents. There is a high level of cultural diversity in the area, with the most significant populations being Aboriginal and Torres Strait Islanders, Vietnamese and Pacific Islanders. Only 58% of young children in the site had mothers who spoke English as a first language.
The site has a high level of relative disadvantage. While all CDs in the area had SEIFA scores below the mean of 1000 in 2001, scores were particularly low in Carole Park (658), Inala (718) and Gailes (789).
Despite high employment rates among parents of young children in Inala-Ipswich, many families had low incomes. In 2001, almost one-third of children aged 0-5 lived in families with gross weekly incomes under $500. An even higher proportion of Indigenous children (42.5%) lived in low-income families. Almost one-third of children aged 0-5 lived in lone parent families, and of all the households in the site, 17% did not own motor vehicles.
According to the Community Strategic Plan prepared by the FP, almost half the housing in parts of Inala and Carole Park, and 20% of housing in other areas of the site, is public housing (compared to 4.1% in Brisbane and 3.5% in Queensland).
Inala was in the second wave of CfC funding. Mission Australia is the Facilitating Partner. There is broad representation on the CCC and members can access information and provide feedback via the communication network, as people's ability to attend meetings varies during the year.
The CfC initiative includes the Regional Early Years Network and Child/Parent Friendly Map project, a regional reading campaign Let's Read, an Active Children Campaign, Integrated Parent Education Initiative, Community Gardens, the Community Nutrition Initiative and the Social Skills Resource Initiative. There were also three new projects in the EOI stage: the Indigenous and Torres Strait Islander Early Years Project and Early Childhood Partnership project and the Building Bridges Project.
Preliminary analysis of the snapshot survey indicates that early years services in the Inala-Ipswich site seem to have a moderate level of day-to-day coordination and highly effective partnerships.
Launceston
The Launceston CfC site incorporates Launceston, the second-largest city in Tasmania, and extends up the Tamar Valley to George Town on the island's North Coast. Remote public housing estates with low resident mobility, high unemployment, poor public transport and a seasonal labour market in the north are key issues for the site.
Between 2001 and 2004, the proportion of young children in the area rose from 7.1% to 9.2% of the population. Few residents are from non-English speaking backgrounds.
In 2001, the site had a relatively high level of disadvantage. Most CDs in the site had SEIFA scores between 800 and 985. In Ravenswood, SEIFA scores were as low as 557.
Areas within the CfC site have mixed unemployment rates, ranging from 3.8 to 8.3 per cent. Across the site, 44% of children aged 0-5 live in families where the gross weekly income is less than $500. Economic and social problems are particularly pronounced in Ravenswood, where 58% of young children live in low-income families and half the children live in lone parent families.
In 2001, 14.5% of households in the entire CfC area had no vehicle. However, access to vehicles was not evenly spread throughout the site. All households in Dilston reported having a car, while almost a quarter of households in Invermay and Mayfield had none.
Launceston is in the second CfC wave. Anglicare Tasmania is the Facilitating Partner. Initiatives include parent support groups, mobile kinder gym, pre-natal support for very young mothers, playgroups, the development of social hubs where CfC and other services are provided, the development and strengthening of an early childhood interagency, and specific supports to parents in remote areas, parents with a disability and parents with children with autism.
Preliminary analysis of the snapshot survey indicates that early years services in the Launceston site seem to have a very high level of day-to-day coordination and very highly effective partnerships. Due to the very small number of respondents for this site, data from this area should be interpreted with caution.
Miller
The Miller CfC site is a primarily residential area located in Liverpool, a rapid growth area in Sydney's south-western suburbs. The site is comprised of four localities: Cartwright, Green Valley, Miller and Sadleir. Much development took place in the 1960s as part of the Green Valley public housing area.
In the decade to 2001, Liverpool's population grew more than anywhere else in NSW. Rapid population growth is predicted to continue as the area has a high birth rate and attracts large numbers of migrants. Liverpool is one of Sydney's most culturally diverse areas, and 14% of young children in the CfC site have mothers who do not speak English well.
Of the 20 000 people living in the CfC site in 2001, just under 11% were children aged 0-5, compared to 7.6% across Australia. Almost a quarter of young children in the site lived in low-income families. Fourteen per cent of households did not have a motor vehicle. This figure was much higher in certain parts of the site, with 25% of households in Miller and 29% in Cartwright. According to the FP, public transport in the area is also inadequate.
One Collection District in the site - in Green Valley - had a SEIFA score above the mean of 1000. Other parts of the site and parts of Miller had SEIFA scores as low as 556.
Miller is in the first CfC wave. Mission Australia is the Facilitating Partner, and the CCC is the major and only permanent committee of CfC.
Main CfC initiatives are child and family centres on school grounds offering parenting support, playgroups and other services; a speech therapist visiting playgroups and homes to access hard-to-reach families and provide preventative services; and mobile playgroups.
Preliminary analysis of the snapshot survey indicates that early years services in the Miller site seem to have a moderate level of day-to-day coordination and highly effective partnerships. Due to the very small number of respondents for this site, data from this area should be interpreted with caution.
Mirrabooka
The Mirrabooka CfC site is also known as the Northern Metropolitan Region of Perth, covering the suburbs of Girrawheen and Koondoola, and parts of Balga and Mirrabooka. The site is split between Stirling and Wanneroo, two local government areas that historically have not taken a joint approach to community development. This has resulted in uneven and often inadequate service provision across the site. The FP identified a lack of culturally sensitive services, low awareness of currently available services and inadequate parenting skills as key issues in the site.
In 2001, there were 30 000 people living in the site, 10% of whom were children aged 0-5. The site also has sizable Indigenous and CALD populations.
None of the Collection Districts in the site had SEIFA rankings above the mean of 1000 in 2001. Disadvantage was highest in parts of Girrawheen, with a SEIFA score of 775.
In 2001, 44% of children aged 0-5 lived in families whose gross weekly income was less than $500. The proportion was even higher in Girrawheen, where almost half of young children lived in low-income families. Girrawheen also had the highest proportion of children living in families with at least one parent unemployed (19%), and of children living in lone parent families (37%).
In 2004-05, just over a quarter of children in the area scored below the Australian Early Development Index cut off in one or more life domain, and were thus classified as vulnerable.
Mirrabooka is in the first CfC wave. The Smith Family is the Facilitating Partner. A broad range of key stakeholders are represented on the CCC. The main committee has recently split into two groups covering both the strategic and operational implementation of the CfC.
The main CfC interventions include: Peer Led Breastfeeding, the Community Parks Program, Literacy Links, Pathways Supported Playgroups, Teen Parenting, Families and Schools Together and the Community Activity fund.
Preliminary analysis of the snapshot survey indicates that early years services in the Mirrabooka site seem to have a moderate level of day-to-day coordination and highly effective partnerships.
Palmerston/Tiwi Islands
This CfC site is comprised of two very different locations. Palmerston is a settlement 25 kilometres from Darwin with a population of 21 000. Sixteen per cent of these are members of the defence force and their families, and the city has a transient population. In recent years, Palmerston has undergone rapid population growth, which is still continuing. However, adequate infrastructure for the new population has not been provided. According to the Community Strategic Plan, there is a severe shortage of medical services in the area, with access to antenatal services a particular problem.
The Tiwi Islands - Bathurst and Melville Island - are situated 80 kilometres northwest of Darwin in the Timor Sea. They had a total population of 2243 in 2001, and their four communities - Nguiu, Milikapiti, Pirlangimpi and Rangku - are predominantly Indigenous. Travel to the islands and between their communities is time-consuming and expensive. This remoteness and inaccessibility has meant that many people do not have access to mainstream services.
The population of young children in the site more than doubled in the ten years to 2001, when they made up 14% of the total population. Just under a quarter of all young children were Indigenous. The proportion of migrants varied from a very low 1.25% in the Tiwi Islands to 25% in the Palmerston suburb of Gray. All mothers of young children could speak English.
Social and economic indicators differ markedly between the two parts of the CfC site. While Palmerston had very low unemployment rates - between 1.2% and 4% in 2005 - the unemployment rate in the Tiwi Islands was 16.3%. Poverty was distributed in the same way. In 2001, one-fifth of young children in the entire CfC site lived in families with gross weekly incomes of $500 or less, but 59% of young children on the Tiwi Islands. SEIFA scores are lowest on the islands, with 657 and 678.
Palmerston was in the second CfC wave. The Red Cross is the Facilitating Partner. In addition to the CfC Committee, the site has set up a Tiwi Islands service-provider network. Main projects under CfC are the development of ante and post natal support networks, parenting programs, a future parents program, development of information packs for new parents, and connecting families to services.
Preliminary analysis of the snapshot survey indicates that early years services in the Palmerston-Tiwi Islands site seem to have a high level of day-to-day coordination and highly effective partnerships. Due to the very small number of respondents for this site, data from this area should be interpreted with caution.
Salisbury
The Salisbury CfC site is located in the eastern part of the City of Salisbury, 25 kilometres north of Adelaide. The site is almost entirely residential, apart from a small industrial area in Pooraka, and includes the suburbs of Ingle Farm, Para Hills, Para Hills West, Pooraka, and Salisbury East. The FP identified insufficient childcare services as a key issue for the site. Inadequate public transport and lack of knowledge of currently available services were considered barriers to service access.
There were 54,000 people living in the site in 2001. In recent years the proportion of young children had declined to 7.3% in 2004, which was slightly below the national average of 7.6%. While one-third of the residents were born outside Australia, most could speak English.
There was a fairly low level of relative disadvantage in the area, with one-fifth of the Collection Districts (CD) in the site achieved SEIFA scores above the mean in 2001. There were, however, some pockets of relative disadvantage in Para Hills West and Ingle Farm with SEIFA scores below 830.
In 2001, 18% of all children aged 0-5 in the site lived in lone parent households, but 40% of Indigenous children lived with a lone parent. Just under a quarter of young children lived in families with gross weekly incomes of $500 or less, but 36% of Indigenous children. Geographically, low-income families were fairly evenly distributed, making up between 21% of families in Para Hills West and 29% in Pooraka and Para Hills. In 2005, unemployment rates across the site ranged from 4.8% to 5.8%.
Salisbury is in the second CfC wave. The Salvation Army is the Facilitating Partner. At the time of visiting, some CfC projects were already in place and others were being implemented. Projects include a Family Zone Hub which incorporates CfC and other early childhood services in one site, parent support groups, mobile supported playgroups targeting specific groups and issues (e.g. Vietnamese community and literacy, Sudanese community and trauma), home visiting service, mobile crèche and a community play area project with local council. An early childhood literacy program was under development.
Preliminary analysis of the snapshot survey indicates that early years services in the Salisbury site seem to have a moderate level of day-to-day coordination and moderately effective partnerships.
Shellharbour
Shellharbour City is a large, rapidly growing area on the NSW coast, about 100 km south of Sydney. It includes the suburbs of Albion Park, Albion Park Rail, Balarang, Blackbutt, Calderwood, Croom, Dunmore, Flinders, Oak Flats, Shell Cove, Shellharbour City Centre, Shellharbour Square, Tongarra, Tullimbar and Yellow Rock. The Princes Highway cuts through the middle of the city, and large-scale development is taking place on both sides of the road. The population currently exceeds 60 000 and is projected to grow to 75 000 by 2010. Key issues in the site are affordable healthcare and childcare, access to support and assessment services, and public transport.
Although the number of children in the area has been growing steadily for more than fifteen years, this has been outstripped by growth in the general population. Children aged five and under were estimated to make up 8.8% of the residents in 2004. Most people in the site, including mothers of children aged 0-5, speak English as a first language.
In 2001, the SEIFA score for Shellharbour was slightly below the mean at 954, indicating a slight relative disadvantage. Although the unemployment rate in the site fell from 8.1% in September 2004 to 6.4% a year later, it remained higher than the national average of 5.1%. In 2001, 19% of children 0-5 lived in families with gross weekly incomes of less than $500. Of all families with young children in the site, 18% were lone parent families.
Shellharbour is in the third CfC wave. Barnardos is the Facilitating Partner. At this early stage in the initiative the CCC gives direction to the planning process and consists of a broad range of key local stakeholders. A main focus of CfC in this site is providing accessible information to families. The proposed CfC initiatives include: a website, the Learning and Development Project, Players in the Midst, a Breastfeeding program, the Breakfast Program, Talking Realities and a Children's Festival.
Preliminary analysis of the snapshot survey indicates that early years services in the Shellharbour site seem to have a moderate level of day-to-day coordination and highly effective partnerships.
Appendix C: Interview schedules
Interview schedule - general
- What is your role here / what type of work do you do?
- What do you think are the highest priority needs for children aged 0-5 and their families in this site?
- How effectively are those needs being met at the moment by different agencies?
- What kind of involvement do you have with Communities for Children?
- What does Communities for Children do in this site?
- What impact do you think Communities for Children is having here?
- In what ways is Communities for Children working well in this site?
- service provision
- service coordination
- integration with other government programs
- What do you think is helping Communities for Children to work well?
- What aspects of Communities for Children do you think are not working as well as they could?
- service provision
- service coordination
- integration with other government programs
- What are the major barriers for CfC to be working more effectively?
- What is the likely longer-term impact of CfC on this site?
- If you could change one thing about CfC, what would it be?
- Any other comments?
Interview schedule - STOs
- What is the role of an STO? What kind of involvement do you have with the Communities for Children programs in your state?
- Are you aware of anything that Communities for Children is doing, or plans to do in these areas?
- What impact do you think Communities for Children is having? / In what ways is Communities for Children working well?
- service provision
- service coordination
- integration with other government programs
- What do you think is helping Communities for Children to work well?
- internal
- external
- What aspects of Communities for Children do you think are not working as well as they could?
- service provision
- service coordination
- integration with other government programs
- Are you aware of any barriers to Communities for Children working well in this area? What are some of these barriers?
- What is the likely longer-term impact of CfC on this site? Impact across the state?
- If you could change one thing about CfC, what would it be?
- Any other comments?
Last updated: