Working with ministerial offices
Departmental Liaison Officers
A Departmental Liaison Officer (DLO) is a public servant who is temporarily placed in a minister's office (MO). They act as a conduit between their department and the MO.
Information on the allocation of our DLOs to portfolio minist1
rs is provided in the table below. This information is updated twice a year.
Correct as at 30 September 2025.
| Minister | DLO allocation and classification |
|---|---|
| The Hon Tanya Plibersek MP | Two (2): 1x EL2, 1x EL1 |
| The Hon Ged Kearney MP | One (1): APS6 |
Ministerial briefs and correspondence
We routinely provide briefings to our ministers and assistant ministers.
The table below shows the number of briefings provided to ministers or assistant ministers.
| 2020–21 | 2021–22 | 2022–23 | 2023–24 | 2024–25 | 2025–26 (to 30/09/25) | |
|---|---|---|---|---|---|---|
| Total sent to MO /AMO | 1,642 | 1,197 | 1,792 | 1,963 | 1,598 | 410 |
The table below shows the number of correspondence sent for minister or assistant minister signature.
| 2020–21 | 2021–22 | 2022–23 | 2023–24 | 2024–25 | 2025–26 (to 30/09/25) | |
|---|---|---|---|---|---|---|
| Total sent to MO/AMO | 1,259 | 1,024 | 2,023 | 1,201 | 1,080 | 336 |
The Domestic, Family and Sexual Violence Commission provided 57 briefs to portfolio ministers and assistant ministers between 29 September 2022 and 30 September 2025.
The National Commission for Aboriginal and Torres Strait Islander Children and Young People provided 5 briefs to portfolio ministers and assistant ministers between 13 January 2025 and 30 September 2025.
Interdepartmental committees, taskforces, reviews and entities
Interdepartmental committees
An Interdepartmental Committee (IDC) is a common governance body for cross-agency taskforces. An IDC is where officials from representative agencies may discuss work and provide input on deliverables.
The Department of Social Services and its portfolio agencies are regularly involved in the work of IDCs. We participate in IDCs that are led by the following departments/agencies:
- Department of the Prime Minister and Cabinet
- Department of Finance
- The Treasury
- Department of Health, Disability and Ageing
- Department of Agriculture, Fisheries and Forestry
- National Indigenous Australians Agency
- Attorney General’s Department
- Department of Education
- Department of Foreign Affairs and Trade
- Australian Institute of Health and Welfare
- Department of Infrastructure, Transport, Regional Development, Communications, Sport and the Arts
- Australian Taxation Office
- Department of Employment and Workplace Relations
- Department of Home Affairs
- National Disability Insurance Agency
- Australian Bureau of Statistics
- Digital Transformation Agency
- Department of Industry, Science and Resources
- Services Australia
Some examples of IDC topics include:
- Australian Public Service reforms
- Closing the Gap
- health and wellbeing
- aged care
- people with disability
- gender equality
- education
- employment and early childhood
- children and young people
- seniors
- families
- communities
- income management
- housing
- migration
- regional development
- international relations
- finance
- privacy
- integrity
- regulation
- economic
- productivity
- resilience and emergency management
- expatriate adoption
- grants management
- artificial intelligence.
By their nature, IDCs can be established and conclude their work rapidly as the need arises.
Taskforces
Taskforces are a method of doing business across the Australian Public Service (APS), including in the department. We regularly establish taskforces to meet emerging or high profile government priorities. Some are short term (3 to 6 months), some longer (one to 3 years). All taskforces require dedicated focus, varying timescales, set-up and delivery resourcing and effort from many parts of the department and more broadly across the APS.
We, and our portfolio agencies, are regularly involved in the work of a range of taskforces.
Reviews
We are also involved in reviews. Our current reviews, as 28 October 2025, are:
- Review of Carer Payments and Supports
- Transition to Independent Living Allowance (TILA) Review
- Review of jurisdictions’ implementation of the Aboriginal and Torres Strait Islander Child Placement Principle
- Implementation Review for Safe and Supported: The National Framework for Protecting Australia’s Children 2021-2031 (Safe and Supported)
- Evaluation of the Paid Parental Leave (PPL) Scheme – Phase 2
- Evaluation of the Community-Led Sexual Violence Prevention Pilot (also known as the Partners in Prevention of Sexual Violence Project)
- National Model of Care
- Evaluation of the Improving Multidisciplinary Response Program
- Joint Evaluation of Family and Relationship Services (FaRS) and Specialised Family Violence Services (SFVS)
- Evaluation of the Child and Family Intensive Support Services (CaFIS)
- Evaluation of the Support for Trafficked People Program (STPP) and the Additional Referral Pathway (ARP) pilot
- Independent evaluation of the Home Interaction Program for Parents and Youngsters (HIPPY)
- Strategic Review of Governance
- Evaluation of the National Consumer Protection Framework for online wagering (SCPF)
- Be Connected Program Evaluation 2025-2027
- Refresh of the National Out-of-Home Care Standards
- Evaluation of the Investment Strategy – Innovation Fund Grant Opportunity
- Evaluation of the Strong and Resilient Communities (SARC) Activity.
The department’s reviews which were completed and released between 1 July 2022 and 28 October 2025, are:
- Volunteer Management Activity Post Implementation Review (PIR) - released on 14 October 2022
- Random Sample Survey (RSS) Methodology Review Implementation(Opens external website) - released on 30 June 2023
- Review of the Impact of the Cashless Debit Card (CDC) Transition by the University of Adelaide - released in May 2024
- Carer payments assessment process(Opens external website) – released in February 2025
- Review of child, youth and parenting programs under the Families and Children (FaC) Activity(Opens external website) - released on 19 November 2024.
Entities
Since 1 July 2022, the following new entities including advisory boards and agencies have been wound up, amalgamated, ceased, disbanded, or reconstituted as new bodies:
- Prime Minister’s Community Business Partnership - ceased in October 2022
- Financial Counselling Industry Funding Advisory Group - ceased 30 June 2023
- Early Years Strategy Advisory Panel – ceased 7 June 2024
- National Autism Strategy Oversight Council – ceased 14 August 2024
- National Coordination Group – ceased 30 June 2025
Since 1 July 2024, the following new entities including advisory boards and agencies were created:
- National Commission for Aboriginal and Torres Strait Islander Children and Young People (entity) – commenced operations on 13 January 2025
- Domestic Family and Sexual Violence Sector Strengthening Plan (SSP) Working Group – commenced operations on 28 August 2025.
Committees, panels and groups
Our committees, panels, and groups provide ways for people and organisations to help us develop policies and provide advice on specific issues.
- Aboriginal and Torres Strait Islander Leadership Group
The Leadership Group shares decisions with all Australian governments in implementing Safe and Supported: the National Framework for Protecting Australia’s Children 2021-2031. - Blueprint Expert Advisory Group (BERG)
An advisory group established to create a sector led not for profit Blueprint to provide the not for profit and charities sector with support and strategic direction. - Child Support Expert Panel
An expert panel established to support the Department to commission updated costs of children and related research, to review the child support formula’s Costs of the Children Table. - Child Support Stakeholder Consultation Group
An advisory group to Government on the Child Support Scheme to help achieve better outcomes for separated and separating families. - Community Services Advisory Group
A key community sector stakeholder engagement group on issues relating to the department’s policies and programs. - Economic Inclusion Advisory Committee
Provides independent advice to Government before each Budget on economic inclusion and tackling disadvantage. - Intercountry Adoption Authorities
The department performs the duties of the Australian Central Authority under the Hague Convention. There is also a central authority for each state and territory. Responsibility for intercountry adoption is shared across these central authorities. - National Leadership Group
A cross-sector advisory body that supports the implementation of the Stronger Places, Stronger People initiative. - Parents and Carers Reference Group
Provides parents and carers with the opportunity to share their experience and knowledge to help inform policy, programs and services for families. - Partnership Priorities Committee
Helps steer better policy and delivery outcomes by embedding partnerships and co‑design.
Operational matters
Official hospitality expenditure
Official hospitality involves the use of public resources to provide hospitality, including food, drink, and/or entertainment, to persons other than departmental officials for the purpose of achieving government objectives. This includes:
- Tier 1 events such as receptions, functions and sit-down meals with defined guest lists and formal catering arrangements.
- Tier 2 activities such as light refreshments provided at business meetings and other work-level engagements involving external parties.
The approximate cost of official hospitality including both Tier 1 and Tier 2 was:
- 1 July 2024 to 30 June 2025: $281,746
- 1 July 2025 to 30 September 2025: $13,664.48
The table below reports Tier 1 official hospitality events hosted by Portfolio Ministers and the Department.
Official Hospitality Events from 1 July 2025 to 30 September 2025
There were no Tier 1 official hospitality events hosted during this reporting period.
Official hospitality events from 1 July 2024 to 30 June 2025
| Events Hosted by | Number of events | Total event cost* GST Exclusive | Approximate number of attendees | Alcohol provided Yes or No | Entertainment provided Yes or No |
|---|---|---|---|---|---|
| Ministers | 2 | $1,414.55 | 16 | No | No |
| DSS | 4 | $20,414.24 | 74 | No | No |
| Total | 6 | $21,828.79 | 90 |
* The total event cost includes expenditure for catering, venue hire, audio-video and other expenses relating to an event.
Department leadership forums
We regularly hold in-person executive forums to build capability in our leadership. These are for both senior leadership staff (including SES and state managers), and for Executive Level 2 staff. In-person forums are usually 5 to 6 hours long and involve catering for morning tea and lunch (buffet-style of salads, sandwiches/wraps and a hot food option). Participants are encouraged to attend in-person, with an online option also available for those unable to attend.
2025 (as at 30 September 2025)
Executive Level 2 forums
| Date, venue and approximate attendance | Key topics and external speakers |
|---|---|
17 March 2025 (9:30 am to 3 pm) Canberra Southern Cross Club Woden Approximate attendance: 306 | Networking, capability review, Q and A with Secretary and Deputy Secretaries, Caretaker Period, Using Data and wellbeing through change. External speakers: nil |
Senior Leadership Forums
| Date, venue and approximate attendance | Key topics and external speakers |
|---|---|
5 March 2025 (9:30 am to 3 pm) Enid Lyons Building, Greenway Approximate attendance: 90 | Capability review, Q and A with Secretary and Deputy Secretaries, Caretaker Period External speakers: Acting Deputy Secretary, Health Strategy, First Nations and Sport, Department of Health and Aged Care |
2024
Executive Level 2 forums
| Date, venue and approximate attendance | Key topics and external speakers |
|---|---|
Date: 20 March 2024 (9:30 am to 3 pm) Venue: Hellenic Club, Woden ACT Approximate attendance: 250 | Key topics: Secretary’s address, address from Australian Institute of Family Studies (AIFS), fraud, flexible working, evaluation expectations, Department of Social Services website upgrade, Q and A with deputy secretaries, corporate update. External speakers: Acting Director, Australian Institute of Family Studies |
Date: 25 July 2024 (9:30 am to 3 pm) Venue: Canberra Southern Cross Club, Woden ACT Approximate attendance: 290 | Key topics: address from the Australian Public Service Commission (APSC), campaigns update, Q and A with deputy secretaries, group activity on challenges for managers, presentation from National Anti-Corruption Commission (NACC), Department of Social Services website update. External speakers:
|
Date: 24 October 2024 (9:30 am – 3 pm) Venue: Canberra Southern Cross Club, Woden Approximate attendance: 280 | Key topics: Campaigns showcase, networking activity, bullying and harassment discussion, Q&A with senior leaders on managing through change, Engaging with Ministers’ offices, Secretary address. External speakers: Nil |
Senior leadership forums
| Date, venue and approximate attendance | Key topics and external speakers |
|---|---|
Date: 20 February 2024 (9:30 am to 3:30 pm) Venue: Hellenic Club, Woden ACT Approximate attendance: 80 | Key topics: Secretary’s address, leadership discussion, legal authority, Australian Institute of Family Studies discussion, corporate update (including flexible working). External speakers:
|
Date: Wednesday 19 June 2024 (9:30 am to 3:00 pm) Venue: Conference Suites, Enid Lyons Building ACT Approximate attendance: 80 | Key topics: Secretary’s review, leadership discussion, corporate update, Q and A with deputy secretaries. External speaker: Acting NDIS Quality and Safeguards Commissioner. |
Date: Thursday 19 September 2024 (9:30 am to 3:00 pm) Venue: Conference Suites, Enid Lyons Building ACT Approximate attendance: 95 | Key topics: Department of Social Services update, Social Residualisation project, disability reforms, Services Australia, group activity on briefing and Right to Disconnect. External speakers: CEO Services Australia |
2023
Executive Level 2 forums
| Date, venue and approximate attendance | Key topics and external speakers |
|---|---|
Date: 27 April 2023 (9:30 am to 2:30 pm) Venue: Hellenic Club, Woden ACT Approximate attendance: 250 people | Key topics: working with ministers’ offices, media management, integrity culture, Q and A sessions with the Secretary and deputy secretaries, Australia’s Disability Strategy in depth and a corporate update. External speakers: nil |
Date: 12 October 2023 (9:30 am to 2:30 pm) Venue: Hellenic Club, Woden ACT Approximate attendance: 250 people | Key topics: Secretary’s address, Q and A with deputy secretaries, APS reform, performance management, DLO role and corporate update External speakers: APS Reform Office |
Senior leadership forums
| Date, venue and approximate attendance | Key topics and external speakers |
|---|---|
Date: 16 March 2023 (9:30 am to 2:30 pm) Venue: Southern Cross Club, Woden ACT Approximate attendance: 80 | Key topics: Secretary’s address, Closing the Gap update, Staff Engagement Action Plan, National Anti-Corruption Commission (NACC) update, Early Years Strategy, Q and A with deputy secretaries, and corporate update. External speakers: Fraud Prevention and Anti-Corruption, Attorney-General’s Department. |
Date: 27 July 2023 (9:30 am to 2:30 pm) Venue: Southern Cross Club, Woden ACT Approximate attendance: 80 | Key topics: Secretary’s address, working with the minister’s office, stakeholder engagement, Robodebt discussion, Q and A with the Secretary and deputy secretaries. External speakers: Chief of Staff to Minister Rishworth |
Date: 7 December 2023 (2 pm to 5 pm) Venue: DSS conference suites, Enid Lyons Building Approximate attendance: 80 | Key topics: Disability Royal Commission in depth, systems thinking, Secretary’s address and Q and A. External speakers: Associate Professor, Macquarie University |
Community Grants Hub Forums
A series of staff training and development forums were held for Health Grants Branch (HGB) staff in the Community Grants Hub. The forums focussed on various programs and work areas as follows:
- Aged Care Forum – 1 to 2 October 2024
- Indigenous Health and First Nations Forum – 16 to 17 October 2024
- Business Improvement, Processing and Enabling Teams Forum – 30 to 31 October 2024
- Client Grant Branch Forum – 1 to 2 April 2025
Itemised list of catering costs is detailed in table below
| Forum | External Speakers | Catering Cost |
|---|---|---|
First Nations Forum 16 to 17 October 2024 | Deputy Secretary for Health Strategy, First Nations Sport in the Department of Health and Aged Care – Department of Health and Aged Care Cultural Competency – First Nations Engagement Principles – CEO Carbal Medical Services, an Indigenous provider in QLD Representatives from First Nations Health, Department of Health and Aged Care | $10,022.73 excludes GST $11,025 includes GST |
Aged Care Forum 1 to 2 October 2024 | Deputy Secretary, Ageing and Aged Care, Department of Health and Aged Care Assistant Secretary, Home Support Operations Assistant Secretary, Systems Strategy and Network Support Branch Assistant Secretary, Dementia, Diversity and Design Branch Representatives from Legislative Reform Branch, Department of Health and Aged Care | $17,977.27 excludes GST $19,775 includes GST |
Business Improvement Processing and Enabling Teams 30 to 31 October 2024 | Assistant Secretary and Directors, Department of Health and Aged Care, Grants Branch Coach and Facilitator, Yellow Edge (Shaping Human Potential) | $9,545.46 excludes GST $10,500 includes GST |
Client Grants Branch Forum 1 to 2 April 2025
| Department of Home Affairs - Chief Risk Officer Royal Flying Doctor Service - Acting Chief Executive Officer
| $38,636.37 excludes GST $42,500 includes GST |
Travel
Our Official Travel Policy provides the overarching rules and principles for officials undertaking official travel, or organising official travel for others, including:
- Officials ensuring maximum value for money is achieved when booking travel. Value for money requires the use of Commonwealth resources in a proper (efficient, effective, economical and ethical) manner, and is enhanced through competition.
- When booking travel, officials making decisions based on an impartial consideration of the fares available and not on a personal preference for a particular airline or aircraft type, provision of access to airline lounges or accumulating airline status points.
- Official travel being undertaken where other communication tools, such as teleconferencing and videoconferencing, are an impractical option.
Travel expenses
The total travel expense for the department including Secretary and Deputy Secretary travel is:
- 1 July 2024 to 30 June 2025: $8.54 million.
- 1 July 2025 to 30 September 2025: $0.97 million.
The table below shows details of Secretary and Deputy Secretary travel.*
| Number of trips Jul 24-Jun 2025 | Total cost Jul 24-Jun 2025 | Number of trips Jul 25-Sept 2025 | Total cost Jul 25-Sept 2025 | |
|---|---|---|---|---|
| Secretary | 15 | $42,123.61*** | 5 | $5,272.52 |
| Deputy Secretary Social Security ** | 7 | $23,740.83*** | 4 | $3,650.32 |
| Deputy Secretary Families and Communities ** | 8 | $18,700.79 | 6 | $7,342.68 |
| Deputy Secretary Disability and Carers ** | 10 | $24,866.72*** | N/A | $N/A |
| Chief Operating Officer ** | 5 | $18,282.23*** | 1 | $1,731.62 |
| Deputy Secretary Delivery and Data** | 2 | $3,194.40 | 12 | $12,481.17 |
* Data is provided by the whole-of-government contract provider and at the time of publication may not include adjustments of trips (including amended travel dates, and late cancellations) in this reporting period. The data provided includes flights, ground transport and accommodation.
** Deputy Secretary positions reflect titles outlined on the department's organisation chart at the time of publication.
*** Includes international travel.
Facilities
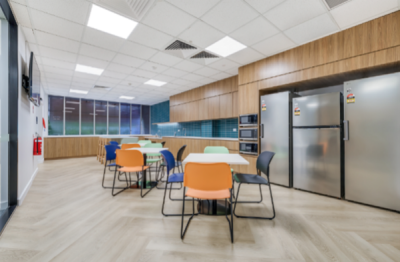
The department has a presence in each state and territory with approximately 3,600 work points.
Upgrades to our staff amenities (including SES offices) are managed in accordance with Commonwealth guidelines and policies, including the Commonwealth Procurement Rules(Opens external website).
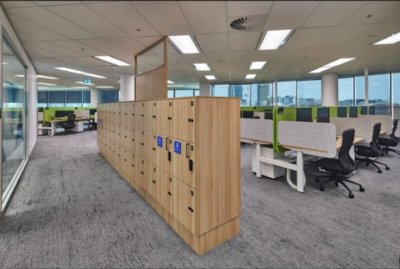
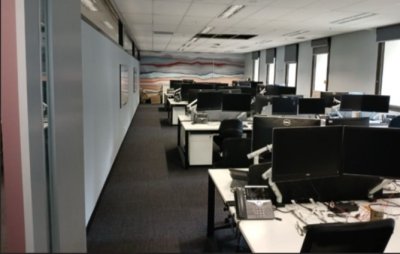
From 1 July 2023 to 30 September 2025, we had 9 contracts with a total value of $7,941,961 relating to upgrades to staff amenities as per table below. Our procurement contracts with a minimum contract value of $10,000 (GST inclusive) and above are reported on the AusTender website(Opens external website).
The table below shows costs and details of upgrades to staff amenities.
| Location | Address | Description | Cost (GST inclusive) |
|---|---|---|---|
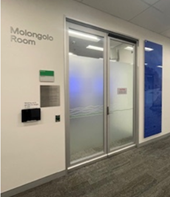
| Canberra | Enid Lyons Building, 71 Athllon Drive, Greenway ACT | Auto doors to conference room facilities | $67,507 |
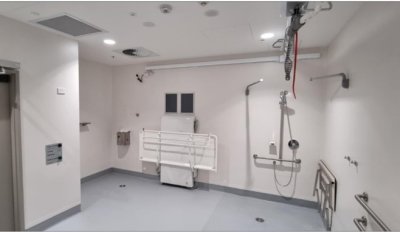
| Canberra | Enid Lyons Building, 71 Athllon Drive, Greenway ACT | Changing Places Facility | $311,093 |
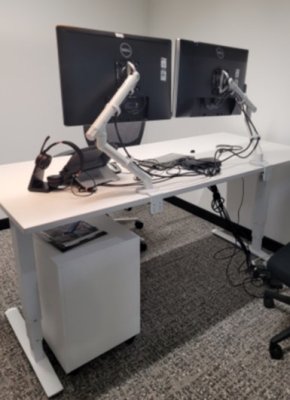
| Canberra | Enid Lyons Building, 71 Athllon Drive, Greenway ACT | Self-adjustable monitor arms | $1,166,558 |
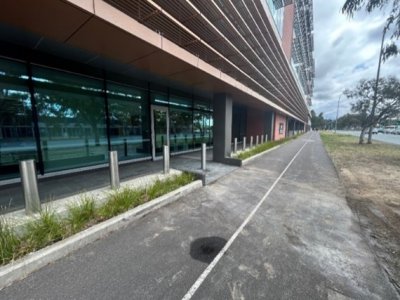
| Canberra | Enid Lyons Building, 71 Athllon Drive, Greenway ACT | Security bollards installation | $55,165 |
| Sydney | State Office – Tower B, Levels 8 and 9, 280 Elizabeth St, Surry Hills NSW | Accommodation – new fitout – level 8 | $2,983,722 |
| All offices | Task Chairs - re-stock | $131,845 | |
| Perth | State Office – Level 2, 45 St Georges Terrace, Perth WA | Accommodation - minor fit out | $216,496 |
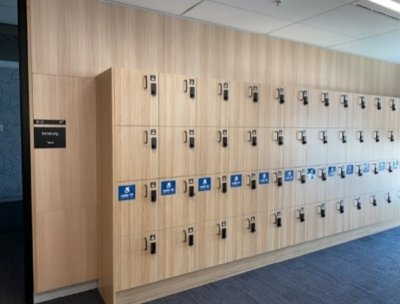
| Melbourne | State Office – Level 10 & Part Level 11, 180 Lonsdale St, Melbourne VIC | Additional lockers installed on level 10 | $41,212 |
| Darwin | Level 1, 43 The Mall Darwin NT | Accommodation - new fit out – level 1 | $2,968,362.60 |



Our people
We continue to invest in our people’s capability and grow the diversity of our workforce to support the government to deliver outcomes for all Australians.
Our employee data is reported on biannually, based on data as at the end of June and end of December, via the APS Employment Database(Opens external website) (APSED).
Our department operates in line with the Strategic Commissioning Framework. Core work is done in-house in most cases. Any outsourcing of core work is minimal and aligns with the circumstances permitted under the Strategic Commissioning Framework. We continue to work to meet the principle to have 10% or fewer of our workforce outsourced.
Learn more about the department’s organisational structure, including SES, on the organisational structure page.
As at 30 September 2025, the department’s workforce comprised of:
- 2,869 APS staff
- 211 contractors.
Of the 2,869 APS staff:
- 2,792 are ongoing
- 77 are non-ongoing.
We have 194 APS staff who identify as a person with disability (6.8% against the APS average of 5.5%*).
We have 136 APS Aboriginal and Torres Strait Islander staff who work for the department (4.7 % compared to the APS average of 3.4 %*).
* APS Employment Data 31 June 2025, published 25 September 2025.
The table below shows the Average Staffing Level (ASL), Full Time Employees (FTE) headcount and contractors as at 30 September 2025.
| 30-Sept-25 | 30-Jun-25 | 30-Jun-24 | 30-Jun-23 | |
|---|---|---|---|---|
| ASL budget | 2,905.2 | 2,917.8 | 2,894.1 | 2,428.5 |
| ASL actual | 2,773.3 | 3,340.0 | 2,835.7 | 2,624.5 |
| FTE | 2,674.1 | 3,325.3 | 3,134.1 | 2,572.2 |
| Headcount | 2,869 | 3,566 | 3,404 | 2,823 |
| Contractors | 220 | 259 | 266 | 386 |
| Contractor % | 7.1% | 6.8% | 7.2% | 12.0% |
ASL budget is reported in the Portfolio Budget Statements 2025-26 (pre-Machinery of Government changes)
The table below shows the staff headcount and diversity numbers by classification as at 30 September 2025.
| Classification* | Actual** | Indigenous | Disability | CALD*** |
|---|---|---|---|---|
| SES 1-3 | 79 | 5 | 7 | 5 |
| EL1-2 | 1,078 | 29 | 62 | 64 |
| APS1-6 | 1,669 | 99 | 121 | 96 |
| Graduates and trainees | 43 | 3 | 4 | 3 |
| Total | 2,869 | 136 | 194 | 168 |
* APS employees only.
** This includes staff in their acting role and the substantive who are on leave.
*** The department currently uses Non-English Speaking Background (NESB) data from the human resources (HR) system to determine Culturally and Linguistically Diverse (CALD) status.
Recruitment
We continue to have a consistent approach on recruitment, taking approximately 14 weeks to complete the advertising, shortlisting, interviewing, and onboarding processes. Although the number of jobs advertised in the past 12 months has decreased, the timeframe has remained the same.
During the period 1 September 2024 to 30 September 2025, the department has advertised a total of 103 vacancies, both ongoing and non-ongoing roles.
During the period 1 September 2024 to 30 September 2025, the department has engaged 340 ongoing employees and 81 non-ongoing employees (total 421).
The table below shows the number of ongoing and non-ongoing staff working full time or part time.
| Ongoing | Non-ongoing | ||
|---|---|---|---|
| Engaged full time | 309 | Engaged full time | 73 |
| Engaged part time | 31 | Engaged part time | 8 |
| Total | 340 | Total | 81 |
Of the 340 ongoing staff, 144 transferred to us from other APS agencies.
124 employees transferred at the same classification, 2 transferred at a lower classification and 18 employees commenced on promotion.
Flexible work arrangements as at 30 September 2025:
- 1,569 of our people have approved working away from the office arrangements, accounting for 54.2% of the workforce (ongoing and non-ongoing employees)
- 422 of our people worked on a part time employment arrangement
- 227 also accessed working away from the office arrangements
- 280 of our people accessed compressed hours
- 178 also accessed working away from office arrangements
- 528 of our people worked a pattern of hours outside of the standard hours
- 322 also accessed working away from the office arrangements
- 805 staff within ACT had a flexible work agreement in place, accounting for 44.8 % of all ACT staff (excluding non-APS contractors).
The table below shows a breakdown of employees working from home per fortnight.
| Number of days per fortnight | Number of employees | Percentage of workforce |
|---|---|---|
| One day a fortnight | 4 | 0.1% |
| 2 days a fortnight | 104 | 3.6% |
| 3 days a fortnight | 21 | 0.7% |
| 4 days a fortnight | 442 | 15.3% |
| 5 days a fortnight | 67 | 2.1% |
| 6 days a fortnight | 403 | 13.9% |
| 7 days a fortnight | 61 | 2.1% |
| 8 days a fortnight | 413 | 14.3% |
| 9 days a fortnight | 21 | 0.7% |
| 10 days a fortnight | 39 | 1.3% |
A total of 937 staff (excluded non-APS contractors) work 6 or more days per fortnight at home. The table below shows the APS classification for these staff.
| APS classification | Total number |
|---|---|
| APS3 | 1 |
| APS4 | 66 |
| APS5 | 301 |
| APS6 | 292 |
| EL1 | 219 |
| EL2 | 58 |
| SES BND 1 | 0 |
| Grand Total | 937 |
Work health and safety
We are committed to promoting and sustaining a robust safety and wellbeing culture. We value physical and psychological health, safety and wellbeing and promoting inclusivity.
From 1 July 2024 to 30 September 2025, 13 incidents were notified to Comcare.
Freedom of Information requests
We are subject to the Freedom of Information Act 1982(Opens external website) (Cth), including the requirement to publish information as part of the Information Publication Scheme (IPS).
Further detail about the information which has been released in response to an FOI request is available on our Freedom of Information Disclosure Log.
Advertising
The department's total expenditure on government approved information and advertising campaigns in financial year 2024–25 was $28,345,872 (GST exclusive). From 1 July 2025 to 30 September 2025, the department’s total expenditure was $97,558 (GST exclusive), as itemised in the table below.
| Campaign | Purpose | Expenditure 1 July 2024 – 30 June 2025 | Expenditure 1 July 2025 – 30 September 2025 |
|---|---|---|---|
| Consent | Reduce the incidence of sexual violence in Australia by improving community understanding and attitudes on consent and healthy sexual relationships. | $12,635,410 | $116,576 |
| Volunteering Awareness | Increase awareness, interest and consideration of volunteering opportunities among young people 15 to 18 years old. | $2,489,479 | $27 |
| Stop it at the Start | Increase awareness amongst adults of the new and negative influences impacting young people and their behaviours towards disrespect and violence against women. | $13,220,983 | -$19,045* |
| TOTAL | $28,345,872 | $97,558 |
* Reflects media buy credits processed since 1 July 2025.
Promotional merchandise
From 1 July 2024 to 30 June 2025, the Department of Social Services spent $8,500 (GST exclusive) on promotional merchandise.
From 1 July 2025 to 30 September 2025, the Department of Social Services’ spend on promotional merchandise was NIL.
Procurement activities
Our approach to procuring goods and services, including consultancies, is undertaken in accordance with the Public Governance Performance and Accountability Act 2013(Opens external website) (Cth) and the requirements of the Commonwealth Procurement Rules.
In 2024–25, we entered into 266 contracts with a total value of $557.9 million (GST inclusive). Further, between 1 July 2025 and 30 September 2025, we entered into 43 contracts with a total value of $74.2 million (GST inclusive). In accordance with the Commonwealth Procurement Rules, we publish all procurement contracts with a value greater than $10,000 (GST inclusive) on the AusTender website(Opens external website).
In 2024–25, we awarded 31 contracts to Indigenous businesses with a total value of $45.0 million (GST inclusive). Further, between 1 July 2025 and 30 September 2025, we awarded 3 contracts to Indigenous businesses with a total value of $0.03 million (GST inclusive).
Market Research
In 2023–24, we entered into 13 market research contracts with a total value of $2,866,696.60 (GST inclusive)
In 2024–25, we entered into 8 market research contracts with a total value of $2,345,418.69 (GST inclusive)
Further, between 1 July 2025 and 30 September 2025, we entered into 2 market research contracts with a total value of $1,038,302.10.
Use of consultants
In 2024–25, we entered into 49 contracts with a total value just over $16.6 million (GST inclusive). Further, between 1 July 2025 and 30 September 2025, we entered into 6 new consultancy contracts with total value of $1.7 million (GST inclusive).
We engage consultants:
- when there is a need for independent research and assessment
- when there is a need for specialised or professional skills
- where there are skills currently unavailable within the department.
In accordance with the Commonwealth Procurement Rules, details about our consultancy contracts with a contract value of $10,000 (GST inclusive) and above are reported on the AusTender website(Opens external website).
Paper usage
Our paper usage and its cost for the last 5 financial years:
| 2020–2021 | 2021–2022 | 2022–2023 | 2023–2024 | 2024–2025 | |
|---|---|---|---|---|---|
| Australian made spend | $61,603.98 | $28,610.45 | $26,415.31 | $348.46 | $0 |
| Overseas spend | $550.14 | $533.85 | $9,482.98 | $40,996.26 | $32,626.13 |
| Total spend | $62,154.12 | $29,144.30 | $35,898.29 | $41,344.72 | $32,626.13 |
| 2020–2021 | 2021–2022 | 2022–2023 | 2023–2024 | 2024–2025 | |
|---|---|---|---|---|---|
| Australian made reams | 11,369 | 4,989 | 4,511 | 34 | 0 |
| Overseas reams | 65 | 32 | 1,557 | 6,301 | 4,940 |
| Total reams | 11,434 | 5,021 | 6,068 | 6,335 | 4,940 |