The Estimated Costs of Children in Australian Families in 2005-06
Abstract
This report estimates the costs of children in Australia in 2005-06. Costs are defined as the additional expenditure that families with children incur, when compared to families with an equivalent living standard but without children. The data on which the estimates were based was the ABS 1998-99 Household Expenditure Survey.
The study found that the average costs of children in Australian families varied according to the age of the child, the income level of their parents, and the number of other children and adults in the family. Specifically, costs increased with children’s ages and the incomes of their families. Total child costs also increased for families as the number of children increased, although the average cost per child fell. While the dollar costs of children were found to rise in line with rising family incomes, they nonetheless fell when expressed as a proportion of family income (particularly for older children aged 13 and above).
Author note
Richard Percival is Associate Professor (Research) at the National Centre for Social and Economic Modelling (NATSEM), University of Canberra. Ann Harding is Professor of Applied Economics and Social Policy at the University of Canberra and the inaugural Director of NATSEM.
Acknowledgments
The authors would like to thank Patrick Parkinson for his helpful comments on an earlier version of this paper.
General caveat
NATSEM research findings are generally based on estimated characteristics of the population. Such estimates are usually derived from the application of microsimulation modelling techniques to microdata based on sample surveys.
These estimates may be different from the actual characteristics of the population because of sampling and nonsampling errors in the microdata and because of the assumptions underlying the modelling techniques. The microdata do not contain any information that enables identification of the individuals or families to which they refer.
1. Introduction
The Ministerial Task Force on Child Support has been asked to provide advice on whether changes to the Child Support Scheme (CSS) are warranted. As part of that process, the Task Force commissioned NATSEM to estimate the costs of children in Australia in 2005-06.
It must be appreciated that, as in so many areas of economics, there is not consensus about the best way to estimate the costs of children and any estimates can only be interpreted as providing a rough guide to the costs of children in Australia today. At least three different methods have been used in the past decade to estimate the costs of children in Australia. The basket of goods or budget standards approach involves specifying what is needed (in terms of the goods and services that contribute to material consumption) by particular households living in a particular place at a particular time in order to achieve a specified standard of living. After each item has been identified, it is then costed and summed, to arrive at the total budget required to reach the given standard. This method thus involves experts trying to identify what children need, rather than what parents actually spend on their children. Generally, the budget standards method appears to result in higher estimated costs of children than many other methods (Harding and Percival, 1999, p. 87). The budget standards approach has been used by Saunders (1999) and new estimates have been prepared for the Task Force using this methodology by Dr Paul Henman (Henman, 2005).
A second possible method is called the Extended Linear Expenditure System (ELES) — sometimes also known as the Barten-Gorman method. This method involves estimating a utility function and demand equations from a sample survey that contains details of the expenditures of families. The equations attempt to estimate how much parents actually spend on their children, and families with the same level of utility are assumed to be equally well-off. International research suggests that the estimates of the costs of children produced by this method tend to be relatively low, especially for third and fourth children. For example, some overseas studies using this method have found that four children cost their parents less than three children (Merz et al, 1993). An Australian study using the ELES methodology by Valenzuela also found that the marginal costs of the second and third child were quite low and concluded that parents devoted the same proportion of their income to their children, irrespective of whether they were rich or poor (1999).
This study uses a third possible approach, often termed the expenditure survey or equivalent standard of living approach. This method compares the household expenditure of a couple with children with that of a couple of the same age without children who have an equivalent standard of living. The difference in the expenditure of the two households represents the costs of the children. The precise details of the methodology are explained in more detail in Section 2 below. As McDonald explains, ‘this method indicates how much parents actually spend on their children, even though the amount spent might be considered inadequate or excessive by the objective standards of the basketof-goods method (1999, p 20). As spending on children is necessarily constrained by family income, ‘when we observe that a family has spent a certain amount on their children this may not be determined so much by some objective measure of how much children cost but rather by the amount that the family has available to spend on the children’ (McDonald, 1999, p 20).
As the above discussion makes clear, there is no single ‘right’ answer to the costs of children. Estimating the costs of children is inherently difficult, as many items of family expenditure are often shared among all family members or incurred indirectly by parents. In practice, it is also likely that there are wide variations in the amounts that parents spend on their children, both as family incomes vary and as the sense of what it is proper to spend varies.
The purpose of this study is to estimate the private costs of children in Australian one and two parent families and to compare them to selected public costs. In the study, the costs of children were taken to be money expenditures - that is, the amounts that parents actually spent on their children. Thus, the indirect costs of children - caused, for example, by mothers reducing their hours of paid labour force participation - were not taken into account in any way.
In Section 2 of the paper we outline the methodology used to estimate the direct costs of children. In Section 3 we present estimates of the direct costs of children in families with two co-resident parents and, in Section 4, in families with one parent. In Section 5, the study is summarised and concluded.
2. Methodology
2.1 Estimating the direct costs of children
The methodology used in this study to estimate the costs of children generally follows that developed by Espenshade (1984) and Betson (1990). Following Engel, they estimated the costs of parental expenditures on children in the United States (1984). This methodology was subsequently used by Lee (1988) to provide estimates of the costs of children in Australia in 1984.
Broadly, the methodology estimates the cost of a child as the difference in average expenditures between households, with similar numbers of adults, but where some have no children and some have one or more children present, given that the households enjoy an equivalent standard of living. A key question is therefore how to define an ‘equivalent standard of living’?
As Espenshade points out (1984, p. 19) the central problem in estimating the cost borne by parents in raising children is that it is difficult to separate the costs of each family member from the total costs of the household. In many instances these costs cannot be easily assigned to particular individuals (e.g., housing costs or electricity costs). As well, many expenditure items that are directly for children are simply recorded as expenditure items by their parents (e.g., food costs).
One solution to this problem is to use an index of the material standard of living of different families. Such an index allows families with the same standard of living to be compared, even though their family composition and incomes may differ. The problem, of course, is how to determine when families have a similar standard of living - i.e. how to construct such an index. Simply comparing incomes is not sufficient, as families with the same income may have widely differing demands placed on that income and, hence, differences in their standards of living.
Once it is possible to tell if differently constituted families have the same standard of living, it is reasonably straightforward to estimate the costs of their children. Suppose we follow Engel and assume, for example, that the proportion of total expenditure devoted to food is an adequate indicator of the standard of living of a family. Then consider two families, the first a couple with no children and a weekly expenditure of $500 and the second a couple with one child and a weekly expenditure of $600. If both spend 15 per cent of their total expenditure on food then the difference in their expenditures can be said to equal the cost of the child in the second family - i.e., $100 per week.
For the purposes of the study this comparison was generalised in the form of two equations. The first was used to estimate total household consumption expenditure, given information on parental incomes and the number (and ages) of the children and the number of adults. The second estimated household living standards, given information on household consumption expenditure and the number (and ages) of the children and the number of adults (see Appendix 1 for more details).
The methodology used in this study to calculate the cost of children relies on being able to determine when families of different sizes and with different incomes have similar living standards. In his earlier work on costs of children Espenshade examined several different methods that had been used to determine family living standards (1972, pp. 63-74). These included per capita income, level of adult expenditure, proportion of income saved and the proportion of income spent on food. After considering each, Espenshade concluded that the most appropriate measure to use was the proportion of family income spent on food (the so-called 'Engel estimator').
However, using the proportion of total expenditure devoted to food as the indicator of living standards has been the subject of extensive criticism. In particular, Deaton and Muellbauer (1986) argued that the Engel method is fundamentally incorrect in assuming that food share indicates the welfare level of households of different sizes (p. 741). They also argued that it can be theoretically shown that the Engel method will produce estimates higher than the 'true' cost of children.
Since the publication of the paper by Deaton and Muellbauer, the Engel approach has often been described as establishing an upper bound to child cost estimates. However, there are grounds for viewing this widely held assertion with some caution. In particular, as Bradbury points out, the argument that the Engel approach establishes an upper bound to child costs relies on the assumption that food constitutes a relatively high proportion of total child expenditures. However, as this would more typically be the case in developing countries (which are the focus of Deaton and Muellbauer’s analysis), in more developed countries such as Australia such a conclusion is less certain (Bradbury 1994, p. 2).
What is perhaps more likely to be correct is that an Engel estimator will overestimate the costs of larger families. This is because there are likely to be greater economies of scale present in a household's non-food consumption than there is in their food consumption.
A number of other indexes of standard of living have been proposed, including the level of total expenditure devoted to ‘adult goods’ (Rothbarth 1943). However, Bradbury has shown that, theoretically, this approach will most likely overestimate the cost of children (Bradbury 1997, p. 76)
Given this uncertainty in the literature, this study has used the general Espenshade approach. However, the estimator of comparable living standards used was a variation on the Engel method, with the food-at-home share estimator being expanded to include other basic expenditure items (such an estimator is sometimes referred to as an ISO-PROP estimator, following Watts 1977).
In this study, our indicator of the standard of living of a family is the proportion of total expenditure devoted to:
- food at home;
- fuel and power;
- household non-durables for use inside the home (eg. disposable nappies) ;
- postal, telephone and telegram charges; and
- personal care products and services (eg. shampoo).
Not included in either basket were the costs of housing, clothing and health. While these have often been included by other researchers when compiling a basket of basic goods (see, for example, Betson 1990; Merz and Faik 1992), their use is problematic.
Housing was not included as it has characteristics that set it apart from other essential expenditures. As a recent study (which did not include the costs of housing in any of several baskets of basic goods) noted, expenditure on housing is 'peculiar' (Carlucci and Zelli, 1998). What makes it peculiar is that it can differ markedly between households that are similar in every other aspect other than their tenure type. As well, in contrast to other 'basket ' items, the housing costs of many families, particularly those with children, tend to diminish across the life-cycle. That is, families with older children are much more likely to have lower relative housing costs, given that expenditure by home purchasers will, over time, be reduced by the effects of inflation and, as well, will increasingly go to paying off the capital component of their mortgage. For these reasons, it would seem that the inclusion of housing in the measure of living standards is likely to introduce significant distortions.
Clothing was excluded from the basic basket of goods because, in contrast to other basic expenditures, its share of total expenditure rose as household expenditure increased. This mirrors the finding of Carlucci and Zelli (1998) who categorised clothing as a 'comfort' good, rather than a 'necessity' good. (Some clothing is, of course, a necessity. However, it is also in many instances very much a luxury item. Unfortunately, when compared to food, it is more difficult to separate out what is basic expenditure on clothing from what is luxury expenditure. There would also appear to be more scope for wealthier households to increase their expenditure on clothing than there is to increase their expenditure on food, particularly that consumed at home.)
Finally, household expenditure on health was not included in the basic basket of goods, given the role played by the Medicare system in Australia to meet all or most of the basic components of these expenses.
Thus, to summarise, our indicator of the ‘standard of living’ was the proportion of total current expenditure devoted to a typical basket of goods, including food, personal care items, power costs and telephone charges. Where a couple only household and a couple household with two children had the same ‘standard of living’ using this measure, then the difference in the total spending of the two households was assumed to be the cost of the two children. This assessment of the ‘standard of living’ indicator should thus not be confused with the costs of the children. That is, we have not only estimated the food, power, and telephone costs associated with the children, but the total costs associated with the children. It is only when attempting to derive the comparable ‘standard of living’ indicator that we use the restricted basket of expenditure items outlined above.
2.2 Data source
The data source used in this study was the publicly released 1998-99 Household Expenditure Survey (HES) unit record file (ABS 2000). This Australian Bureau of Statistics (ABS) survey collected information on household expenditures, incomes and a wide range of other socio-economic characteristics. In total, 6892 confidentialised records were included in the publicly released file, representing some 7.1 million households.
However, for this study only households where the reference person or spouse was aged between 20 and 59 years and where there was either no other persons present or where there was one or more dependent children under 18 years of age were included. This age restriction for the adults was imposed to reduce any age-related effects that might be associated with families - those with and those without children - having different characteristics.
Also excluded from the analysis were households:
- whose principal source of income was from self-employment or reported as being from 'private sources' (eg. from interest or superannuation);
- with negative or zero consumption expenditure;
- with negative or zero income; and
- where the ratio of household total expenditure to household total income was greater than two.
The final data set thus defined contained 3340 records, representing some 3.234 million households.
One slight complication was that the age ranges in the original HES file did not exactly match with the age ranges required for this study, which were selected to conform with the current age ranges for Family Tax Benefit Part A and child support assessment. The relevant age ranges for FTB (A) are aged 0 to 12 years, aged 13 to 15 years, aged 16-17 years and aged 18 to 24 years. For child support assessment, it is to be less than 18 years of age. Age ranges in the HES are comparable except for children between the ages of 13 and 17 years, who are classified into the ranges 13 to 14 years and 15 to 17 years. To simulate the costs for children aged 13 to 15 years, we took 2/3 of the cost from the estimates for 13 to 14 year olds and 1/3 of the costs from 15 to 17 year olds. 16 to 17 year olds were held to have the same costs as 15 to 17 year olds. Given our earlier research which showed clearly that the direct costs of very young children were less than those of other children (Percival and Harding, 2002), we also estimated costs separately for 0 to 4 year olds and 5 to 12 year olds: these age variables were present in the HES so no imputation was required.
To ‘age’ the 1998-99 data to the desired 2005-06 world, we simply indexed both incomes and expenditures by the projected increase in the Consumer Price Index during that period, thus maintaining the relationships apparent in 1998-99 but expressing spending in current dollar values. While there may have been some changes in income and expenditure patterns during this period, particularly given the introduction of the Goods and Services Tax in July 2000, a more comprehensive analysis will have to await the release of the next Household Expenditure Survey.
2.3 Definition of expenditure
In this study, expenditure was defined as current household expenditure. This is total household expenditure as recorded on the HES less the following:
- repayment of mortgage principal for the family home;
- other capital housing payments (includes additions, extensions and renovations to family home, and purchase of other dwellings ; and
- expenditure on superannuation and life insurance.
The reason for excluding these items is that they represent saving, rather than consumption.
However, it needs to be acknowledged that expenditure on at least some of the above items is likely to be influenced by the presence of children in the family - that is, they could be said to have a non-discretionary element. For example, in the case of life insurance, it is quite possible that families with children are more likely to purchase these products.
Similarly, in the case of housing, once the decision has been made to become a home owner, the subsequent housing costs are not discretionary, including those that represent a form of saving.
What would be the effect of including items of non-current expenditure in the cost estimates? Most likely this would see some increase in the costs of older children. For example, typical housing repayment patterns see, over time, an increasing proportion go towards paying-off the mortgage principal. As a result, the housing costs of older families (who would be more likely to have older children) could be biased towards greater repayment of this mortgage component. (This may, however, be offset by the methodology not directly comparing families at the same point in their lifecycles. That is, couples with older children, who would be older themselves, are not compared with older couples without children. Instead, they are compared to couples without children of all ages.) As well, it is also possible that families with older children could be more likely to be paying for home extensions and renovations.
An important difference between this study and our earlier estimates of the costs of children published in the AMP.NATSEM Income and Wealth Reports series (Percival and Harding, 2002) is that we have excluded child care costs from the expenditure estimates. This is because the Task Force has noted the very major changes in government subsidies to childcare that have occurred since 1998-99 and has thus determined that major child care costs should be dealt with separately in any revised Child Support formula. The labour force status of parents with children can vary greatly, ranging from parents who do not participate in the labour force at all and use no child care to those who work full-time and use extensive child care. Accordingly, simply including the average costs of childcare within the child cost estimates overstates the child costs of those who do not incur child care costs and understates the costs of those facing substantial child care costs.
A further important difference to earlier work is that in this study we have attempted to estimate the costs of children in sole parent families, rather than concentrating only on the costs of children in intact couple families. This extension was undertaken to provide the Task Force with some guidance about the likely costs of children in separated families. The child costs for the two different family types were estimated independently, by separating the data according to the number of adults present in the household - i.e., one or two.
3. Estimated costs in couple families
For the subsequent analysis, our restricted population of families with children was divided into quintiles, with the 20 per cent of such households with the lowest gross incomes being placed in the low income group. In devising the quintiles, sole parents and couples with children were considered separately. Low income families are defined here as the bottom one-fifth of families with children, middle income families are the middle one-fifth of all families with children, and high income families are the most affluent one-fifth of all families with children.
It is also important to appreciate that our study looked at the gross costs of children. In setting out a proposed new Child Support Scheme, the Ministerial Task Force considered the net costs of children, which represented the gross costs minus the contribution made by the Federal Government to those costs via Family Tax Benefit (Part A). Another important difference is that we examined the gross costs of children at various gross household income levels, whereas the Task Force considered the net costs of children at various taxable income levels. Particularly for larger families, there can be substantial differences between taxable and gross income, due to the receipt of substantial non-taxable income through such sources as Family Tax Benefit (Parts A and B).
3.1 Costs of children by age
The costs of children were first estimated for couples with children with a single child in each of the defined age and income ranges. The results are shown in Table 1 and in Figure 1.
| Age of child | |||||
|---|---|---|---|---|---|
| Level of income | Average income | 0 to 4 | 5 to 12 | 13 to 15 | 16 to 17 |
| ($ pw) | ($ pw) | ($ pw) | ($ pw) | ||
| Low income | $661 | $45 | $121 | $182 | $260 |
| Middle income | $1,330 | $85 | $187 | $269 | $364 |
| High income | $2,662 | $152 | $291 | $404 | $522 |
| Average | $1,473 | $91 | $195 | $279 | $375 |
Source: ABS 1998-99 Household Expenditure Survey unit record file and authors' calculations
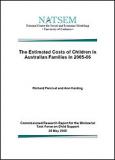
Figure 1: Estimated average costs of a single child in couple families, by age of child and family income, 2005-06
Source: ABS 1998-99 Household Expenditure Survey unit record file and authors' calculations
As expected, the direct costs of children increased with the age of the child and with the level of family income. The lowest direct costs of $45 a week were estimated for children aged between zero and four years living in low income families (with average gross incomes of $661 a week). The highest costs of $522 a week were estimated for 16 to 17 year old children living in high income families. Wealthier families were found to spend a greater amount on their children, whatever their ages. Generally speaking, families in the high income group spent more than twice as much on their children as families in the low income group.
While there was a steady rise in the cost of a child as family income increased, when total costs were considered as a proportion of family income, there was a fall as incomes rose. However, the rate of decline was reduced as family income rose (figure 2).
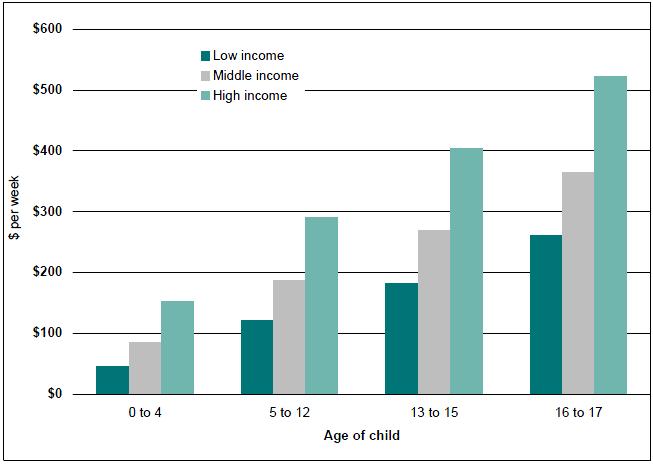
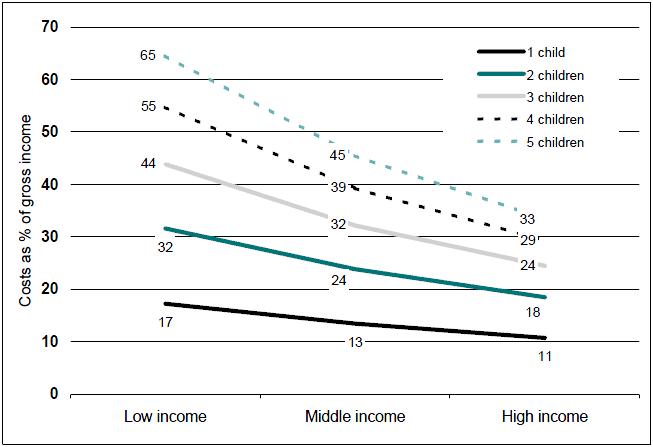
Figure 2: Estimated average costs of a single child in couple families as a proportion of gross income, by age of child and family income, 2005-06
Source: ABS 1998-99 Household Expenditure Survey unit record file and authors' calculations
The costs of a child as a proportion of combined family income ranged between 7 per cent (for a child aged 0 to 4 years in a high income family with a gross income of $2662) to 39 per cent (for a child aged 16 to 17 years in a low income family with an income of $661 per week). Interestingly, as figure 1 illustrates, there is much less variation in the direct costs of children by quintile for older children which, in turn, means that the proportion of family income devoted to spending on older children falls sharply as family income increases. High income families with a child aged 16 to 17 spent just twice as much as low income families on comparable children, despite having four times as much income (figure 1). As a result, expenditure on older children aged 16 to 17 years fell sharply from 39 per cent of gross family income for low income families to 20 per cent of income for high income families (figure 2).
In contrast, high income families with a young child aged 0-4 were estimated to spend about three times as much on their child as low income families (table 1). As a result, expenditure on younger children as a percentage of income showed relatively little variation between the quintiles, ranging from 6 to 7 per cent of gross income (figure 2).
3.2 Costs of children by number of children
The next stage of the analysis was to consider the costs of children according to the number of children in the family. For this purpose, the estimates presented represent the costs of children averaged across all the age ranges. (An alternative would be to estimate average total costs for hypothetical families—for example, for a family with one child aged 4 years and another child aged 15, and so on.) It should be noted that this is not effectively an estimate of the average costs of children up to the ages of 17 years, as this would assume that family incomes remain constant across a child’s different ages. This is, of course, not the case, as incomes typically tend to increase during a family’s lifecycle. To calculate such lifecycle costs would require the use of estimates of the average variations in family incomes over the child-rearing years. Such an approach has been adopted by Espenshade in presenting estimates of the total parental expenditure on children (Espenshade 1984) and Percival and Harding (2002).
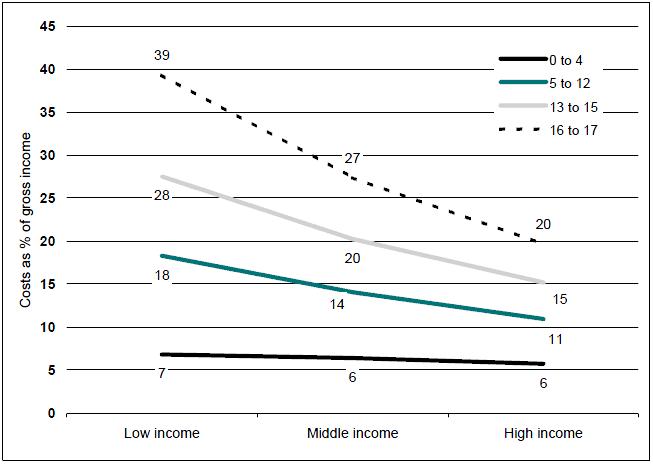
Table 2 and figure 3 show the cost of children by the number of children. Again the cost of each child was found to rise with family incomes. Low income families with one child were estimated to spend $114 a week on that child, while high income families with one child spent $285 a week.
| Level of income | Average income | Number of children | ||||
|---|---|---|---|---|---|---|
| 1 child | 2 children | 3 children | 4 children | 5 children | ||
| ($pw) | ($pw) | ($pw) | ($pw) | ($pw) | ||
| Low income | $661 | $114 | $209 | $290 | $362 | $427 |
| Middle income | $1,330 | $179 | $317 | $428 | $522 | $605 |
| High income | $2,662 | $285 | $492 | $651 | $779 | $888 |
| Average | $1,473 | $188 | $331 | $446 | $543 | $627 |
Source: ABS 1998-99 Household Expenditure Survey unit record file and authors' calculations. Note that there are only 10 couple with children families with five children in our dataset, so the ‘5 children’ estimates should be treated with extreme caution.
Figure 3: Estimated average costs of children in couple families, by number of children and family income, 2005-06
Source: ABS 1998-99 Household Expenditure Survey unit record file and authors' calculations. Note that there are only 10 couple with children families with five children in our dataset, so the ‘5 children’ estimates should be treated with extreme caution.
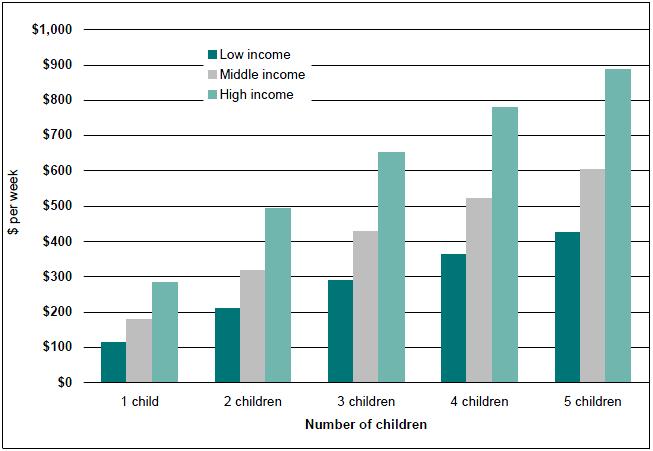
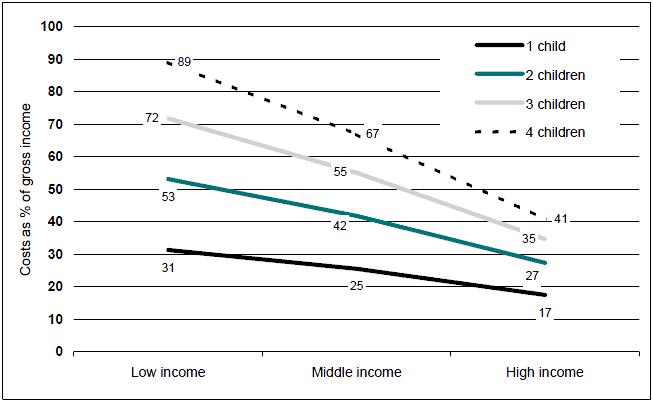
As figure 4 shows, the cost of a single child amounted on average to between 11 and 17 per cent of family income, for two children 18 to 32 per cent of family income and, for three children, about 24 to 34 per cent. As discussed further below, costs as a percentage of income continued to increase as family size increased, reaching 55 per cent of the gross income of a low income family with four children and 65 per cent of the gross income of a low income family with five children. Costs as a percentage of income declined particularly sharply for large families, dropping to only 29 per cent of gross income for a high income family with four children and 33 per cent of gross income for a comparable family with five children.
The cost of each additional child in families with up to five children is shown in table 3. The cost of the first child is the greatest across all incomes (between $114 and $285). For an average couple with children family the average cost of a second child was approximately 76 per cent of cost of the first child, while the cost of the third child was approximately 61 per cent of the first. The reductions in the average cost of each additional child are a result of both the expenditure constraints and the economies of scale that families experience as their size increases.
Figure 4: Estimated average costs of children in couple families as a percentage of gross income, by number of children and family income, 2005-06
Source: ABS 1998-99 Household Expenditure Survey unit record file and authors' calculations. Note that there are only 10 couple with children families with five children in our dataset, so the ‘5 children’ estimates should be treated with extreme caution.
| Level of income | Average income | Number of children | ||||
|---|---|---|---|---|---|---|
| 1 child | 2 children | 3 children | 4 children | 5 children | ||
| $ pw | $ pw | $ pw | $ pw | $ pw | ||
| Low income | $661 | $114 | $95 | $81 | $72 | $65 |
| Middle income | $1,330 | $179 | $138 | $111 | $94 | $83 |
| High income | $2,662 | $285 | $207 | $159 | $128 | $109 |
| Average | $1,473 | $188 | $143 | $115 | $97 | $84 |
| As % of one child family costs | 100 | 76 | 61 | 52 | 45 | |
Source: ABS 1998-99 Household Expenditure Survey unit record file and authors' calculations. Note that there are only 10 couple with children families with five children in our dataset, so the ‘5 children’ estimates should be treated with extreme caution.
It was also found that, in proportional terms, the additional costs of each child diverged as incomes rose. That is, the gap between what families spent on a single child and the additional amounts they spent on subsequent children contracted as incomes rose. At low family incomes of $661, the cost of the second child was approximately 83 per cent of that of the first, while the cost of the third child was approximately 71 per cent of the first. For high income families the cost of the second child was approximately 73 per cent of that of the first, while the cost of the third child was approximately 56 per cent of the first. For five children families the differences are even more marked, with the average marginal cost of the fifth child representing 57 per cent of first child costs in low income families but only 38 per cent of first child costs in high income families.
While the reasons behind this trend are not clear, it may be that lower income families receive greater government assistance relative to the costs of the children than high income families. It may also be that what economies of scale there are with respect to children rise with income. As well, the caution noted at the start of this section with respect to variations in lifecycle incomes needs to be borne in mind when considering these estimates.
The results suggest economies of scale for additional children, particularly for middle to higher income families. As shown in tables 3 and 4, the marginal cost of the second child is always lower than that of the first, while the marginal cost of the third child is lower again. This suggests that the costs of second and subsequent children are lower, as children can share rooms, pass on clothes and toys, and so on. It should also be emphasised, however, that the results also reflect the budget constraints faced by parents. In other words, the marginal costs of the third and subsequent children are lower in part because, at any given income level, parents simply cannot afford to spend the same amount on the third child as on the second.
| Level of income | Average income | Number of children | ||||
|---|---|---|---|---|---|---|
| 1 child | 2 children | 3 children | 4 children | 5 children | ||
| % | % | % | % | % | ||
| Low income | $661 | 100 | 83 | 71 | 63 | 57 |
| Middle income | $1,330 | 100 | 77 | 62 | 53 | 46 |
| High income | $2,662 | 100 | 73 | 56 | 45 | 38 |
| Average | $1,473 | 100 | 76 | 61 | 52 | 45 |
Source: ABS 1998-99 Household Expenditure Survey unit record file and authors' calculations. Note that there are only 10 couple with children families with five children in our dataset, so the ‘5 children’ estimates should be treated with extreme caution.
4. Estimated costs in sole parent families
The estimated costs of children in sole parent families are a focus of particular attention, given overseas research which suggests that separated families may face higher child costs than intact families. In interpreting the following figures, it should be recalled that the income quintiles have been separately created for couples with children and sole parents. The lower incomes of sole parent families relative to couple with children families are clear in the average incomes applying within each of the income groups. The average gross incomes of sole parents in the bottom quintile of sole parents are only $284 a week, well below the average $661 a week recorded by the bottom quintile of couple with children families. Similarly, the top quintile of sole parents have gross incomes of only $1 169 a week, less than half the $2 662 received by the top quintile of couples with children.
4.1 Costs of children by age
The costs of children were first estimated for sole parents with a single child in each of the defined age and income ranges.
The results are shown in table 5 and figure 5.
| Level of income | Average income | Age of child | |||
|---|---|---|---|---|---|
| 0 to 4 | 5 to 12 | 13 to 15 | 16 to 17 | ||
| ($ pw) | ($ pw) | ($ pw) | ($ pw) | ||
| Low income | $284 | $77 | $81 | $94 | $179 |
| Middle income | $459 | $102 | $106 | $125 | $220 |
| High income | $1,169 | $184 | $186 | $218 | $345 |
| Average | $583 | $115 | $119 | $140 | $240 |
Source: ABS 1998-99 Household Expenditure Survey unit record file and authors' calculations
As expected, the direct costs of children increased with the age of the child and with the level of family income. The lowest direct costs of $77 a week were estimated for children aged between zero and four years living in low income sole parent families (with average gross incomes of $284 a week). The highest costs of $345 a week were estimated for 16 to 17 year old children living in high income sole parent families. Wealthier sole parent families were found to spend a greater amount on their children, whatever their ages. Families in the high income group generally spent at least twice as much on their children as sole parents in the low income group.
Figure 5: Estimated average costs of a single child in sole parent families, by age of child and family income, 2005-06
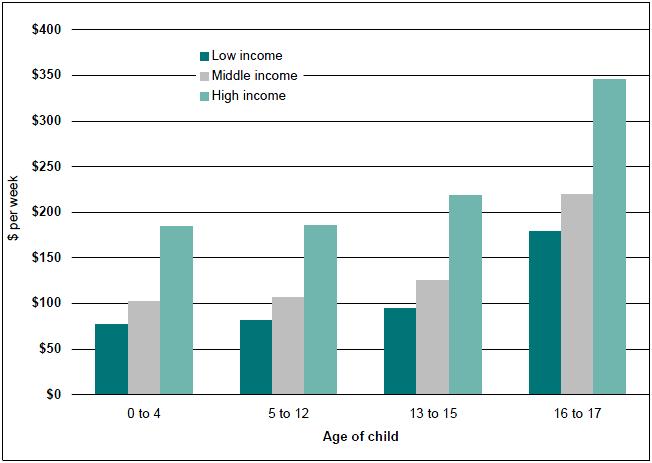
Source: ABS 1998-99 Household Expenditure Survey unit record file and authors' calculations
Again, while there was a steady rise in the cost of a child as family income increased, when total costs were considered as a proportion of family income, there was a fall as incomes rose (Figure 6).
For sole parent families, the costs of a child as a proportion of their gross income ranged between 16 per cent (for a child aged 0 to 4 years in a high income family with a gross income of $1 169) to 63 per cent (for a child aged 16 to 17 years in a low income family with an income of $284 per week).
Source: ABS 1998-99 Household Expenditure Survey unit record file and authors' calculations
Figure 6: Estimated average costs of a single child in sole parent families as a proportion of gross income, by age of child and family income, 2005-06
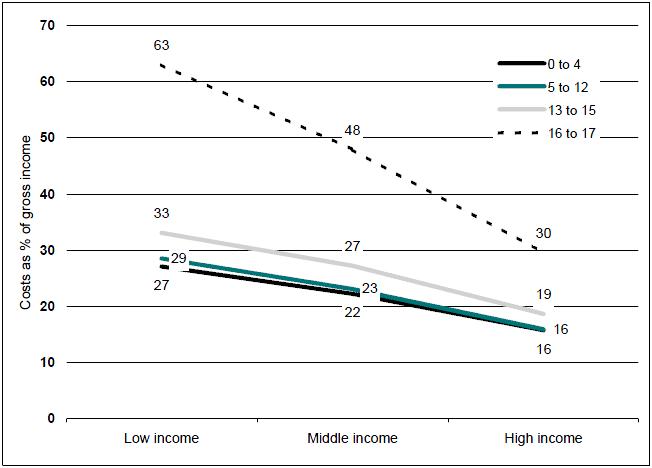
Source: ABS 1998-99 Household Expenditure Survey unit record file and authors' calculations
4.2 Costs of children by number of children
Table 6 and Figure 7 show the cost of children in sole parent families by the number of children. Again the cost of each child was found to rise with family incomes. Low income sole parent families with one child were estimated to spend $89 a week on that child, while high income sole parent families with one child spent $204 a week. Where there were one to three children, high income sole parent families spent roughly twice as much on their children as low income sole parent families. However, where there were four children, high income sole parent families spent less than twice as much as low income families.
| Level of income | Average income | Number of children | |||
|---|---|---|---|---|---|
| 1 child | 2 children | 3 children | 4 children | ||
| ($ pw) | ($ pw) | ($ pw) | ($ pw) | ||
| Low income | $284 | $89 | $151 | $204 | $253 |
| Middle income | $459 | $117 | $192 | $253 | $307 |
| High income | $1,169 | $204 | $320 | $405 | $477 |
| Average | $583 | $131 | $212 | $277 | $334 |
Source: ABS 1998-99 Household Expenditure Survey unit record file and authors' calculations. Note that there are only 11 sole parent families with four children in our dataset, so the '4 children' estimates should be treated with extreme caution.
Figure 7: Estimated average costs of children in sole parent families, by number of children and family income, 2005-06
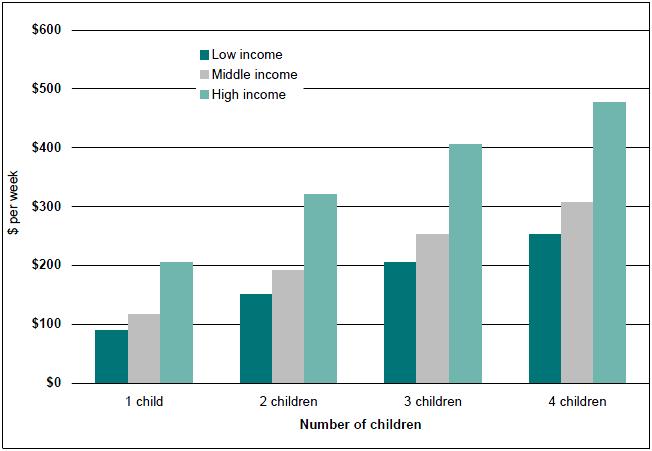
Source: ABS 1998-99 Household Expenditure Survey unit record file and authors' calculations. Note that there are only 11 sole parent families with four children in our dataset, so the '4 children' estimates should be treated with extreme caution.
As Figure 8 shows, the cost of a single child amounted on average to between 17 and 31 per cent of family income, for two children 27 to 53 per cent of family income and, for three children, about 35 to 72 per cent. Low income sole parents with four children were on average devoting a very high proportion of their gross income to their children, although the small sample size should be noted, as should the fact that many low income households recorded within the ABS Household Expenditure Survey are apparently dissaving.
Figure 8: Estimated average costs of children in sole parent families as a percentage of gross income, by number of children and family income, 2005-06
Source: ABS 1998-99 Household Expenditure Survey unit record file and authors' calculations. Note that there are only 11 sole parent families with four children in our dataset, so the '4 children' estimates should be treated with extreme caution.
The cost of each additional child in sole parent families with up to four children is shown in Table 7 and Figure 9. The cost of the first child is the greatest across all incomes (between $89 and $204). For an average sole parent family the average cost of a second child was approximately 62 per cent of cost of the first child, while the cost of the third child was approximately 50 per cent of the first. For the fourth child this dropped to 44 per cent.
At low family incomes of $284 the cost of the second child was approximately 70 per cent of that of the first, while the cost of the third child was approximately 60 per cent of the first. For high income families the cost of the second child was approximately 57 per cent of that of the first, while the cost of the third child was approximately 42 per cent of the first.
In general, the cost of children in sole parent families was found to follow similar patterns to those for intact couple families-older children cost more and families with higher incomes spend more on their children, of all ages, but especially the older children.
| Level of income | Average income | Number of children | |||
|---|---|---|---|---|---|
| 1 child | 2 children | 3 children | 4 children | ||
| Low income | $284 | $89 | $62 | $53 | $49 |
| Middle income | $459 | $117 | $75 | $61 | $54 |
| High income | $1,169 | $204 | $116 | $85 | $72 |
| Average | $583 | $131 | $81 | $65 | $57 |
| As % of one child family costs | 100 | 62 | 50 | 44 | |
Source: ABS 1998-99 Household Expenditure Survey unit record file and authors' calculations. Note that there are only 11 sole parent families with four children in our dataset, so the '4 children' estimates should be treated with extreme caution.
| Level of income | Average income | Number of children | |||
|---|---|---|---|---|---|
| 1 child | 2 children | 3 children | 4 children | ||
| % | % | % | % | ||
| Low income | $284 | 100 | 70 | 60 | 55 |
| Middle income | $459 | 100 | 64 | 52 | 46 |
| High income | $1,169 | 100 | 57 | 42 | 35 |
| Average | $583 | 100 | 62 | 50 | 44 |
Source: ABS 1998-99 Household Expenditure Survey unit record file and authors' calculations. Note that there are only 11 sole parent families with four children in our dataset, so the '4 children' estimates should be treated with extreme caution.
5. Summary and conclusions
In this study we have estimated the direct gross costs of children in Australian one and two parent families, where the costs of children were defined as parental expenditures on children up to 17 years of age. The level of expenditure was determined by comparing the expenditures of families with the same number of adults, with and without children and at the same ‘material standard of living’. The measure of the ‘material standard of living’ was the proportion of total expenditure spent upon a basket of goods that included food consumed at home and fuel and power. No account was taken of the indirect costs of children (e.g. the forgone earnings due to mothers working part-time rather than full-time).
There were several important findings made in the study. Not unexpectedly, these included that the average costs of children in Australian families varied according to the age of the child, the income level of the parents and the number of children in the family. More specifically:
- The cost of a child was found to be lowest for children in the youngest age group (at $85 a week for zero to four year olds living in middle income couple families with an average gross income of $1330 a week) and highest for children in the oldest age group (at $364 a week for 15 to 17 year olds in the same middle income couple families);
- Higher income families spent more on their children than lower income families (e.g. the costs of a five to 12 year old child were estimated at $121 a week for couple families in the bottom income quintile, rising to $291 a week for couple families in the top income quintile);
- While the dollar costs of children rose in line with rising family incomes, they nonetheless fell when expressed as a proportion of gross family income (particularly for older children);
- The average expenditure per child was found to be greatest for families with one child and fell for larger families. The average cost of the first child in couple families was $179 for middle income couple families, while the cost of a second child was $138 for the same families, the third child cost $111, the fourth child cost $94 and the fifth child cost only $83;
- The average expenditure on children in sole parent families was found to be higher as a percentage of gross income than in couple families. It was unclear to what extent this reflected the lower incomes of sole parent families and the fact that there was one fewer adult sharing the family budget.
In assessing the results of the study, it must again be stressed that the costs of children that have been presented are averaged estimates derived from reporting of what parents spend to meet all household costs. Being averages, actual expenditures on children will often be considerably higher or lower for particular families than the estimates we present—i.e., nothing in the study suggests a prescriptive level of parental expenditure.
6. References
Australian Bureau of Statistics (ABS 2000), Household Expenditure Survey 1998-99, Australia, Confidentialised Unit Record File Technical Paper, ABS Catalogue no. 6544.0.30.001, Australian Bureau of Statistics, Canberra
Betson, M. (1990), Alternative Estimates of the Cost of Children From the 1980-86 Consumer Expenditure Survey, Institute for Research on Poverty, University of Wisconsin-Madison, Special Report Series No. 51.
Bradbury, B. (1994), 'Measuring the Cost of Children', Australian Economic Papers, June 1994, 120-138.
Bradbury, B. (1997), Family Size and Relative Need, Unpublished Ph.D. Thesis, School of Economics, University of New South Wales.
Carlucci, M. and Roberto Zelli (1998), Expenditure Patterns and Equivalence Scales', Paper presented to the 25th General Conference of the International Association for Research in Income and Wealth, Cambridge, 23-29 August.
Deaton, S. and J. Muellbauer (1986), ' On measuring child costs: with applications to poor countries', Journal of Political Economy, 94(4), 720-44.
Espenshade, T. (1972) The Cost of Children In Urban United States, Princeton University, Ph.D., University Microfilms, Ann Arbor, Michigan
Espenshade, T. (1984), Investing in Children: New Estimates of Parental Expenditures, The Urban Institutes Press, Washington DC,
Lee, D. (1988), 'Estimates of Direct Expenditures on Children in Australian: Results from the Household Expenditure Survey 1984', paper presented at the Conference of the Australian Population Association, Brisbane, August 31 - September 2, 1988.
Leser, C. (1963), 'Forms of Engel functions', Econometrica, 31(4), 694-703.
McHugh, M (1999), ‘The Costs of Children: Budget Standards Estimates and the Child Support Scheme’, Discussion Paper No 103, Social Policy Research Centre, University of NSW, Sydney.
Merz, J. and J. Faik (1992), 'Equivalence Scales Based on Revealed Preference Consumption Expenditure Microdata - the Case of West Germany', Discussion Paper No. 3., Forschungsinstitut Freie Berufe, University of Lunenburg, Lunenburg.
Percival, R., Harding, A., (2002), ‘All they need is love… and around $450,000’, AMPNATSEM Income and Wealth Report, Issue 3, October.
Harding, A. and Percival, R. (1999), ‘The Private Costs of Children in 1993-94’, Family Matters, No 54, Spring/Summer, pp. 82-87.
Henman, P. (2005), ‘Updated Costs of Children Using Australian Budget Standards’, Report of the Ministerial Task Force on Child Support, Volume Two: Commissioned Research, Canberra.
Merz, J., Garner, T., Smeeding, T., Faik, J. and Johnson, D. (1993), ‘Two Scales, One Methodology: Expenditure Equivalence Scales for the United States and Germany’, All-University Gerontology Center, Syracuse University, Syracuse, New York.
Percival, R., Harding, A., and P McDonald (1999), ‘Estimates of the Costs of Children in Australian Families, 1993-94’, report prepared for the Department of Family and Community Services, National Centre for Social and Economic Modelling, May.
Rothbarth, E. (1943), 'A Note on a Method of Determining Equivalent Income for Families of Different Composition', Appendix 4 in C. Madge (ed.) War-time Patterns of Saving and Spending, Cambridge, Cambridge University Press.
Saunders, P. (1999), ‘Budget Standards and the Costs of Children’, Family Matters, No 53, Winter, pp. 62-70.
Tran Nam, Binh and Peter Whiteford (1990), ‘Household equivalence scales: new Australian estimates from the 1984 Household expenditure survey' The Economic Record, September, 221-234.
Valenzuela, M.R. (1999), ‘Costs of Children in Australian Households’, Family Matters, No 53, Winter, pp. 71-76.
Watts, H., (1977) "The iso-prop index: An approach to the determination of deferential poverty income thresholds", in M. Moon and E. Smolensky (eds.) Improving Measures of Economic Well-being, New York, Academic Press.
Whiteford, P. (1985), A family's needs: Equivalence scales , poverty and social security, Research Paper No. 27, Development Division, Department of Social Security, Canberra.
Working, H. (1943), 'Statistical laws of family expenditures', Journal of the American Statistical Association, Vol, 38, 43-56.
Appendix: Detailed description of methodology
This appendix provides some further details about the methodology used in this study. The study involved the estimation using OLS and the 1998-99 Household Expenditure Survey data of two key equations – to predict the total consumption of a family and the second to predict household living standards.
Equation (1) had the following form:
C = f (fY, fY2, Agei…Agen) (1)
Where
C = household consumption expenditure
fY = total household weekly income
fY2 = the square of total household weekly income
Agei = number of persons of age i in household
For the second equation (2) a functional form specified by Betson (1990) was used.
LNPF = g (LEFS, LEFS2, LNF, CKAi…CKAn) (2)
Where
LNPF = the logit of the proportion of household consumption expenditure spent on the selected basic goods
LEFS = the log of per capita consumption
LEFS2 = LEFS squared
LNF = the log of family size
CKAi = number of persons of age i in household divided by family size
This form is derived from a class of equations which are referred in the literature as Working - Leser (WL) equations (Working, 1943; Leser, 1963). These have the general form of:
w = l (lnC, f, d) (3)
Where
w = the expenditure share of a particular item (e.g. food)
lnC = the log of total expenditure
f = household size
d = vector of selected demographic variables (eg. number and ages of children, number of adults, etc.)
Equations of this form have been widely used in estimating expenditure-based equivalence scales (see, for example, Carlucci and Zelli 1998; Tran Nam and Whiteford 1990). This form was preferred to that used by Espenshade (1984) as investigation indicated that this form both provided a better fit for data and was better able to differentiate the costs of children of different ages.
Having estimated both equations, the total cost of a child was calculated as follows:
- Assuming values for husband’s income (hY), spouse’s income (if present) (sY) and Agei…Agen, estimate the value of C1 using equation (1) for a couple family with one child.
- By substituting this estimated value of C1 for the couple with one child into equation (2), calculate the predicted value of LNPF.
- Assuming the same value of LNPF (that is, the same standard of living), substitute this value into equation (2) for a couple without a child and solve for C2.
- The difference between the two estimated costs (i.e. C1 - C2) is the estimated cost of a child at income level hY + sY.
Last updated: