Stage Three of the Child Support Scheme Reforms
Information on Results of the report on the changes to the Child Support Scheme Reforms - Stage Three
The Department of Families, Housing, Community Services and Indigenous Affairs (FaHCSIA) has assessed the impact of Stage Three of the Child Support Scheme reforms on affected parents. The results provided below are a combination of modelled Family Tax Benefit (FTB) and actual changes in child support assessments, based on the new child support formula.
Financial outcomes of the child support changes cannot be viewed in isolation from FTB. This is partly because changes in the amount of child support received may alter the amount of FTB payable, and partly because the reforms to the child support system included important changes to FTB eligibility rules.
In addition, these results show what the financial outcome would be for parents if the new child support liability was paid in full. They do not show the actual financial outcomes because, in practice, many parents (less than half of those who have the Child Support Agency collect their child support) do not pay or receive their child support in full or on time.
A key objective of the child support reforms is to improve compliance with child support obligations. This includes not only ensuring that parents pay their full assessment on time, but also that the assessment is an accurate reflection a parent's capacity to pay. With this in mind, the package of reforms included $165 million in additional resources for enforcement activities over four years which, to date, have yielded $104 million in extra child support in two years since their commencement in July 2006.
Principles of the Child Support Scheme Reforms
The changes to the child support system are based on a set of principles identified by an independent Ministerial Taskforce on Child Support. These principles are that a child support system should:
- be based, as much as possible, on what it costs to raise children
- enable parents to share the cost of supporting their children according to their capacity to pay
- recognise that provision of care is a contribution to the cost of children
- minimise the extent to which financial concerns influence agreements about parenting arrangements and care
- treat children in first and subsequent families as equally as possible, and
- take account of the contribution made by Government to the costs of raising children.
Overall Results
Under the previous child support system, in 2007-08, $2.9 billion was assessed to be paid in child support. The new child support system reduces this by around 7 per cent ($210 million). On the basis of these new assessments, the reduction in child support is offset by an extra $140 million payable in Family Tax Benefits (FTB).
This doesn't necessarily mean that these resources are not available for the children - where care is shared, the reduction in child support payable means that these resources remain within the second household for the care of the child. Moreover, where care is shared for less than 35 per cent of the time, the reduction in child support for the resident parent is additionally offset by the transfer of the payer's share of FTB to the payee in the child's main home.
Payees and Payers
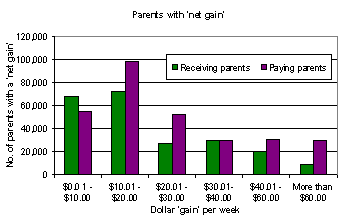
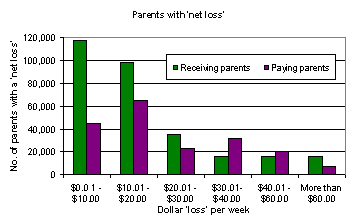
Based on the analysis of 691,000 cases; around 37 per cent of payees and 51 per cent of payers have net increase as a result of the reforms. Around 49 per cent of payees and 33 per cent of payers have net decrease. Around 13 per cent of payees and 16 per cent of payers had no net change as a result of the reforms. In the majority of cases, for both payees and payers, the changes are $20 per week or less, and in a large proportion of cases, the changes are less than $10 per week.
For payees: Around 37 per cent of payees experienced a net increase. For most of these (62 per cent) the increase was less than $20 per week. Approximately 49 per cent of payees experienced a net decrease. For most of these (59 per cent) the decrease was less than $20 per week.
For payers:Around 51 per cent of payers experienced a net increase. For most of these (77 per cent) the increase was less than $20 per week. Approximately 33 per cent of payers experienced a net decrease. For most of these (45 per cent) the decrease was less than $20 per week.


A detailed list of caveats is available on the FaHCSIA website.
Please note this fact sheet is for general guidance only. It should not be treated as a complete or authoritative legal statement.
More detailed information on the impact of these changes to the Child Support Scheme (including information on the taskforce and how the reforms started) can be found on the FaHCSIA website.
Related publication
Last updated:
