Review of Carer Payment (child) - Statistical Compendium
© Commonwealth of Australia 2007
This work is copyright. Apart from any use as permitted under the Copyright Act 1968, no part may be reproduced by any process without prior written permission from the Commonwealth available from the Commonwealth Copyright Administration, Attorney-General’s Department. Requests and inquiries concerning reproduction and rights should be addressed to the Commonwealth Copyright Administration, Attorney-General’s, Robert Garran Offices, National Circuit, Canberra ACT 2600 or posted at Commonwealth copyright administration (http://www.ag.gov.au/cca).
Table of Contents
- Children with disabilities
- Carers of children with disability
- 2.1 Number of carers
- 2.2 Age and sex
- 2.3 States and territories
- 2.4 Relationship to care recipient
- 2.5 Assistance with core activities
- 2.6 Hours of care
- 2.7 Need for support
- 2.8 Effect of caring role on relationships
- 2.9 Labour force participation
- 2.10 Income
- 2.11 Work preferences and barriers to labour force participation
- Carer Payment recipients
- 3.1 Number of recipients
- 3.2 Age and sex
- 3.3 States, territories and regional distribution
- 3.4 Marital status
- 3.5 Indigenous recipients
- 3.6 Multiple care
- 3.7 Country of birth of recipients
- 3.8 Total duration on payment
- 3.9 Homeownership of recipients
- 3.10 Claims, grants and rejections
- 3.11 Rate of payment
- 3.12 Care receivers of CP recipients
- 3.13 Care receivers of CP recipients across states and territories
- 3.14 Medical conditions of children receiving care from CP recipients
- 3.15 Treating health professional for children receiving care from CP recipients
- 3.16 Profound disability categories of children receiving care from CP recipients
- Carer Allowance recipients
- 4.1 Number of recipients
- 4.2 Age and sex
- 4.3 States, territories and regional distribution
- 4.4 Marital status
- 4.5 Indigenous recipients
- 4.6 Multiple care
- 4.7 Shared care
- 4.8 Country of birth of recipients
- 4.9 Total duration on allowance
- 4.10 Homeownership of recipients
- 4.11 Claims, grants and rejections
- 4.12 Care receivers of CA recipients
- 4.13 Care receivers of CA recipients across states and territories
- 4.14 Medical conditions of children receiving care from CA recipients
- Data limitations and caveats
- References
Introduction
This paper provides a statistical summary of the population of children with disability and their carers in Australia. It also provides a statistical summary of the Carer Payment and Carer Allowance populations, with a particular focus on comparing recipients caring for children with recipients overall. It draws on data from the Australian Bureau of Statistics (ABS) and Centrelink administrative data.
[ Return to Top Return to Section ]
1. Children with disabilities
According to the Australian Bureau of Statistics (ABS) Survey of Disability, Ageing and Carers (SDAC), in 2003 around 317,900 Australian children (8.3% of all children aged 0–14 years) had disability (ABS 2004). Disability was defined as any limitation, restriction or impairment, which had lasted, or was likely to last, for at least six months and restricted everyday activity (ABS 2004).
An estimated 220,300 children had core activity limitations (5.7% of all children), including an estimated 165,300 children with severe or profound core activity limitations (4.3% of all children). Core activities were defined as communication, mobility and self-care.
Communication: Understanding family or friends, being understood by family or friends, understanding strangers or being understood by strangers.
Mobility: Getting into or out of a bed or chair, moving about the usual place of residence, going to or getting around a place away from the usual residence, walking 200 metres, walking up and down stairs without a handrail, bending and picking up an object from the floor or using public transport.
Self-care: Showering or bathing, dressing, eating, toileting, or bladder or bowel control (ABS 2004).
Four levels of core activity limitations were determined based on whether a person needs help, has difficulty, or uses aids or equipment with any of the core activities (communication, mobility or self-care). A person’s overall level of core-activity limitation is determined by his or her highest level of limitation in these activities. The four levels of limitation are profound, severe, moderate and mild.
Profound: The person is unable to do, or always needs help with, a core-activity task.
Severe: The person sometimes needs help with a core-activity task, has difficulty understanding or being understood by family or friends or can communicate more easily using sign language or other non-spoken forms of communication.
Moderate: The person needs no help but has difficulty with a core-activity task.
Mild: The person needs no help and has no difficulty with any of the core-activity tasks but uses aids and equipment, cannot easily walk 200 metres, cannot walk up and down stairs without a handrail, cannot easily bend to pick up an object from the floor, cannot use public transport, can use public transport but needs help or supervision, or needs no help or supervision but has difficulty using public transport (ABS 2004).
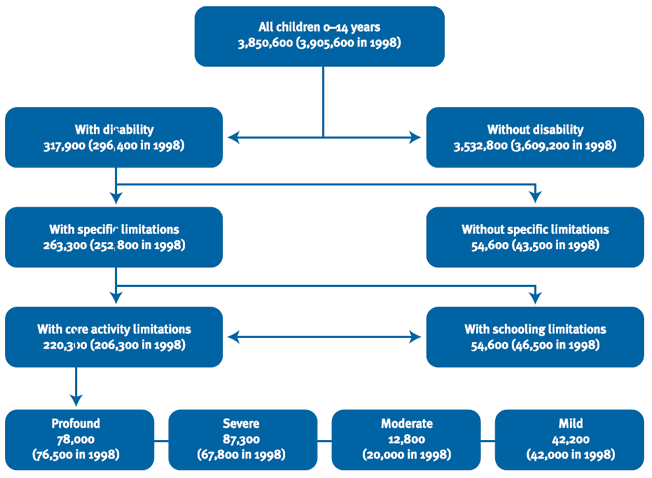
Between 1998 and 2003 the overall number of children decreased by around 1.4%; however, the proportion of children with disability increased from 7.6% (296,400 children) in 1998 to 8.3% (317,900 children) in 2003. The proportion of children with severe or profound core activity limitations increased from 3.7% (144,300 children) in 1998 to 4.3% (165,300) in 2003 (Figure 1).
Figure 1: Children aged 0–14 years, disability status, Australia, 1998 and 2003
Source: FaCSIA analysis of 2003 Survey of Disability, Ageing and Carers Confidentialised Unit Record File and AIHW analysis of 1998 SDAC CURF.
[ Return to Top Return to Section ]
1.1 States and territories
The proportion of children with severe or profound core activity limitations varied across the states and territories. South Australia recorded the highest proportion (5.5% of all children in South Australia), followed by Western Australia (5.4%). Tasmania recorded the lowest proportion (2.8%) (Table 1).
| Core activity limitation | ||||||||||
|---|---|---|---|---|---|---|---|---|---|---|
| Profound/severe | Moderate/mild | Total | Total with disability | Total | ||||||
| State/territory | (’000) | % | (’000) | % | (’000) | % | (’000) | % | (’000) | % |
| New South Wales | 49.0 | 3.8 | 24.3 | 1.9 | 73.3 | 5.7 | 109.3 | 8.4 | 1,294.9 | 49.0 |
| Victoria | 42.3 | 4.4 | 11.0 | 1.2 | 53.4 | 5.6 | 73.0 | 7.7 | 952.0 | 42.3 |
| Queensland | 31.7 | 4.3 | 7.8 | 1.1 | 39.6 | 5.4 | 57.0 | 7.7 | 737.5 | 31.7 |
| South Australia | 15.6 | 5.5 | 3.7 | 1.3 | 19.3 | 6.8 | 28.3 | 9.9 | 286.0 | 15.6 |
| Western Australia | 20.8 | 5.4 | 6.2 | 1.6 | 27.0 | 7.0 | 36.1 | 9.3 | 387.4 | 20.8 |
| Tasmania | 2.7 | 2.8 | 1.4 | 1.5 | 4.1 | 4.3 | 7.6 | 8.0 | 94.7 | 2.7 |
| Australian Capital Territory | 2.2 | 3.5 | 0.5 | 0.8 | 2.7 | 4.4 | 3.9 | 6.2 | 62.9 | 2.2 |
| Australia(a) | 165.3 | 4.3 | 55.0 | 1.4 | 220.3 | 5.7 | 317.9 | 8.3 | 3,850.6 | 165.3 |
(a) Includes Northern Territory.
Source: FaCSIA analysis of 2003 Survey of Disability, Ageing and Carers Confidentialised Unit Record File.
[ Return to Top Return to Section ]
1.2 Age and sex
In 2003, there were a greater proportion of boys with disability (10% of all boys aged 0–14 years) than girls (6.5% of all girls aged 0–14 years). Boys also had a higher rate of severe or profound core activity limitations (5.4%) than girls (3.1%) (AIHW 2006).
Children aged 5–9 and 10–14 years were more likely to have disability (9.1% and 11.0% of all children aged 5–9 years and 10–14 years respectively) than children aged 0–4 years (4.4%). The rates of severe or profound core activity limitations were also higher among children aged 5–9 and 10–14 (both 4.9%) than among those aged 0–4 years (2.9%) (see Table 2). This may be due, however, to difficulties in assessing core activity limitations at such young ages. Since infants and very young children cannot be expected to perform many core activities, the 2003 SDAC uses separate questions to identify core activity limitation among young children with disabilities (children aged 0–4 years) compared to children aged 5 years and over (AIHW 2006).
| Core activity limitation | ||||||||||
|---|---|---|---|---|---|---|---|---|---|---|
| Profound/severe | Moderate/mild | Total | Total with disability | All children | ||||||
| (’000) | % | (’000) | % | (’000) | % | (’000) | % | (’000) | ||
| Boys | ||||||||||
| 0–4 | 20.8 | 3.3 | 0.4 | 0.1 | 21.2 | 3.4 | 29.7 | 4.8 | 623.7 | |
| 5–9 | 43.2 | 6.5 | 15.2 | 2.3 | 58.4 | 8.7 | 78.2 | 11.7 | 669.2 | |
| 10–14 | 42.5 | 6.3 | 20.8 | 3.1 | 63.3 | 9.4 | 88.6 | 13.1 | 676.9 | |
| Total | 106.6 | 5.4 | 36.3 | 1.8 | 142.9 | 7.3 | 196.5 | 10.0 | 1969.8 | |
| Girls | ||||||||||
| 0–4 | 15.1 | 2.5 | 1.6 | 0.3 | 16.7 | 2.8 | 23.8 | 4.0 | 598.8 | |
| 5–9 | 20.6 | 3.3 | 8.5 | 1.3 | 29.1 | 4.6 | 40.1 | 6.4 | 630.0 | |
| 10–14 | 23.1 | 3.5 | 8.6 | 1.3 | 31.7 | 4.9 | 57.5 | 8.8 | 652.1 | |
| Total | 58.7 | 3.1 | 18.7 | 1.0 | 77.4 | 4.1 | 121.4 | 6.5 | 1,880.8 | |
| Children | ||||||||||
| 0–4 | 35.9 | 2.9 | 1.9 | 0.2 | 37.8 | 3.1 | 53.5 | 4.4 | 1,222.5 | |
| 5–9 | 63.8 | 4.9 | 23.7 | 1.8 | 87.5 | 6.7 | 118.2 | 9.1 | 1,299.2 | |
| 10–14 | 65.6 | 4.9 | 29.4 | 2.2 | 95.0 | 7.1 | 146.1 | 11.0 | 1,329.0 | |
| Total | 165.3 | 4.3 | 55.0 | 1.4 | 220.3 | 5.7 | 317.9 | 8.3 | 3,850.6 | |
Source: AIHW 2006, Disability updates: children with disabilities, Bulletin 42.
[ Return to Top Return to Section ]
1.3 Most prevalent disabling conditions
The Australian Institute of Health and Welfare (2006) grouped disabling conditions into four major categories.
Intellectual/learning disability—associated with impairment of intellectual functions, with limitations in a range of daily activities and with restriction in participation in various areas of life.
Psychiatric—associated with clinically recognisable symptoms and behaviour patterns frequently associated with distress that may impair personal functioning in normal social activity.
Sensory/speech disability—associated with impairment of the eye, ear and related structures and of speech structures and functions.
Physical/diverse—associated with the presence of an impairment which may have diverse effects within and among individuals, including effects on physical activities such as mobility.
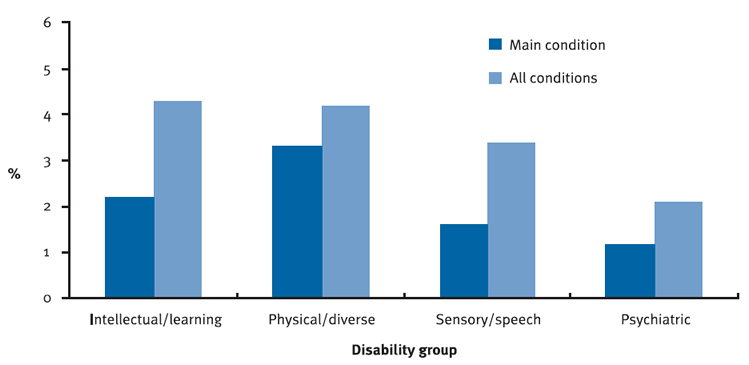
In 2003, the most prevalent disabilities reported among children were intellectual/learning, reported for an estimated 166,700 children (4.3% of all children), and physical/diverse, reported for an estimated 162,800 children (4.2%). These were followed by sensory/speech (129,700 children or 3.4%) and psychiatric (81,000 children or 2.1%).
However, when considering only the main condition reported for a child, physical/diverse disabilities were the most prevalent (125,200 children, 3.3% of all children), followed by intellectual/learning (85,000 children, 2.2%), sensory/speech (60,200 children, 1.6%) and psychiatric (47,500 children, 1.2%) (Figure 2).
Certain types of disabilities are more likely to be reported as the main condition. For example, physical/diverse conditions had the highest likelihood of being reported as the main conditions—77% of children with a physical/diverse condition reported it as their main condition. In contrast, less than half (46%) of children with a sensory/speech condition reported this condition as their main condition.
Figure 2: Children with disability, prevalence rate of disability groups, main and all conditions, 2003
Source: AIHW 2006, Disability updates: children with disabilities, Bulletin 42.
[ Return to Top Return to Section ]
1.4 Type of assistance received
Around 94% of children with severe or profound core activity limitations received informal assistance with core activities. Of these, 69% received a combination of formal and informal assistance and 26% received informal assistance only. A further 3.2% received formal assistance only and 2.5% did not receive assistance with core activities (AIHW 2006).
The majority (80%) of assistance with self-care received by children with severe or profound core activity limitations was informal only. The majority of assistance with communication and mobility was a combination of informal and formal support (79% and 61% respectively) (AIHW 2006).
While 98% of children requiring assistance with communication received assistance with this activity, only 60% of these children had their need for assistance with communication fully met. In comparison, 90% of children requiring assistance with self-care had this need fully met (AIHW 2006) (Table 3).
| Assistance received | Extent need for assistance met | Number of children requiring assistance | ||||||
|---|---|---|---|---|---|---|---|---|
| Type of activity | Informal only | Formal only | Both | None | Fully met | Partly met | Not met | |
| Number (’000) | ||||||||
| Mobility | 27.8 | 1.5 | 48.5 | 1.2 | 62.6 | 15.2 | 1.2 | 79.1 |
| Communication | 15.4 | 5.6 | 87.0 | 2.3 | 66.6 | 41.4 | 2.3 | 110.3 |
| Self-care | 63.5 | 0.9 | 12.0 | 3.3 | 72.0 | 4.4 | 3.3 | 79.7 |
| Total core activities | 41.6 | 5.2 | 110.7 | 4.1 | 107.0 | 50.6 | 4.1 | 161.7 |
| Percentage | ||||||||
| Mobility | 35.2 | 2.0 | 61.3 | 1.6 | 79.2 | 19.3 | 1.6 | 100.0 |
| Communication | 14.0 | 5.1 | 78.9 | 2.1 | 60.4 | 37.6 | 2.1 | 100.0 |
| Self-care | 79.6 | 1.1 | 15.1 | 4.2 | 90.4 | 5.5 | 4.2 | 100.0 |
| Total core activities | 25.7 | 3.2 | 68.5 | 2.5 | 66.2 | 31.3 | 2.5 | 100.0 |
Source: AIHW 2006, Disability updates: children with disabilities, Bulletin 42.
2. Carers of children with disability
2.1 Number of carers
According to SDAC, in 2003 there were 2.6 million carers who provided some assistance to those who needed help because of disability or age (ABS 2004). There were about 472,500 primary carers (19% of all carers). A primary carer was defined as a person who provides the most informal assistance, in terms of help or supervision, to a person with one or more disabilities. The assistance must be ongoing, or likely to be ongoing, for at least six months and be provided for one or more core activities (communication, mobility or self-care). Primary carers include people aged 15 years and over.
There were approximately 57,800 primary carers of children with disability (12% of all carers), including approximately 54,600 who were the primary carers of children with severe or profound core activity limitations.
[ Return to Top Return to Section ]
2.2 Age and sex
Around 92% of primary carers of children with severe or profound core activity limitations were female compared to 71% of all primary carers.
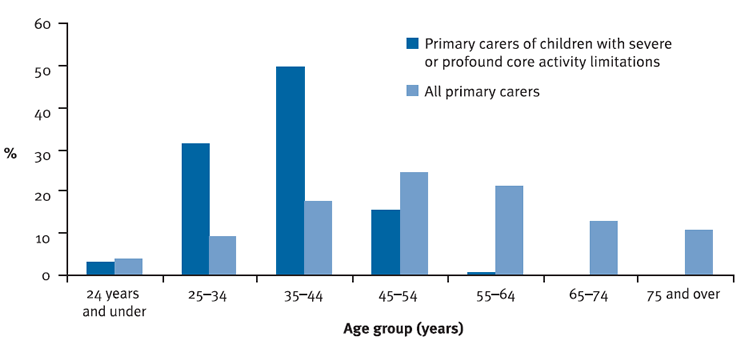
Primary carers of children with severe or profound core activity limitations were younger than primary carers overall. Primary carers of children with severe or profound core activity limitations were most commonly aged 35–44 years (49%), while primary carers overall were most commonly aged 45–54 years (24%) (Table 4 and Figure 3).
| Primary carers of children with severe/profound core activity limitations | All primary carers | |||||
|---|---|---|---|---|---|---|
| Male | Female | Total | Male | Female | Total | |
| Age group (years) | (’000) | (’000) | (’000) | (’000) | (’000) | (’000) |
| 24 and under | - | 1.8 | 1.8 | 4.5 | 13.5 | 18.1 |
| 25–34 | 1.5 | 15.5 | 17.0 | 9.0 | 35.1 | 44.1 |
| 35–44 | 1.2 | 25.9 | 27.0 | 17.0 | 65.6 | 82.6 |
| 45–54 | 1.9 | 6.6 | 8.5 | 32.2 | 82.7 | 114.9 |
| 55–64 | - | 0.3 | 0.3 | 25.0 | 74.8 | 99.7 |
| 65–74 | - | - | - | 22.9 | 38.6 | 61.5 |
| 75 and over | - | - | - | 24.9 | 26.8 | 51.6 |
| Total | 4.5 | 50.1 | 54.6 | 135.4 | 337.1 | 472.5 |
– = nil.
Source: FaCSIA analysis of ABS 2003 Survey of Disability, Ageing and Carers Confidentialised Unit Record File.
Figure 3: Primary carers, age distribution, 2003
Source: FaCSIA analysis of ABS 2003 Survey of Disability, Ageing and Carers Confidentialised Unit Record File.
[ Return to Top Return to Section ]
2.3 States and territories
The proportion of primary carers of children with severe or profound core activity limitations varied across the states and territories. Nationally, primary carers of children with severe or profound core activity limitations accounted for 12% of all primary carers. In Western Australia, primary carers of children with severe or profound core activity limitations accounted for 18% of all primary carers (Table 5).
| Primary carers of children with severe or profound core activity limitations | All primary carers | |||
|---|---|---|---|---|
| State/territory | (’000) | % | (’000) | % |
| New South Wales | 15.1 | 10.3 | 146.7 | 100.0 |
| Victoria | 13.1 | 11.1 | 118.9 | 100.0 |
| Queensland | 11.4 | 10.3 | 110.4 | 100.0 |
| South Australia | 5.2 | 14.0 | 37.0 | 100.0 |
| Western Australia | 7.2 | 18.4 | 39.0 | 100.0 |
| Tasmania | 1.3 | 9.0 | 14.5 | 100.0 |
| Australian Capital Territory | 0.6 | 13.8 | 4.0 | 100.0 |
| Australia(a) | 54.6 | 11.6 | 472.5 | 100.0 |
(a) Includes Northern Territory.
Source: FaCSIA analysis of ABS 2003 Survey of Disability, Ageing and Carers Confidentialised Unit Record File.
[ Return to Top Return to Section ]
2.4 Relationship to care recipient
The majority of primary carers of children with severe or profound core activity limitations were mothers (91%) (Table 6).
| Primary carer | (’000) | % |
|---|---|---|
| Mother | 49.4 | 91.1 |
| Father | 4.5 | 7.8 |
| Female friend or relative | 0.7 | 1.1 |
| Male friend or relative | - | - |
| Total | 54.6 | 100.0 |
– = nil.
Source: AIHW 2006, Disability updates: children with disabilities, Bulletin 42.
[ Return to Top Return to Section ]
2.5 Assistance with core activities
The majority of primary carers of children with severe or profound core activity limitations provided assistance with self-care (76%) and communication (67%). Less than half (45%) provided assistance with mobility (Table 7).
| Primary carer | (’000) | % |
|---|---|---|
| Self-care | 42.2 | 76.0 |
| Mobility | 25.6 | 44.9 |
| Communication | 37.2 | 67.2 |
| Total | 54.6 | 100.0 |
Source: AIHW 2006, Disability updates: children with disabilities, Bulletin 42.
[ Return to Top Return to Section ]
2.6 Hours of care
The majority (32,200 or 59%) of primary carers of children aged 0–14 years with severe or profound core activity limitations provided more than 40 hours of care per week (Table 8).
| Primary carer | (’000) | % |
|---|---|---|
| Less than 20 hours | 6.2 | 11.4 |
| 20 to less than 40 hours | 12.3 | 22.5 |
| 40 hours or more | 32.2 | 59.0 |
| Not stated | 3.9 | 7.1 |
| Total | 54.6 | 100.0 |
Source: AIHW 2006, Disability updates: children with disabilities, Bulletin 42.
[ Return to Top Return to Section ]
2.7 Need for support
Almost half (48%) of primary carers of children with severe or profound core limitations reported needing more support. Of these primary carers, 40% reported more respite care as their greatest need and 34% reported financial assistance as their greatest need (Table 9).
| (’000) | % | |
|---|---|---|
| Overall need | ||
| Needs more support | 27.2 | 47.7 |
| Does not need more support | 22.6 | 41.9 |
| Not stated | 4.8 | 10.5 |
| Total | 54.6 | 100.0 |
| Greatest need(a) | ||
| More respite care | 11.1 | 40.4 |
| Financial assistance | 9.2 | 34.0 |
| More physical assistance | 0.9 | 3.4 |
| More emotional assistance | 2.2 | 8.5 |
| Improvement in own health | 1.6 | 5.9 |
| Other | 2.2 | 8.0 |
| Total | 27.2 | 100.0 |
(a) Includes only primary carers who reported needing more support.
Source: AIHW 2006, Disability updates: children with disabilities, Bulletin 42.
Access Economics (2005) reported that 37.2% of all primary carers felt they needed more support in their caring role. However, the need for more support varied depending on the type of disability of the care recipient. Carers of people with an intellectual disability (53%) and a psychological disability (44%) were most likely to report needing additional assistance. Carers of people with a sensory or speech disability (24%) or a physical disability (35%) were the least likely to report needing additional support.
[ Return to Top Return to Section ]
2.8 Effect of caring role on relationships
Most primary carers of a child with a severe or profound core activity limitation reported that their relationship with the child was either unaffected (44%) or was closer (37%) as a result of their caring role (AIHW 2006). However, around 36% of carers reported that their relationship with their spouse was strained, that they were losing touch or lacked time together alone. One-quarter (25%) reported that they had lost, or were losing, touch with friends. Around 39% reported that they had less time to spend with other family members.
| Child | Spouse/partner | Other family | Friends(a) | |||||
|---|---|---|---|---|---|---|---|---|
| (’000) | % | (’000) | % | (’000) | % | (’000) | % | |
| Unaffected | 24.0 | 44.0 | 14.5 | 33.0 | 15.2 | 31.1 | 24.9 | 46.2 |
| Closer | 20.4 | 37.3 | 8.8 | 19.3 | 3.1 | 6.1 | 2.9 | 5.1 |
| Losing touch/lack of time alone | - | - | 9.8 | 21.6 | 20.8 | 38.8 | 13.6 | 24.5 |
| Strained | 6.5 | 11.2 | 6.7 | 14.6 | 6.9 | 12.9 | - | - |
| Other effect | - | - | - | - | 1.6 | 3.0 | 9.8 | 17.2 |
| Not stated | 3.7 | 7.5 | 4.6 | 11.5 | 3.7 | 8.1 | 3.4 | 7.0 |
| Total | 54.6 | 100.0 | 44.5 | 100.0 | 51.3 | 100.0 | 54.6 | 100.0 |
– = nil.
(a) Primary carers who reported that their circle of friends increased are included in the row labelled ‘Closer’ and primary carers who reported that their circle of friends changed are included in the row labelled ‘Other effect’.
Source: AIHW 2006, Disability updates: children with disabilities, Bulletin 42.
[ Return to Top Return to Section ]
2.9 Labour force participation
In 2003, the majority (61%) of all primary carers were not in the labour force. The labour force participation characteristics of all primary carers and primary carers of children with severe or profound core activity limitations were similar. Around 61% were not in the labour force, 38% were employed, and 1% were unemployed. A lower proportion of primary carers of children with severe or profound core activity limitations (11%) were employed full time compared to all primary carers (17%) and a higher proportion were employed part time (27% compared to 21%) (ABS 2004).
| Primary carers of children with severe or profound core activity limitations | All primary carers | Not a carer(a) | ||||
|---|---|---|---|---|---|---|
| Labour force participation | (’000) | % | (’000) | % | (’000) | % |
| Employed full-time | 5.8 | 10.7 | 82.1 | 17.4 | 6,013.2 | 45.4 |
| Employed part-time | 14.8 | 27.2 | 96.7 | 20.5 | 2,518.7 | 19.0 |
| Unemployed, looking for full-time work | 0.2 | 0.4 | 4.9 | 1.0 | 312.7 | 2.4 |
| Unemployed, looking for part-time work | 0.2 | 0.3 | 0.2 | - | 159.8 | 1.2 |
| Not in the labour force | 33.5 | 61.4 | 288.7 | 61.1 | 4,242.8 | 32.0 |
| Total | 54.6 | 100.0 | 472.5 | 100.0 | 13,247.1 | 100.0 |
– = nil.
(a) Persons aged 15 years and over.
Source: FaCSIA analysis of ABS 2003 Survey of Disability, Ageing and Carers Confidentialised Unit Record File.
Labour force participation by age of child
The labour force participation of primary carers of children with severe or profound core activity limitations varied depending on the age of the child. These carers were less likely to be employed full-time when the child they cared for was 0–4 years (2%), compared to when the child was aged 10–14 years (11%). Primary carers of children with severe or profound core activity limitations were more likely to not be in the labour force (63%) compared to primary carers of children aged 10–14 years with severe or profound core activity limitations (57%).
| Age of child | ||||||||
|---|---|---|---|---|---|---|---|---|
| 0–4 years | 5–9 years | 10–14 years | Total | |||||
| Labour force participation | (’000) | % | (’000) | % | (’000) | % | (’000) | % |
| Employed full-time | 0.3 | 2.2 | 2.9 | 17.5 | 2.6 | 11.3 | 5.8 | 10.7 |
| Employed part-time | 5.2 | 34.8 | 2.4 | 14.8 | 7.2 | 31.1 | 14.8 | 27.2 |
| Unemployed, looking for full time work | - | - | - | - | 0.2 | 1.0 | 0.2 | 0.4 |
| Unemployed, looking for part time work | - | - | 0.2 | 1.0 | - | - | 0.2 | 0.3 |
| Not in the labour force | 9.5 | 63.0 | 11.0 | 66.7 | 13.0 | 56.6 | 33.5 | 61.4 |
| Total | 15.1 | 100.0 | 16.5 | 100.0 | 23.0 | 100.0 | 54.6 | 100.0 |
– = nil.
Source: FaCSIA analysis of ABS 2003 Survey of Disability, Ageing and Carers Confidentialised Unit Record File.
Labour force participation of mothers
The majority (62%) of mothers who were primary carers of children with severe or profound core activity limitations were not in the labour force, compared to 37% of all mothers of children of the same age (Table 13).
| Mothers who were primary carers of children with severe or profound core activity limitations | All mothers of children | |||
|---|---|---|---|---|
| Labour force participation | (’000) | % | (’000) | % |
| Employed full-time | 4.8 | 9.6 | 502.9 | 22.7 |
| Employed part-time | 13.7 | 27.7 | 823.5 | 37.2 |
| Unemployed looking for full-time work | - | - | 21.5 | 1.0 |
| Unemployed looking for part-time work | 0.2 | 0.3 | 56.5 | 2.6 |
| Not in the labour force | 30.8 | 62.6 | 811.9 | 36.6 |
| Total | 49.4 | 100.0 | 2,216.4 | 100.0 |
– = nil.
Source: AIHW 2006, Disability updates: children with disabilities, Bulletin 42.
[ Return to Top Return to Section ]
2.10 Income
The principal source of income for the majority (55%) of primary carers was a government pension or allowance. The proportion was higher for primary carers of children with severe or profound core activity limitations (67%). Around one-quarter of primary carers (26%) reported wages or salary as their principal source of income. The proportion was slightly lower for primary carers of children with severe or profound core activity limitations (24%).
In contrast, 51% of people without caring responsibilities reported wage or salary as their principal source of income and 24% reported a government pension or allowance. The median gross personal weekly income for a primary carer was $237 in 2003, compared to $407 for people without caring responsibilities (ABS 2004).
| Primary carers of children with severe or profound core activity limitations | All primary carers | Not a carer | ||||
|---|---|---|---|---|---|---|
| Principal source of personal income | (’000) | % | (’000) | % | (’000) | % |
| Wages or salary | 13.1 | 24.1 | 123.6 | 26.2 | 6,832.3 | 51.6 |
| Unincorporated business income | 3.6 | 6.5 | 21.5 | 4.6 | 955.8 | 7.2 |
| Government pension or allowance | 36.4 | 66.7 | 261.1 | 55.3 | 3,163.3 | 23.9 |
| Other(b) | 1.3 | 2.3 | 34.2 | 7.2 | 915.5 | 6.9 |
| Not stated(c) | 0.2 | 0.4 | 32.0 | 6.8 | 1,380.3 | 10.4 |
| Total | 54.6 | 100.0 | 472.5 | 100.0 | 13,247.1 | 100.0 |
(a) Persons aged 15 years and over.
(b) Includes child support or maintenance, worker’s compensation, profit or loss from rental property, dividends and interest, superannuation or annuity, and any other main source not elsewhere classified.
(c) Includes persons who reported no source of income, nil or negative income or main source of income not known.
Source: FaCSIA analysis of ABS 2003 Survey of Disability, Ageing and Carers Confidentialised Unit Record File.
Around 31% of primary carers of children with severe or profound core activity limitations were in the bottom two income quintiles, compared to 50% of primary carers overall and 34% of people without caring responsibilities (Table 15).
| Primary carers of children with severe or profound core activity limitations | All primary carers | Not a carer(a) | ||||
|---|---|---|---|---|---|---|
| Quintile | (’000) | % | (’000) | % | (’000) | % |
| First | 9.4 | 17.2 | 67.6 | 14.3 | 2,363.1 | 17.8 |
| Second | 7.8 | 14.2 | 169.9 | 36.0 | 2,107.4 | 15.9 |
| Third | 22.6 | 41.3 | 92.9 | 19.7 | 2,256.4 | 17.0 |
| Fourth | 7.7 | 14.1 | 50.9 | 10.8 | 2,360.7 | 17.8 |
| Fifth | 3.6 | 6.6 | 38.8 | 8.2 | 2,437.5 | 18.4 |
| Unknown | 3.6 | 6.5 | 52.4 | 11.1 | 1,722.1 | 13.0 |
| Total | 54.6 | 100.0 | 472.5 | 100.0 | 13,247.1 | 100.0 |
(a) Persons aged 15 years and over.
Source: FaCSIA analysis of ABS 2003 Survey of Disability, Ageing and Carers Confidentialised Unit Record File.
[ Return to Top Return to Section ]
2.11 Work preferences and barriers to labour force participation
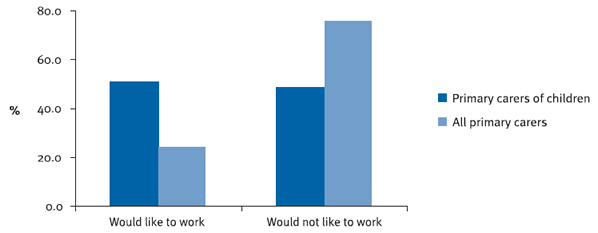
The 2003 SDAC asked whether the primary carer would like to be employed while caring. This question was asked of all primary carers living in households, who were unemployed or not in the labour force and were not retired. Of those applicable primary carers of children with severe or profound core activity limitations, just over half (51%) reported that they would like to work. In contrast, of the applicable primary carers less than one-quarter (24%) reported that they would like to work (Figure 4).
Figure 4: Preference for work while caring, all primary carers and primary carers of children with severe or profound core activity limitations, 2003(a)
(a) Population of primary carers living in households, who were unemployed or not in the labour force and were not retired.
Source: FaCSIA analysis of ABS 2003 Survey of Disability, Ageing and Carers Confidentialised Unit Record File.
Of those who expressed a preference to work, almost half (47%) of primary carers of children with severe or profound core activity limitations reported that no alternative care arrangement was their main perceived barrier to re-entering the workforce. A further 23% reported that difficulty in arranging working hours was their main barrier. Similarly, 32% of all primary carers reported no alternative care arrangement as their main barrier (Table 16).
| Primary carers of children with severe or profound core activity limitations | All primary carers | |||
|---|---|---|---|---|
| Perceived barrier to re-entering workforce while caring | (’000) | % | (’000) | % |
| No alternative care arrangement available | 8.3 | 47 | 22.0 | 32.0 |
| Disruption to main recipient of care | 1.6 | 9.3 | 7.7 | 11.2 |
| Difficulty in arranging working hours | 4.0 | 23.2 | 10.9 | 15.9 |
| Loss of skills from being out of workforce | 0.4 | 2.1 | 3.0 | 4.4 |
| Age | 0.3 | 1.7 | 9.6 | 13.9 |
| Other difficulty | 2.8 | 16.3 | 14.5 | 21.1 |
| No difficulties | - | - | 1.1 | 1.6 |
| Total(a) | 17.4 | 100.0 | 68.8 | 100.0 |
– = nil.
(a) Population of primary carers living in households, who were unemployed or not in the labour force and were not retired and would like to work while caring for main recipient of care.
Source: FaCSIA analysis of ABS 2003 Survey of Disability, Ageing and Carers Confidentialised Unit Record File.
3. Carer Payment recipients
3.1 Number of recipients
At June 2007, there were 3,572 Carer Payment (CP) (child) recipients, accounting for approximately 3.1% of all CP recipients (116,614 recipients).
Around 91% of CP (child) recipients also received Carer Allowance (CA) (child) (3,234 recipients).
3.2 Age and sex
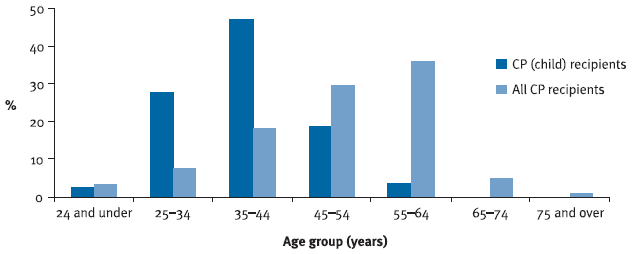
The CP (child) recipient population was younger than the total CP recipient population. CP (child) recipients were most commonly aged 35–44 years (47%), while CP recipients overall were most commonly aged 55–64 years (36%) (Table 17 and Figure 5).
Around 85% of CP (child) recipients were female compared to 67% of all CP recipients.
| CP (child) recipients (number) | All CP recipients (number) | |||||
|---|---|---|---|---|---|---|
| Age group (years) | Male | Female | Total | Male | Female | Total |
| 24 and under | np | np | 95 | 1,404 | 2,447 | 3,851 |
| 25–34 | 91 | 898 | 989 | 3,125 | 5,477 | 8,602 |
| 35–44 | 239 | 1,441 | 1,680 | 6,872 | 14,091 | 20,963 |
| 45–54 | 156 | 514 | 670 | 9,817 | 24,599 | 34,416 |
| 55–64 | 38 | 86 | 124 | 13,576 | 28,238 | 41,814 |
| 65–74 | np | np | np | 2,824 | 2,961 | 5,785 |
| 75 and over | np | np | np | 521 | 662 | 1,183 |
| Total | 534 | 3,038 | 3,572 | 38,139 | 78,475 | 116,614 |
np = not published due to small numbers.
Source: Centrelink administrative data, 2007.
Figure 5: CP recipients, age distribution, June 2007
Source: Centrelink administrative data, 2007.
[ Return to Top Return to Section ]
3.3 States, territories and regional distribution
The proportion of CP (child) recipients varies across the states and territories. At June 2007, CP (child) recipients accounted for 3.1% of all CP recipients nationally. The Australian Capital Territory (4.6%) and Queensland (3.7%) exceeded this proportion, while New South Wales (2.8%) and Western Australia (2.9%) fell below it (Table 18).
| CP (child) (number) | All CP recipients (number) | Proportion of CP (child) to all CP recipients (%) | |
|---|---|---|---|
| State/territory | |||
| New South Wales | 1,190 | 43,059 | 2.8 |
| Victoria | 871 | 29,487 | 3 |
| Queensland | 825 | 22,158 | 3.7 |
| South Australia | 274 | 8,900 | 3.1 |
| Western Australia | 215 | 7,437 | 2.9 |
| Tasmania | 144 | 4,185 | 3.4 |
| Northern Territory | 20 | 578 | 3.5 |
| Australian Capital Territory | 31 | 674 | 4.6 |
| Total | 3,572 | 116,614 | 3.1 |
Source: Centrelink administrative data, 2007.
The proportion of CP (child) recipients to all CP recipients varied within the states. For example in New South Wales, Northern Statistical Division (5.9%) and Murrumbidgee Statistical Division (4.2%) had the highest proportion of CP (child) recipients compared to all CP recipients in those Statistical Divisions (Table 19).
| CP (child) recipients (number) | All CP recipients (number) | Proportion of CP (child) to all CP recipients (%) | |
|---|---|---|---|
| Statistical Division(a) | |||
| New South Wales(b) | 1,190 | 43,059 | 2.8 |
| Sydney | 587 | 23,613 | 2.5 |
| Hunter | 136 | 4,868 | 2.8 |
| Illawarra | 75 | 3,321 | 2.3 |
| Richmond–Tweed | 62 | 1,949 | 3.2 |
| Mid-North Coast | 115 | 3,484 | 3.3 |
| Northern | 74 | 1,245 | 5.9 |
| North Western | 24 | 803 | 3 |
| Central West | 24 | 1,100 | 2.2 |
| South Eastern | 29 | 1,067 | 2.7 |
| Murrumbidgee | 35 | 826 | 4.2 |
| Murray | np | 567 | np |
| Far West | np | 227 | np |
| Victoria(b) | 871 | 29,487 | 3.0 |
| Melbourne | 575 | 19,947 | 2.9 |
| Barwon | 46 | 1,703 | 2.7 |
| Western District | np | 574 | np |
| Central Highlands | 43 | 1,110 | 3.9 |
| Wimmera | np | 305 | np |
| Mallee | 21 | 620 | 3.4 |
| Loddon | 30 | 1,366 | 2.2 |
| Goulburn | 41 | 1,446 | 2.8 |
| Ovens–Murray | 27 | 548 | 4.9 |
| East Gippsland | 27 | 617 | 4.4 |
| Gippsland | 31 | 1,224 | 2.5 |
| Queensland(b) | 825 | 22,158 | 3.7 |
| Brisbane | 362 | 8,173 | 4.4 |
| Gold Coast | 98 | 2,812 | 3.5 |
| Sunshine Coast | 78 | 1,641 | 4.8 |
| West Moreton | np | 671 | np |
| Wide Bay–Burnett | 95 | 3,404 | 2.8 |
| Darling Downs | 39 | 1,426 | 2.7 |
| South West | np | 113 | np |
| Fitzroy | 35 | 890 | 3.9 |
| Central West | np | 44 | np |
| Mackay | np | 740 | np |
| Northern | 34 | 1,024 | 3.3 |
| Far North | 34 | 1,135 | 3.0 |
| North West | np | 88 | np |
| South Australia(b) | 274 | 8,900 | 3.1 |
| Adelaide | 204 | 6,168 | 3.3 |
| Outer Adelaide | np | 658 | np |
| Yorke and Lower North | np | 407 | np |
| Murray Lands | np | 481 | np |
| South East | np | 258 | np |
| Eyre | np | 172 | np |
| Northern | np | 761 | np |
| Western Australia(b) | 215 | 7,437 | 2.9 |
| Perth | 153 | 5,114 | 3.0 |
| South West | 22 | 944 | 2.3 |
| Lower Great Southern | np | 243 | np |
| Upper Great Southern | np | 72 | np |
| Midlands | np | 249 | np |
| South Eastern | np | 156 | np |
| Central | np | 313 | np |
| Pilbara | np | 56 | np |
| Kimberley | np | 274 | np |
| Tasmania(b) | 144 | 4,185 | 3.4 |
| Greater Hobart | 58 | 1,500 | 3.9 |
| Southern | np | 418 | np |
| Northern | 45 | 1,187 | 3.8 |
| Mersey–Lyell | np | 1,078 | np |
np = not published due to small numbers.
(a) Based on postcode concordance to Australian Bureau of Statistics 2006 Australian Standard Geographical Classification boundaries.
(b) Indicative data only. Data by Statistical Divisions for states will not sum to state totals due to confidentialised cells and unknown postcodes.
Source: Centrelink administrative data, 2007.
[ Return to Top Return to Section ]
3.4 Marital status
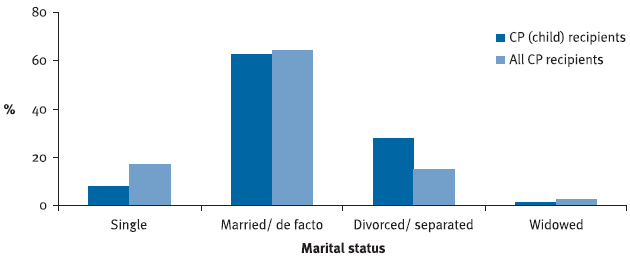
At June 2007, the proportion of CP (child) recipients who were married or de facto (63%) was comparable to that of all CP recipients (65%). A lower proportion of CP (child) recipients were single (8% compared to 17% for all CP recipients). A higher proportion of CP (child) recipients were divorced or separated (28% compared to 15%). There was also a lower proportion of widows among CP (child) recipients (1%) compared to all CP recipients (3%) (Table 20 and Figure 6).
| CP (child) recipients | All CP recipients | |||
|---|---|---|---|---|
| Marital status | Number | % | Number | % |
| Single | 283 | 7.9 | 20,133 | 17.3 |
| Married/de facto | 2,239 | 62.7 | 75,462 | 64.7 |
| Divorced/separated | 999 | 28 | 17,678 | 15.2 |
| Widowed | 51 | 1.4 | 3,341 | 2.9 |
| Total | 3,572 | 100 | 116,614 | 100.0 |
Source: Centrelink administrative data, 2007.
Figure 6: CP recipients, marital status, June 2007
Source: Centrelink administrative data, 2007.
[ Return to Top Return to Section ]
3.5 Indigenous recipients
There were around 150 Indigenous recipients of CP (child) and 4,085 Indigenous recipients of CP in total. Indigenous recipients accounted for 4.2% of CP (child) recipients and 3.5% of all CP recipients (Table 21).
| CP (child) recipients | All CP recipients | |||
|---|---|---|---|---|
| Indigenous status | Number | % | Number | % |
| Indigenous | 150 | 4.2 | 4,085 | 3.5 |
| Non-Indigenous | 3,172 | 88.8 | 103,753 | 89.0 |
| Unknown | 250 | 7.0 | 8,776 | 7.5 |
| Total | 3,572 | 100.0 | 116,614 | 100.0 |
Source: Centrelink administrative data, 2007.
[ Return to Top Return to Section ]
3.6 Multiple care
Around 95% (3,390) of CP (child) recipients cared for one child only, 4% (160) cared for two children and the remaining 1% cared for three or more children.
There was 0.92 CP (child) recipient for every child receiving care and 0.99 CP recipient for every care receiver.
3.7 Country of birth of recipients
A higher proportion of CP (child) recipients were born in Australia (77%) compared to all CP recipients (64%) (Table 22).
| CP (child) recipients | All CP recipients | ||||
|---|---|---|---|---|---|
| Country of birth | Number | % | Country of birth | Number | % |
| Australia | 2,740 | 76.7 | Australia | 74,950 | 64.3 |
| United Kingdom | 146 | 4.1 | United Kingdom | 6,725 | 5.8 |
| Vietnam | 85 | 2.4 | Lebanon | 3,464 | 3 |
| Lebanon | 81 | 2.3 | Vietnam | 2,682 | 2.3 |
| New Zealand | 71 | 2.0 | Italy | 2,260 | 1.9 |
| Iraq | 46 | 1.3 | Iraq | 2,225 | 1.9 |
| China | 35 | 1 | Greece | 1,752 | 1.5 |
| Philippines | 31 | 0.9 | New Zealand | 1,713 | 1.5 |
| Turkey | np | np | Yugoslavia | 1,506 | 1.3 |
| Afghanistan | np | np | Philippines | 1,308 | 1.1 |
| Fiji | np | np | China | 1,102 | 0.9 |
| Other | 286 | 8 | Other | 16,927 | 14.5 |
| Total overseas-born | 832 | 23.3 | Total overseas-born | 41,664 | 35.7 |
| Total | 3,572 | 100.0 | Total | 116,614 | 100.0 |
np = not published due to small numbers. Source: Centrelink administrative data, 2007.
[ Return to Top Return to Section ]
3.8 Total duration on payment
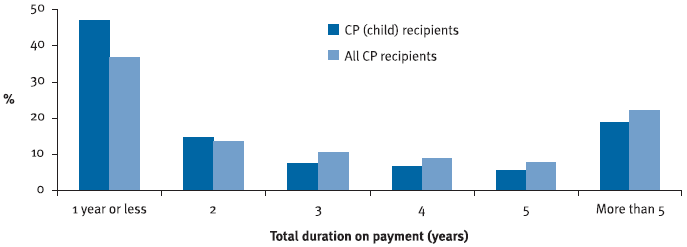
At June 2007, the majority of CP (child) recipients had been on the payment for one year or less (47%), compared to 37% of all CP recipients (Table 23 and Figure 7). It should be noted that there were additional behavioural criteria introduced on 1 July 2006 that allowed more people to claim the payment.
| CP (child) recipients | All CP recipients | |||
|---|---|---|---|---|
| Duration (years) | Number | % | Number | % |
| One year or less | 1,670 | 46.8 | 42,910 | 36.8 |
| 2 | 526 | 14.7 | 15,814 | 13.6 |
| 3 | 266 | 7.4 | 12,379 | 10.6 |
| 4 | 237 | 6.6 | 10,571 | 9.1 |
| 5 | 200 | 5.6 | 8,914 | 7.6 |
| More than 5 years | 673 | 18.8 | 26,026 | 22.3 |
| Total | 3,572 | 100.0 | 116,614 | 100.0 |
Source: Centrelink administrative data, 2007.
Figure 7: CP recipients, total duration on payment, June 2007
Source: Centrelink administrative data, 2007.
3.9 Homeownership of recipients
A lower proportion of CP (child) recipients (42%) were homeowners compared to all CP recipients (49%) (Figure 8).
Figure 8: CP recipients, homeownership, June 2007

Source: Centrelink administrative data, 2007.
[ Return to Top Return to Section ]
3.10 Claims, grants and rejections
In the past two financial years (2004–05 and 2005–06), 12% of CP (child) claims were granted. In 2004–05 the most common reason for rejection (73% of rejections) was that the child did not meet the definition of a ‘profoundly disabled child’ (Table 24).
| Grants | Rejections | Claims | ||||
|---|---|---|---|---|---|---|
| Financial year | Number | % | no. | % | Number | |
| 2004–05 | 502 | 12.0 | 3,791 | 88.0 | 4,293 | |
| 2005–06 | 591 | 12.0 | 4,299 | 88.0 | 4,890 | |
(a) The above data is a count of claims made in the financial years, not a count of customers who lodged claims. It is possible for customers to have more than one claim record (e.g. a rejected claim can be followed by a granted claim).
Source: Centrelink administrative data.
The grant rate for CP (child) is much lower than for CP overall. The grant rate for all CP recipients was 66% in both 2004–05 and in 2005–06.
[ Return to Top Return to Section ]
3.11 Rate of payment
Around 80% (93,600) of CP recipients received the maximum rate of payment in June 2007. In comparison, approximately 73% of CP (child) customers in May 2007 received the maximum rate of payment.
The proportion of CP (child) customers who received the maximum rate of payment varied across the states and territories. CP (child) customers in the Northern Territory were most likely to receive the maximum rate of payment (80%), while customers in the Australian Capital Territory were least likely to receive the maximum rate (60%). It should be noted that these proportions are based on small numbers of customers. Among the other states, customers in Tasmania were most likely to receive the maximum rate of payment (80%), while customers in Victoria were least likely (70%) (Table 25).
| Less than maximum rate (number) | Maximum rate (number) | Total CP (child) customers (number) | Proportion on maximum rate (%) | |
|---|---|---|---|---|
| State/territory | ||||
| New South Wales | 264 | 793 | 1,057 | 75 |
| Victoria | 239 | 550 | 789 | 70 |
| Queensland | 201 | 570 | 771 | 73.9 |
| South Australia | 66 | 184 | 250 | 73.6 |
| Western Australia | 53 | 145 | 198 | 73.2 |
| Tasmania | 26 | 104 | 130 | 80 |
| Northern Territory | np | np | np | 85 |
| Australian Capital Territory | np | np | np | 60 |
| Total | 864 | 2,381 | 3,245 | 73.4 (average) |
np = not published due to small numbers and confidentiality concerns.
(a) Data for June 2007 was not available at time of publication.
Source: Centrelink administrative data, 2007.
[ Return to Top Return to Section ]
3.12 Care receivers of CP recipients
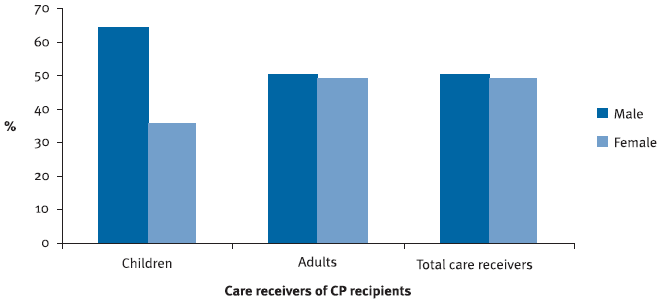
At June 2007 there were 3,862 children (0–15 years) and 113,855 adults receiving care from CP recipients (Table 26).
| Children | Adults | Total care receivers | ||||
|---|---|---|---|---|---|---|
| Sex | Number | % | Number | % | Number | % |
| Male | 2,477 | 64.1 | 57,604 | 50.6 | 60,081 | 51.0 |
| Female | 1,383 | 35.8 | 56,251 | 49.4 | 57,634 | 49.0 |
| Total | 3,862 | 100.0 | 113,855 | 100.0 | 117,717 | 100.0 |
Source: Centrelink administrative data, 2007.
Around 64% of children receiving care were male, while 51% of adults receiving care were male (Figure 9).
Figure 9: Care receivers of CP recipients, sex, June 2007
Source: Centrelink administrative data, 2007.
[ Return to Top Return to Section ]
3.13 Care receivers of CP recipients across states and territories
The proportion of children receiving care from CP recipients varied across the states and territories. The states or territories with the highest proportion of children receiving care were the Australian Capital Territory (4.5%) and Queensland (4.0%). Children accounted for 2.9% of care receivers in New South Wales (Table 27).
| Children | Adults | Total care receivers | ||||
|---|---|---|---|---|---|---|
| State/territory | Number | % | Number | % | Number | % |
| New South Wales | 1,268 | 2.9 | 42,235 | 97.1 | 43,503 | 100.0 |
| Victoria | 957 | 3.2 | 28,750 | 96.8 | 29,707 | 100.0 |
| Queensland | 901 | 4 | 21,475 | 96 | 22,376 | 100.0 |
| South Australia | 290 | 3.2 | 8,762 | 96.8 | 9,052 | 100.0 |
| Western Australia | 236 | 3.2 | 7,221 | 96.8 | 7,457 | 100.0 |
| Tasmania | 155 | 3.7 | 4,085 | 96.3 | 4,240 | 100.0 |
| Northern Territory | 20 | 3.3 | 578 | 96.7 | 598 | 100.0 |
| Australian Capital Territory | 33 | 4.9 | 647 | 95.1 | 680 | 100.0 |
| Total(a) | 3,862 | 3.3 | 113,855 | 96.7 | 117,717 | 100.0 |
(a) Includes overseas residents and people whose state or territory was not specified.
Source: Centrelink administrative data, 2007.
[ Return to Top Return to Section ]
3.14 Medical conditions of children receiving care from CP recipients
The most common medical condition for males and females under the care of CP (child) recipients was severe multiple mobility disability (18% of males and 27% of females). For boys, the next most commonly reported conditions were autistic disorder (17%) and attention deficit/hyperactivity disorder (17%). For girls, the next most commonly reported conditions were IQ less than 55 (13%) and autistic disorder (9%) (Table 28).
| Top 10 first-listed medical conditions | |||||
|---|---|---|---|---|---|
| Males | Number | % | Females | Number | % |
| Severe multiple disability – mobility | 443 | 17.9 | Severe multiple disability – mobility | 369 | 26.7 |
| Autistic disorder | 425 | 17.2 | IQ less than 55 | 174 | 12.6 |
| Attention deficit/hyperactivity disorder | 216 | 8.7 | Autistic disorder | 122 | 8.8 |
| IQ less than 55 | 214 | 8.6 | Cerebral palsy | 73 | 5.3 |
| Learning disability | 151 | 6.1 | Learning disability | 65 | 4.7 |
| Cerebral palsy | 131 | 5.3 | Down syndrome | 42 | 3 |
| Asperger's disorder | 114 | 4.6 | Attention deficit/hyperactivity disorder | 37 | 2.7 |
| Down syndrome | 87 | 3.5 | Rett syndrome | 29 | 2.1 |
| Bilateral blindness | 46 | 1.9 | Other chromosomal or syndromic condition | 26 | 1.9 |
| Leukaemia, haemophagocytic lymphohistiocystosis and other childhood malignancies | 46 | 1.9 | Bilateral blindness | 26 | 1.9 |
| Other | 604 | 24.4 | Other | 420 | 30.4 |
| Total | 2,477 | 100 | Total | 1,383 | 100.0 |
Source: Centrelink administrative data, 2007.
3.15 Treating health professional for children receiving care from CP recipients
Around 76% of children receiving care from CP recipients were treated by a medical practitioner and 23% were treated by a child specialist.
[ Return to Top Return to Section ]
3.16 Profound disability categories of children receiving care from CP recipients.
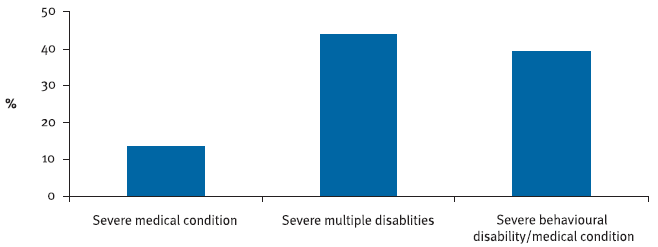
Around 44% of children receiving care from a CP recipient had severe multiple disabilities and around 39% had severe behavioural disabilities or medical conditions (Figure 10).
Figure 10: Children receiving care from CP recipients, profound disability category, June 2007
Source: Centrelink administrative data, 2007.
4. Carer Allowance recipients
4.1 Number of recipients
At June 2007, there were 109, 118 Carer Allowance (CA) (child) recipients, accounting for approximately 28% of all CA recipients (393,263 recipients).
4.2 Age and sex
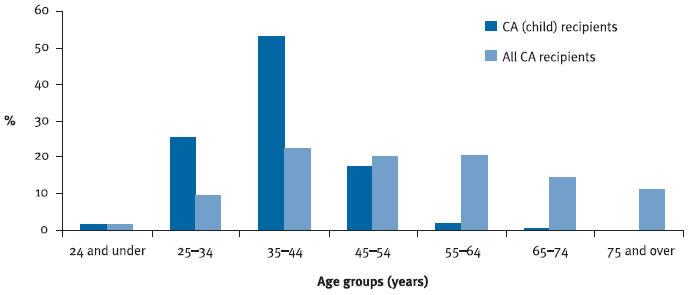
The age distribution of CA (child) recipients was more heavily skewed towards the younger age groups, while the age distribution of all CA recipients was more evenly distributed. The highest proportions of the CA (child) recipient population and the total CA recipient population were aged 35–44 years (53% and 23% respectively) (Table 29 and Figure 11).
Around 94% of CA (child) recipients were female compared to 76% of all CA recipients.
| CA (child) recipients (number) | All CA recipients (number) | |||||
|---|---|---|---|---|---|---|
| Male | Female | Total | Male | Female | Total | |
| Age group (years) | ||||||
| 24 and under | np | np | 1,724 | 1,829 | 4,806 | 6,635 |
| 25–34 | 967 | 27,063 | 28,030 | 4,620 | 33,863 | 38,483 |
| 35–44 | 3,204 | 54,780 | 57,984 | 11,977 | 76,750 | 88,727 |
| 45–54 | 1,853 | 17,230 | 19,083 | 16,194 | 62,471 | 78,665 |
| 55–64 | 402 | 1,519 | 1,921 | 20,664 | 59,987 | 80,651 |
| 65–74 | 75 | 262 | 337 | 20,001 | 35,616 | 55,617 |
| 75 and over | np | np | 39 | 20,670 | 23,815 | 44,485 |
| Total | 6,549 | 102,569 | 109,118 | 95,955 | 297,308 | 393,263 |
np = not published due to small numbers.
(a) Excludes recipients who were eligible only for the Child Health Care Card.
Source: Centrelink administrative data, 2007.
Figure 11: CA recipients,(a) age distribution, June 2007
(a) Excludes recipients who were eligible only for the Child Health Care Card.
Source: Centrelink administrative data, 2007.
[ Return to Top Return to Section ]
4.3 States, territories and regional distribution
The proportion of CA (child) recipients varies across the states and territories. At June 2007, 28% of CA recipients were CA (child) recipients nationally. The Australian Capital Territory (38%) and the Northern Territory (36%) had the higher proportion of CA (child) recipients, while Tasmania (24%) and New South Wales (27%) had the lowest proportions (Table 30).
| CA (child) recipients (number) | All CA recipients (number) | Proportion of CA (child) to all CA recipients (%) | |
|---|---|---|---|
| State/territory | |||
| New South Wales | 35,530 | 133,608 | 26.6 |
| Victoria | 28,266 | 103,550 | 27.3 |
| Queensland | 20,954 | 75,719 | 27.7 |
| South Australia | 9,811 | 33,028 | 29.7 |
| Western Australia | 9,740 | 30,216 | 32.2 |
| Tasmania | 2,689 | 11,277 | 23.8 |
| Northern Territory | 621 | 1,745 | 35.6 |
| Australian Capital Territory | 1,505 | 3,999 | 37.6 |
| Total(b) | 109,118 | 393,263 | 27.7 |
(a) Excludes recipients who were eligible only for the Child Health Care Card.
(b) Includes overseas residents and people whose state or territory was not specified.
Source: Centrelink administrative data, 2007.
The proportion of CA (child) recipients to all CA recipients varied within the states. For example in New South Wales, Murrumbidgee Statistical Division (30.6%) and Central West (30.3%) had the highest proportion of CA (child) recipients compared to all CA recipients in those Statistical Divisions (Table 31).
| CA (child) recipients (number) | All CA recipients (number) | Proportion of CA (child) to all CA recipients (%) | |
|---|---|---|---|
| Statistical Division(a) | |||
| New South Wales(b) | 35,530 | 133,608 | 26.6 |
| Sydney | 20,816 | 72,419 | 28.7 |
| Hunter | 3,776 | 15,556 | 24.3 |
| Illawarra | 2,156 | 10,077 | 21.4 |
| Richmond–Tweed | 1,530 | 6,038 | 25.3 |
| Mid-North Coast | 1,825 | 9,061 | 20.1 |
| Northern | 1,021 | 3,563 | 28.7 |
| North Western | 632 | 2,363 | 26.7 |
| Central West | 1,140 | 3,759 | 30.3 |
| South Eastern | 940 | 3,708 | 25.4 |
| Murrumbidgee | 904 | 2,953 | 30.6 |
| Murray | 513 | 2,191 | 23.4 |
| Far West | 132 | 704 | 18.8 |
| Victoria(b) | 28,266 | 103,550 | 27.3 |
| Melbourne | 19,453 | 70,769 | 27.5 |
| Barwon | 1,744 | 6,320 | 27.6 |
| Western District | 596 | 2,080 | 28.7 |
| Central Highlands | 1,010 | 3,491 | 28.9 |
| Wimmera | 287 | 1,038 | 27.6 |
| Mallee | 510 | 1,990 | 25.6 |
| Loddon | 1,034 | 3,953 | 26.2 |
| Goulburn | 1,207 | 4,558 | 26.5 |
| Ovens–Murray | 539 | 2,022 | 26.7 |
| East Gippsland | 607 | 2,054 | 29.6 |
| Gippsland | 1,154 | 4,159 | 27.7 |
| Queensland(b) | 20,954 | 75,719 | 27.7 |
| Brisbane | 10,007 | 31,079 | 32.2 |
| Gold Coast | 2,230 | 9,187 | 24.3 |
| Sunshine Coast | 1,341 | 5,868 | 22.9 |
| West Moreton | 477 | 1,964 | 24.3 |
| Wide Bay–Burnett | 1,827 | 9,041 | 20.2 |
| Darling Downs | 1,228 | 4,538 | 27.1 |
| South West | 89 | 297 | 30.0 |
| Fitzroy | 1,175 | 3,410 | 34.5 |
| Central West | 32 | 141 | 22.7 |
| Mackay | 660 | 2,496 | 26.4 |
| Northern | 877 | 3,525 | 24.9 |
| Far North | 854 | 3,440 | 24.8 |
| North West | 91 | 279 | 32.6 |
| South Australia(b) | 9,811 | 33,028 | 29.7 |
| Adelaide | 7,502 | 24,112 | 31.1 |
| Outer Adelaide | 784 | 2,487 | 31.5 |
| Yorke and Lower North | 221 | 1,200 | 18.4 |
| Murray Lands | 344 | 1,415 | 24.3 |
| South East | 302 | 932 | 32.4 |
| Eyre | 164 | 561 | 29.2 |
| Northern | 457 | 2,056 | 22.2 |
| Western Australia(b) | 9,740 | 30,216 | 32.2 |
| Perth | 7,318 | 21,852 | 33.5 |
| South West | 1,016 | 3,801 | 26.7 |
| Lower Great Southern | 238 | 881 | 27.0 |
| Upper Great Southern | 92 | 265 | 34.7 |
| Midlands | 239 | 826 | 28.9 |
| South Eastern | 258 | 625 | 41.3 |
| Central | 294 | 972 | 30.2 |
| Pilbara | 149 | 247 | 60.3 |
| Kimberley | 93 | 458 | 20.3 |
| Tasmania(b) | 2,689 | 11,277 | 23.8 |
| Greater Hobart | 1,124 | 4,427 | 25.4 |
| Southern | 209 | 985 | 21.2 |
| Northern | 806 | 3,103 | 26.0 |
| Mersey–Lyell | 543 | 2,710 | 20.0 |
(a) Based on postcode concordance to Australian Bureau of Statistics 2006 Australian Standard Geographical Classification boundaries.
(b) Indicative data only. Data by Statistical Divisions for states will not sum to state total due to confidentialised cells and unknown postcodes.
Source: Centrelink administrative data, 2007.
[ Return to Top Return to Section ]
4.4 Marital status
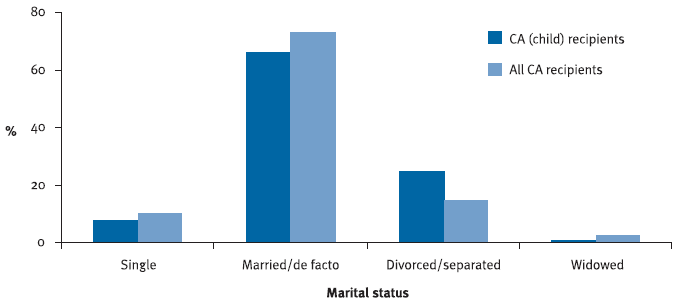
At June 2007, the proportion of CA (child) recipients who were married or de facto (66%) was slightly below that of all CA recipients (73%). A lower proportion of CA (child) recipients were single (8% compared to 10%). A higher proportion of CA (child) recipients were divorced or separated (25% compared to 15%). There was also a lower proportion of widows among CA (child) recipients (1.0%) compared to all CA recipients (2.3%) (Table 32 and Figure 12).
| CA (child) | All CA recipients | |||
|---|---|---|---|---|
| Marital status | Number | % | Number | % |
| Single | 8,374 | 7.7 | 40,017 | 10.2 |
| Married/de facto | 72,450 | 66.4 | 285,801 | 72.7 |
| Divorced/separated | 27,202 | 24.9 | 57,056 | 14.5 |
| Widowed | 1,066 | 1.0 | 9,135 | 2.3 |
| Total | 109,118 | 100.0 | 393,263 | 100.0 |
(a) Excludes recipients who were eligible only for the Child Health Care Card.
Source: Centrelink administrative data, 2007.
Figure 12: CA recipients,(a) marital status, June 2007
(a) Excludes recipients who were eligible only for the Child Health Care Card.
Source: Centrelink administrative data, 2007.
[ Return to Top Return to Section ]
4.5 Indigenous recipients
There were 3,135 Indigenous recipients of CA (child) and 8,517 Indigenous recipients of CA in total. Indigenous recipients accounted for 2.9% of CA (child) recipients and 2.2% of all CA recipients (Table 33).
| CA (child) recipients | All CA recipients | |||
|---|---|---|---|---|
| Indigenous status | Number | % | Number | % |
| Indigenous | 3,135 | 2.9 | 8,517 | 2.2 |
| Non-Indigenous | 94,818 | 86.9 | 352,939 | 89.7 |
| Unknown | 11,165 | 10.2 | 31,807 | 8.1 |
| Total | 109,118 | 100.0 | 393,263 | 100.0 |
(a) Excludes recipients who were eligible only for the Child Health Care Card.
Source: Centrelink administrative data, 2007.
4.6 Multiple care
There is no available data to show exactly how many recipients of CA are caring for more than one care receiver. However, there was 0.84 CA (child) recipient for every child receiving care and 0.93 CA recipient for every care receiver.
4.7 Shared care
Around 99% (108,400) of CA (child) recipients were not providing shared care. Almost 100% (391,600) of all CA recipients were caring alone.
[ Return to Top Return to Section ]
4.8 Country of birth of recipients
A higher proportion of CA (child) recipients were born in Australia (80%) compared to all CA recipients (69%) (Table 34).
| Country of birth | Number | % | Country of birth | Number | % |
|---|---|---|---|---|---|
| Australia | 87,340 | 80.0 | Australia | 272,129 | 69.2 |
| United Kingdom | 5,105 | 4.7 | United Kingdom | 24,538 | 6.2 |
| New Zealand | 2,343 | 2.1 | Italy | 11,707 | 3.0 |
| Vietnam | 1,712 | 1.6 | Greece | 7,718 | 2.0 |
| Lebanon | 1,265 | 1.2 | Lebanon | 6,235 | 1.6 |
| Philippines | 916 | 0.8 | New Zealand | 5,691 | 1.4 |
| China | 663 | 0.6 | Vietnam | 5,484 | 1.4 |
| India | 492 | 0.5 | Serbia & Montenegro | 4,411 | 1.1 |
| Iraq | 483 | 0.4 | Philippines | 3,495 | 0.9 |
| Malaysia | 371 | 0.3 | Iraq | 2,908 | 0.7 |
| South Africa | 371 | 0.3 | Germany | 2,894 | 0.7 |
| Other | 8,057 | 7.4 | Other | 46,053 | 11.7 |
| Total overseas-born | 21,778 | 20.0 | Total overseas-born | 121,134 | 30.8 |
| Total | 109,118 | 100.0 | Total | 393,263 | 100.0 |
(a) Excludes recipients who were eligible only for the Child Health Care Card.
Source: Centrelink administrative data, 2007.
[ Return to Top Return to Section ]
4.9 Total duration on allowance
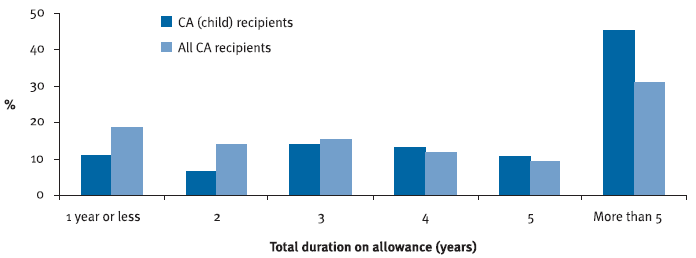
At June 2007, around 45% of CA (child) recipients and 31% of all CA recipients had been receiving the allowance for more than five years. Approximately 11% of CA (child) recipients and 18% of all CA recipients had been receiving the allowance for one year or less (Table 35 and Figure 13).
| CA (child) recipients | All CA recipients | |||
|---|---|---|---|---|
| Duration (years) | Number | % | Number | % |
| One year or less | 11,690 | 10.7 | 72,046 | 18.3 |
| 2 | 7,201 | 6.6 | 55,152 | 14.0 |
| 3 | 15,197 | 13.9 | 60,518 | 15.4 |
| 4 | 14,369 | 13.2 | 46,663 | 11.9 |
| 5 | 11,299 | 10.4 | 36,808 | 9.4 |
| More than 5 years | 49,362 | 45.2 | 122,076 | 31.0 |
| Total | 109,118 | 100.0 | 393,263 | 100.0 |
(a) Excludes recipients who were eligible only for the Child Health Care Card.
Source: Centrelink administrative data, 2007.
Figure 13 : CA recipients,(a) total duration on allowance, June 2007
(a) Excludes recipients who were eligible only for the Child Health Care Card.
Source: Centrelink administrative data, 2007.
[ Return to Top Return to Section ]
4.10 Homeownership of recipients
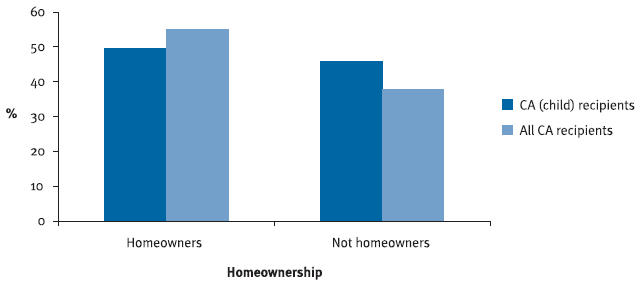
A lower proportion of CA (child) recipients (50%) were homeowners compared to all CA recipients (55%) (Figure 14).
Figure 14: CA recipients,(a) homeownership, June 2007
(a) Excludes recipients who were eligible only for the Child Health Care Card.
Source: Centrelink administrative data, 2007.
4.11 Claims, grants and rejections
In the past two financial years (2004–05 and 2005–06), 73% of all Carer Allowance claims were granted.
[ Return to Top Return to Section ]
4.12 Care receivers of CA recipients
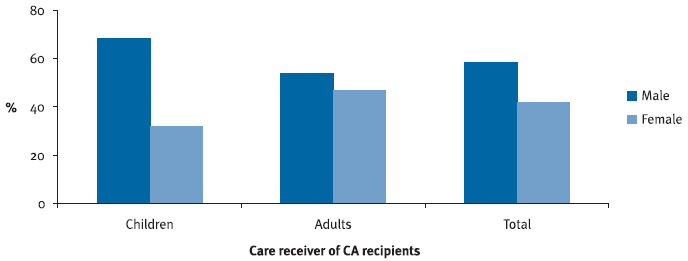
At June 2007 there were 129,298 children (0–15 years) and 292,491 adults receiving care from CA recipients (a total of 421,789) (Table 36).
| Gender | Number | % | Number | % | Number | % |
|---|---|---|---|---|---|---|
| Male | 88,546 | 68.5 | 156,321 | 53.4 | 244,867 | 58.1 |
| Female | 40,752 | 31.5 | 136,170 | 46.6 | 176,922 | 41.9 |
| Total | 129,298 | 100.0 | 292,491 | 100.0 | 421,789 | 100.0 |
(a) Excludes care receivers of recipients who were eligible only for the Child Health Care Card.
Source: Centrelink administrative data, 2007.
Around 68% of children receiving care were male, while 53% of adults receiving care were male (Figure 15).
Figure 15: Care receivers of CA recipients,(a) sex, June 2007
(a) Excludes care receivers of recipients who were eligible only for the Child Health Care Card.
Source: Centrelink administrative data, 2007.
[ Return to Top Return to Section ]
4.13 Care receivers of CA recipients across states and territories
The proportion of children receiving care from CA recipients varied across the states and territories. The two territories had the highest proportions of children receiving care (40% of care receivers in both territories). Children accounted for 27% of all care receivers in Tasmania (Table 37).
| Children | Adults | Total care receivers | ||||
|---|---|---|---|---|---|---|
| State/territory | Number | % | Number | % | Number | % |
| New South Wales | 42,402 | 29.6 | 101,067 | 70.4 | 143,469 | 100.0 |
| Victoria | 33,181 | 29.9 | 77,692 | 70.1 | 110,873 | 100.0 |
| Queensland | 24,970 | 30.7 | 56,375 | 69.3 | 81,345 | 100.0 |
| South Australia | 11,793 | 33.1 | 23,842 | 66.9 | 35,635 | 100.0 |
| Western Australia | 11,308 | 35.0 | 20,983 | 65.0 | 32,291 | 100.0 |
| Tasmania | 3,238 | 26.9 | 8,816 | 73.1 | 12,054 | 100.0 |
| Northern Territory | 689 | 37.6 | 1,144 | 62.4 | 1,833 | 100.0 |
| Australian Capital Territory | 1,715 | 40.1 | 2,561 | 59.9 | 4,276 | 100.0 |
| Total(b) | 129,298 | 15.4 | 292,491 | 84.6 | 421,789 | 100.0 |
(a) Excludes care receivers of recipients who were eligible only for the Child Health Care Card.
(b) Includes overseas residents and people whose state or territory was not specified.
Source: Centrelink administrative data, 2007.
[ Return to Top Return to Section ]
4.14 Medical conditions of children receiving care from CA recipients
For male children under the care of CA (child) recipients, the most commonly reported medical conditions were attention deficit/hyperactivity disorder (18%), learning disability (17%) and autistic disorder (17%). For females the most commonly reported conditions were learning disability (17%), attention deficit/hyperactivity disorder (10%) and IQ less than 55 (8%) (Table 38).
| Top 10 first-listed medical conditions | |||||
|---|---|---|---|---|---|
| Males | Number | % | Females | Number | % |
| Attention deficit/hyperactivity disorder | 15,745 | 17.8 | Learning disability | 6,949 | 17.1 |
| Learning disability | 15,009 | 17.0 | Attention deficit/hyperactivity disorder | 3,909 | 9.6 |
| Autistic disorder | 14,619 | 16.5 | IQ is less than 55 | 3,254 | 8.0 |
| Asperger’s disorder | 5,305 | 6.0 | Autistic Disorder | 2,967 | 7.3 |
| IQ less than 55 | 5,054 | 5.7 | Severe Multiple Disability – Mobility | 1,911 | 4.7 |
| Speech disorder – other | 4,106 | 4.6 | Diabetes – insulin dependent | 1,839 | 4.5 |
| Severe multiple disability – mobility | 2,285 | 2.6 | Speech disorder – other | 1,493 | 3.7 |
| Asthma | 2,140 | 2.4 | Down syndrome | 1,437 | 3.5 |
| Diabetes – insulin dependent | 1,969 | 2.2 | Asthma | 1,101 | 2.7 |
| Down syndrome | 1,807 | 2.0 | Leukaemia, haemophagocytic lymphohistiocystosis and other childhood malignancies | 912 | 2.2 |
| Other | 20,507 | 23.2 | Other | 14,980 | 36.8 |
| Total | 88,546 | 100.0 | Total | 40,752 | 100.0 |
(a) Excludes recipients who were eligible only for the Child Health Care Card.
Source: Centrelink administrative data, 2007.
5. Data limitations and caveats
Centrelink administrative data in this report is drawn from various sources, including extractions from aggregate SuperStar databases in production and test databases, Centrelink administrative data (available on request) and Centrelink’s Performance Reporting Information System for Managers (PRISM). Data may be on varying reference periods and may differ in quality. In particular, care should be taken with the Carer Payment (child) data, which has been extracted from a test database that is still under development.
Data from the 2003 SDAC Confidentialised Unit Record File differs from figures published by the Australian Bureau of Statistics (ABS 2004) because the Confidentialised Unit Record File is based on a subset of the larger survey population. Refer to Australian Bureau of Statistics Information Paper: Basic Confidentialised Unit Record File: Survey of Disability Ageing and Carers, 2003, cat. no. 4430.0.00.001.
Children in the SDAC are aged 0–14 years, while children in the Carer Payment and Carer Allowance populations are aged 0–15 years.
6. References
Australian Bureau of Statistics (ABS) 2004, Disability, ageing and carers: Summary of findings, cat. no. 4430.0.
Australian Institute of Health and Welfare (AIHW) 2004, Children with disabilities in Australia.
Australian Institute of Health and Welfare (AIHW) 2006, Disability updates: Children with disabilities, Bulletin Issue 42.
Access Economics 2005, The economic value of informal care, report prepared for Carers Australia.
Last updated:

