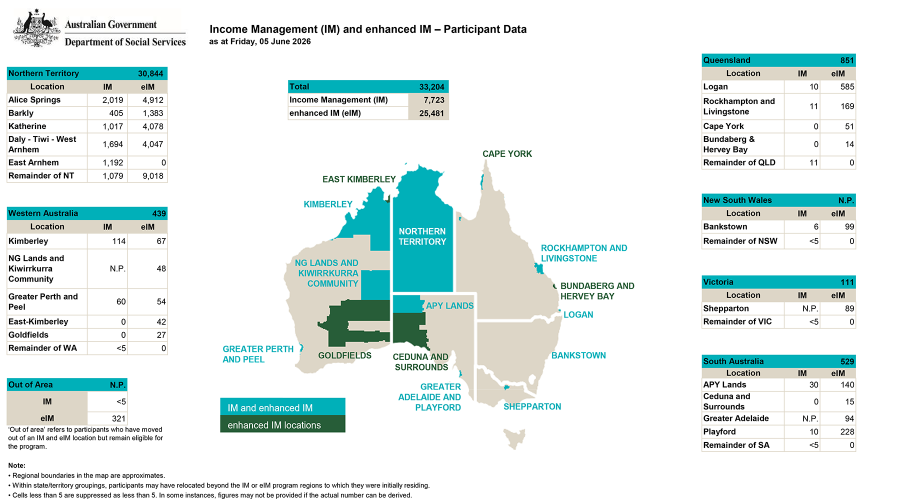
Income Management (IM) and enhanced IM – Participant Data
Total
- Total 33,204
- Income Management (IM) 7,723
- enhanced IM (eIM) 25,481
Northern Territory
Total IM and eIM: 30,844
| Location | IM | eIM |
|---|---|---|
| Alice Springs | 2,019 | 4,912 |
| Barkly | 405 | 1,383 |
| Katherine | 1,017 | 4,078 |
| Daly -Tiwi -West Arnhem | 1,694 | 4,047 |
| East Arnhem | 1,192 | 0 |
| Remainder of NT | 1,079 | 9,018 |
Western Australia
Total IM and eIM: 439
| Location | IM | eIM |
|---|---|---|
| Kimberley | 114 | 67 |
| NG Lands and Kiwirrkurra Community | N.P. | 48 |
| Greater Perth and Peel | 60 | 54 |
| East-Kimberley | 0 | 42 |
| Goldfields | 0 | 27 |
| Remainder of WA | <5 | 0 |
Queensland
Total IM and eIM: 851
| Location | IM | eIM |
|---|---|---|
| Logan | 10 | 585 |
| Rockhampton and Livingstone | 11 | 169 |
| Cape York | 0 | 51 |
| Bundaberg & Hervey Bay | 0 | 14 |
| Remainder of QLD | 11 | 0 |
New South Wales
Total IM and eIM: N.P.
| Location | IM | eIM |
|---|---|---|
| Bankstown | 6 | 99 |
| Remainder of NSW | <5 | 0 |
Victoria
Total IM and eIM: 111
| Location | IM | eIM |
|---|---|---|
| Shepparton | N.P. | 89 |
| Remainder of VIC | <5 | 0 |
South Australia
Total IM and eIM: 529
| Location | IM | eIM |
|---|---|---|
| APY Lands | 30 | 140 |
| Ceduna and Surrounds | 0 | 15 |
| Greater Adelaide | N.P. | 94 |
| Playford | 10 | 228 |
| Remainder of SA | <5 | 0 |
Out of area
- Total N.P.
- IM <5
- eIM 321
‘Out of area’ refers to participants who have moved out of an IM and eIM location but remain eligible for the program.
Locations
IM and enhanced IM
- Northern Territory
- Rockhampton and Livingstone
- Logan
- Bankstown
- Shepparton
- Greater Adelaide and Playford
- APY Lands
- Greater Perth and Peel
- NG Lands and Kiwirrkurra Community
- Kimberly
Enhanced IM
- Cape York
- Bundaberg and Hervey Bay
- Ceduna and Surrounds
- Goldfields
- East Kimberly
DSS1005 | Permalink: www.dss.gov.au/node/1005