Preliminary Report: Survey on the Impact on Families of the Economic Downturn
The Survey on the Impact on Families of the Economic Downturn was conducted to help understand the different ways in which families have been affected by, and responded to, the downturn and the changing economic environment.
Executive Summary
The survey on the Impact on Families of the Economic Downturn was conducted to help understand the different ways in which families have been affected by, and responded to, the downturn and the changing economic environment.
A survey of 1,650 families with at least one child aged under 18 years was conducted between May and June 2009. Main topic areas were: demographics, information on other household members, dwelling type, financial hardship, economic responses to the downturn, health, emotional wellbeing and family relationships.
Key findings
Financial situation
Respondents were asked about their household’s current financial situation, how it compared with six months ago and how they expect it to change over the next six months. It should be noted that the gross median income of households in the sample was $80,000-$100,000. This is somewhat higher than the median household income for Australian families with children, that is $67,500-78,700 (Australian Bureau of statistics (ABS), 2006).
This suggests that respondents in the survey are financially better off than Australian families overall, which has implications for interpreting results of the survey. Because the most disadvantaged families in this survey have been most adversely affected by the downturn, it is likely that families in Australia who have lower incomes may have been even more adversely affected by the downturn than respondents in this survey.
Key findings were:
- almost 34% of survey respondents considered their current financial situation to be worse than it was six months ago. Approximately 55% considered it to be the same and almost 11% considered it to be better
- in the case of sole parents, 42% considered their financial situation worse than six months ago
- of households with an income less than $20,000 a year, 57% described their current financial situation as worse than six months ago, in contrast to 14% of households with incomes greater than $150,000
- around 58% of respondents expected their financial situation to remain the same over the next six months, with 19% expecting it to improve and 17% expecting it to worsen
- around 16% reported seeking financial counselling or help with money management for the first time in the last six months and a further 34% developed a budget for the first time
- of households with an income less than $20,000 a year, 28% expected their financial situation to worsen over the next six months, in contrast to 14% of households with incomes greater than $150,000
- around 46% described current household financial situation as ‘just getting along’ and 45% as ‘comfortable’. Relatively small proportions of families considered their financial situation as ‘prosperous’ (3%), ‘poor’ (5%) or ‘very poor’ (2%)
- the majority of respondents who considered their household’s current financial situation as ‘poor’ or ‘very poor’ reported that their financial situation had worsened in the last six months (71.4% and 100.0% respectively)
- approximately 21% of all survey respondents reported being unable to pay their electricity, gas or telephone bills on time during the previous six months (and for 57% of these people this had never happened before the last six months).
Financial hardship
Hardship measures were experienced by a substantial proportion of respondents (34%) over the last six months. Around 21% reported being unable to pay their household’s utility bills on time, almost 15% sought help from friends or family, 9.6% had pawned or sold something because they needed money and 8.3% had been unable to pay their mortgage or rent on time. For sole parents, 39% were unable to pay utility bills on time and 35% sought help from friends or family. More than 15% of families were experiencing multiple hardships, with two study respondents reporting experiencing seven different types of financial hardships.
For all financial hardship measures, the majority of households had experienced the hardship for the first time in the last six months. Of families that were unable to pay their rent or mortgage on time, around 77% were experiencing this hardship for the first time in the last six months. Of those families who had gone without meals, 70.3% had experienced it for the first time in the previous six months. A similar proportion of families (almost 68%) were unable to heat their home for the first time in the last six months.
Of the people who had experienced one or more of the hardship measures in the last six months, 72.5% were experiencing at least one hardship for the first time. It is worth noting that for a proportion of families who had been experiencing financial hardship, the effect was not necessarily due to economic downturn, as they had been experiencing financial hardship for longer than six months.
Similarly, the economic downturn appears to have had little direct impact on unemployment at the time of the survey. A small proportion of employed respondents (6.0%) changed their jobs in the six months prior to the survey, and of those who changed, 21.6% were laid off or forced to change jobs. Of employed partners, 4.8 % had changed their jobs in the last six months, 39.7% of whom were laid off or forced to change jobs. the average hours worked per week by respondents and their partners (32.9 hours and 41.3 hours respectively) are similar to those of the 2006 HILDA survey (31.3 for women and 41.7 hours for men).
Emotional wellbeing and family relationships
Respondents were asked about their personal and family wellbeing and relationships. Key findings were:
- around 34% of survey participants reported that the economic downturn had created more stress/anxiety/worry for them
- the breakdown of current levels of problems or stresses for respondents was: none (18.6%), a few (43.6%), some (28.5%), many (6.5%) and very many (2.7%)
- a relatively large proportion of respondents who reported a decline in their standard of living considered the extent of financial disagreements with their partner/the child’s other parent to have increased (45.4%)
- the majority of respondents (75.3%) reported no change in the extent to which they disagree about financial matters with their partner or their child/ren’s other parent
- around 20% of survey respondents reported an increase (in the last six months) in the extent to which they argued about money with the child’s other parent
- for respondents who said they always (2.4%) or often (6.6%) argued with their children about money, the majority said the arguments had increased in frequency in the last six months (71.8% and 60.6% respectively).
- This figure includes single and dual parent families with children aged less than 15 years and has been adjusted for the CPI growth between August 2006 (census) and July 2009 (survey)
Introduction
The Department of Families, Housing, Community Services and Indigenous Affairs (FaHCSIA) conducted this survey to help understand the impact of the world-wide economic downturn on Australian families. there has been little Australian research on the effects of previous economic downturns and how to mitigate the adverse effects on families. the survey provides early evidence on how families are affected by, and respond to, recent economic circumstances.
While the survey findings cannot be directly attributed to the economic downturn, multiple waves, conducted over time, will help to identify who is most affected by the economic downturn and over what time period. We will also be able to identify, as suggested above, those who were able to take advantages of opportunities presented. Finally, we will be able to identify those who were not able to take advantages of opportunities, why they were not able to do so, and how policy can help improve the lives of those who are most disadvantaged.
Survey objectives and methodology
Wallis Consulting group was commissioned by FaHCSIA to conduct a survey on the Impact on Families of the Economic Downturn. the survey specifically targeted families with at least one child aged less than 18 years living in the household at least 35% of the time.
The objectives of the survey were to collect:
- demographic, social and economic characteristics of respondents and other household members
- changes in families’ financial circumstances since the global financial crisis
- families’ practical responses to these changes
- the impact on personal and family wellbeing and relationships.
In addition, three open questions were asked at the end of the survey. Respondents were randomly assigned one question about their attitudes to:
- how they feel about the importance of education and training
- how they feel about debt and the use of credit
- work-life balance.
The survey was piloted on 15 interviewees from 5–7 May 2009 and the main fieldwork was conducted between 14 May and 2 June 2009. the sample of families with fixed telephone lines was selected using Random Digit Dialling. the fieldwork company interviewed a sample of 1,650 families using Computer Assisted telephone Interviews (CATI).
The survey sample was stratified to cover capital cities and elsewhere in each state/territory. the sample consisted of 175 families from each capital city (Adelaide, Melbourne, Perth, Hobart, sydney/ACt and Brisbane/ Darwin) and 100 families from other parts of each state/territory (New South Wales, Victoria, South Australia, Tasmania, Western Australia and Queensland/Northern Territory).
Survey limitations
Proportional representation of population by state/territory was not used because the small sample size would have meant very small samples from the low population states and non-metropolitan areas. In addition, the use of fixed telephone lines has contributed to the median household income for respondents in the sample being higher than for all Australian families with children. Accordingly, it must be noted that the results from this survey cannot be generalised to the Australian population overall.
The survey was partly conducted during Budget week, which may have affected responses. For example, media coverage on financial hardship may have affected respondents’ perceptions of the severity of the economic downturn, even if participants had not been directly affected.
The number of sole parents in the sample is a derived variable, calculated from responses relating to household composition (259 respondents indicated that they did not have a partner or spouse present in the household).
There is also a gender bias, with 71% of respondents being female. However, this ratio is typical of surveys and also reflects the lower work hours of respondents (32.9 hours) compared with their partners (41.3 hours).
The descriptive analysis undertaken is based on unweighted data, which means that the present results cannot be generalised to all Australian families.
Finally, there are no comparable Australian data currently available, so the outcomes cannot be directly attributed to the economic downturn at this stage. this limitation may be partly mitigated by repeating the survey in six to 12 months.
Literature review
There is national and international research on the macroeconomic effects of previous recessions (e.g. unemployment); however, there is little research on the effects on families of economic downturns. the literature reviewed includes the key studies on the effects of the previous recessions.
The national and international review of literature on the effects of previous and current recessions on families revealed interrelationships between rising unemployment and fear of unemployment, housing issues, health issues, education, financial stress and family conflict. We briefly review the existing literature for each issue, noting that they are often highly dependent and intertwined.
Unemployment and fear of unemployment
Experience of previous recessions indicates the primary effect is a rise in unemployment. Cass (1983) found increases in the rate and duration of unemployment and the number of children living in poverty during the 1974 Australian recession. the number of single parents excluded from the labour market, tax liability when both parents worked, housing costs, and an accompanying decrease in public expenditure on child support facilities, together exacerbated the impact of the economic recession and substantially increased the number of children living in poverty.
However, employment status is not a simple dichotomy of working versus not working. Rather, employment can be viewed as a continuum ranging from high quality jobs through to inadequate employment and unemployment (Dooley, Prause, & Ham-Rowbottom, 2000). unemployment figures do not include those underemployed, accepting lower paid jobs, lower incomes for the self-employed or those who have stopped actively seeking employment.
It would appear that few people escape the impact of an economic downturn, with the families of people who retain their job affected by increased pressures of work life conflicts (Duxbury & Higgins, 2001). Leslie and Blackaby (1999) argue rising levels of unemployment amongst all the major industrialised countries will see the fear of unemployment become an increasing reality. Concerns about unemployment restrain consumption, contribute to the economic slowdown, and can exacerbate family disputes.
Financial stress and family conflict
Job loss, job insecurity and economic hardship all increase during times of recession and can lead to financial stress and adversely influence conflict within families. Davis and Mantler (2004) define financial stress as the subjective, unpleasant feeling that one is unable to meet financial demands, afford the necessities of life, and have sufficient funds to make ends meet which can lead to a reduced standard of living.
The recent report by the Centre for Corporate Public Affairs (2009) found that these organisations are experiencing a reduction in investment income, corporate funding and funding from philanthropic trusts and foundations, affecting their ability to provide services to their increasing client base. the report also found 65% of not-for-profit organisations reported an increase in demand for services as a result of the economic downturn, with 83% expecting demand to increase further in the coming year.
Leslie and Blackaby (1999) believe the fear of losing a job has a cost to family wellbeing. unpredictable labour markets, particularly during periods of recession, result in increased perceptions of job insecurity (Kinnunen & Natti, 1994). Job insecurity during the Finnish recession of the 1990s was found to have an adverse effect on both work performance and health, which points to a clear need to focus on supporting individual wellbeing, as well organisational wellbeing during times of economic stress. the primary concern of ‘ordinary British families’ during the current economic downturn is money worries (James, 2009).
Conflicts within families related to money have been found to be more pervasive, problematic and recurrent than non-money problems and often remain unresolved (Papp, Cummings, & Goeke-Morey, 2009). As financial stress increases, so does the likelihood of marital discord and break-up. However, high marital support and effective problem-solving involving both people reduced the adverse influence of marital conflict (Conger, Rueter & Elder, 1999).
Parents (particularly fathers) experiencing financial stress can be less responsive to their children’s needs, less nurturing and less consistent in their parenting (Davis & Mantler, 2004). this may increase the children’s risk of socio-emotional problems (e.g., low self-esteem, depression, impulsive behaviour), health problems, poor academic performance, deviant behaviour, drug and alcohol use, withdrawal from social relationships, and reduced aspirations and expectations. Financial pressure is also related to increased conflict between parents and adolescents, particularly over the purchase of clothes, games, and lifestyle options.
Housing issues
Experience of previous economic downturns suggest that demand for private housing will decline, despite lower interest rates, with a resultant fall in house values. Young home buyers are vulnerable to default and repossession because of their asset position if labour markets deteriorate and declines in house values of 10% could leave over 300,000 Australians with negative equity in their homes (Wood & Parkinson, 2009). However, the effects to date of this downturn on the housing market appear to have been mitigated to some extent by the first homeowners’ grants and lower interest rates (HIA, 2008).
Families renting private accommodation can find themselves in a precarious position as a result of job loss in an economic recession. Failure to pay the rent risks eviction and homelessness. While homelessness itself is not new, there are indications of the growing significance of the ‘new homeless’ families, women and children. Rather than homelessness being associated with deviance, it should be seen as a part of social exclusion (Minnery & Greenhalgh, 2007).
Health and wellbeing
Work and work conditions are key determinants of health and wellbeing. Work has been linked to a range of health outcomes. Financial stress has associated with lowered self-esteem, an increasingly pessimistic outlook on life, and can lead to poorer mental health (Davis & Mantler, 2004). Evidence from the us on older workers points to a link between job loss and subsequent alcohol consumption (Gallo, Bradley, & Kasl, 2001).
Solantaus, Leinonen, & Punamäki, (2004) applied the family economic stress model to understand the influences of economic hardship on children’s mental health during the Finnish recession of the 1990s. the authors found a reduction in disposable income and increased economic pressures was related to poorer parental mental health, marital interaction and parenting quality, which in turn was associated with poorer children’s mental health.
Higher education
During the 1990s the teenage labour market was (and still is) characterised by part-time and casual work and over this period, part-time work was increasingly combined with full-time study (Marks, 2005). the effects of the 1991 recession in Australia caused a soaring demand for university places, with an additional 23,000 students accommodated without additional federal funds (Maslen, 1992). An increase in the proportion of 20 to 24 year-olds studying for a degree raised the criticism that unemployment in the recession had forced young people to seek shelter on campus to wait for a better employment market (Maslen, 1993). there are already reports appearing in the popular media in the UK suggesting this effect is already being felt with the current recession (Curtis, 2009; Lipsett, 2009).
Conclusion
The literature reviewed indicates that some families may already be feeling the effects of the downturn and suggests that welfare and economic policies do reduce the negative impact of an economic downturn on affected families. Evidence would suggest that policies and practices which support education and training will position Australia to take full advantage of the eventual economic recovery and should provide hope of a better future for those who take advantage of the opportunities presented.
Preliminary Findings
Demographics
This section of the report discusses the demographic characteristics of the households that participated in the Impact on Families of the Economic Downturn Survey. The sample was stratified with the aim of achieving equal numbers of interviews across a number of geographic regions. It was also a survey requirement that all respondents had at least one child aged less than 18 years who lived with them at least 35% of the time. A total of 1,650 respondents completed the survey and a selection of demographic characteristics of the sample can be seen in the tables shown below. Table 1 shows the regional distribution of respondents included in the survey.
| Region | Total |
|---|---|
| Sydney and ACT | 175 |
| Rest of NSW | 100 |
| Melbourne | 175 |
| Rest of Vic | 100 |
| Brisbane and Darwin | 175 |
| Rest of Qld and NT | 100 |
| Adelaide | 175 |
| Rest of SA | 100 |
| Perth | 175 |
| Rest of WA | 100 |
| Hobart | 175 |
| Rest of Tas | 100 |
| Total | 1,650 |
Of the 1,650 respondents in the survey, 2.6% identified as Aboriginal and/or Torres Strait Islander, 9.3% spoke a language other than English at home and 22.4% identified with a culture outside Australia (Table 2). The average age of respondents was 40.8 years, with ages ranging from 18 to 75 years. Respondents included 482 males (29.2% of the sample) and 1,168 females (70.8%). The median gross household income was $80,000-$100,000. This somewhat higher than the median household income for Australian families with children, that is $67,500-78,7002 (ABS, 2006).
| Survey sample characteristics (n=1,650) | ||
| Aboriginal/Torres Strait Islander | Number (%) | 42 (2.6) |
| Language other than English | Number (%) | 150 (9.3) |
| Identify with a culture outside of Australia | Number (%) | 360 (22.4) |
| Age | Mean years | 40.8 |
| Gender (male) | Number (%) | 482 (29.2) |
| Gross household income | Median $ | 80,000-100,000 |
[ top ]
Geographic region
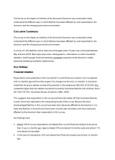
Figure 1 shows a state comparison of current financial circumstances compared with six months ago. Circumstances were similar across the various jurisdictions, with the majority of respondents in all states reporting their financial situation to have stayed the same over the last six months.
Figure 1: Financial circumstances compared with six months ago by state
Figure 2 shows a capital city/rest of state comparison of expected financial circumstances over the next six months. Expectations were similar, with no substantial differences between capital cities and rest of state. The majority of respondents expected their financial situation to stay the same over the next six months.
Figure 2: Expectations of financial circumstances for the next six months by capital city and rest of state
No differences were apparent across state, capital city or rest of state. This suggests that, so far, the downturn is not disproportionately affecting any particular parts of Australia.
Family type
The number of people in a household ranged from 2 to 12 people, with most respondents living in 3 (23.4%) or 4 person households (43.5%). Ninety-four families (5.7% of the sample) had a new member join their household in the previous six months. Reasons for this were varied but included relationship breakdown and family support. For example, some respondents reported family members returning to their parents' home after the breakdown of a relationship.
Of the 1,650 people interviewed, 1,267 (76.8%) were married and living with their husband or wife. A further 125 (7.6%) lived with a partner or in a de facto relationship. There were 259 (15.6%) respondents with no spouse or partner living with them (sole parents). It was a survey requirement that all households in the sample had at least one child aged less than 18 years. Approximately 24% of families had one child only, around 46% had two children and almost 30% had three or more children. Also, 230 respondents reported that they had a child or children in their household with a parent who lives elsewhere.
[ top ]
Income and employment
Approximately 82% of the sample provided an estimate of their household's total annual income before tax. Respondents were asked to include earnings, pensions, benefits, child support and any other sources of income in their estimate. Total gross household income estimates ranged from $5,000 to $900,000 (See Figure 3). The mean household income range was $50,000-$80,000 compared with the median household income range of $80,000-$100,000.
Figure 3: Household income
Sources of income
Respondents' income came from a range of different sources (and could include multiple sources so percentages add to more than 100%): wage or salary (62.1% of respondents), self-employed earnings or proceeds from a business (15.2%), Government benefit or allowance (28.4%), and from another source (3.2%) (see Figure 4). A further 9.9% of respondents reported having no source of income.
Figure 4: Sources of income(a)
Note:
(a) Some respondents and respondent's partners had multiple sources of income, so percentages add to more than 100%
Respondents who were married or lived with a partner (approximately 84% of the sample) were also asked about their partner's sources of income. Respondents reported a similar pattern for their partner's source of income, with most partners (72.3%) receiving income from a wage or salary. The main differences in responses were that only 9.6% of partners received a Government benefit or allowance and 6.0% of partners had no source of personal income (see Figure 4).
[ top ]
Employment
Respondents who worked reported, on average, 32.9 hours per week of employment. Partners of respondents recorded a substantially higher average of 41.3 hours per week. This is likely to be associated with the gender split of the survey sample (70.8% female and 29.2% male). These findings are similar to those reported in the 2006 HILDA survey (31.3 hours for women and 41.7 hours for men).
For respondents whose main source of income was a wage or salary, the breakdown of job status was as follows: 81.6% described their job as permanent, 3.5% as temporary or contract work, and 14.8% as casual. Similar trends were reported for partners of respondents, with most being permanently employed (88.3%).
Respondents who were working were asked to describe the kind of work they perform in their job. The ten most common job descriptions in order of frequency were: education professionals (8.2%), general clerical workers (7.6%), specialist managers (7.5%), health professionals (6.3%), carers and aides (6.3%), sales assistants and sales persons (5.1%), numerical clerks (4.9%), business, human resource and marketing professionals (3.9%), design, engineering, science and transport professionals (3.4%), and engineering, ICT and science technicians (2.9%).
The majority of respondents who were working reported that they had spent at least two years in their current job (72.5%). Of the respondents that had changed their jobs in the six months prior to the survey (just over 6% of employed respondents), 74.3% stated that it was their choice to change jobs, compared with 21.6% who were laid off or forced to change jobs.
For partners of respondents in paid employment, a similar proportion (77.6%) had been in their current job for more than 2 years. Approximately 4.8% had been in their current job for six months or less. The proportion of these people that had chosen to change their job was 51.7% compared with 39.7% who had been laid off or forced to leave their previous job.
Respondents who reported their financial circumstances to be better than they were six months ago had higher incomes. Correspondingly, respondents who reported their circumstances to be worse than they were six months ago had lower incomes (Figure 5).
Figure 5: Financial circumstances compared with six months ago by income
As respondents' income increased, so too did their expectations of their financial situation staying the same over the next six months. Correspondingly, as income decreased, respondents' expectations of circumstances worsening over the next six months increased (Figure 6).
Figure 6: Expectations of financial circumstances over the next six months by income
[ top ]
Education
The highest level of completed education or training for respondents and their partner is shown in Figure 7 below. Around 25% completed years 9-11and 16.4% of respondents completed year 12. A further 6.6% of respondents had completed a trade or apprenticeship and almost 17.8% had completed a bachelor degree. Percentages for partners were similar specifically, these were23.5% (years 9 11), 18.7% (Year 12), 15.0% (trade or apprenticeship) and 17.3% (bachelor degree).
Figure 7: Highest level of education
Housing
The majority of respondents (96.0%) lived in a separate house, with only small proportions living in a flat, unit, apartment or semi-detached dwelling (2.5%) or a house or flat attached to a shop or office (1.3%). Of the total number of respondents, 61.8% were purchasing a house or had a mortgage, 19.6% owned their house outright, 14.8% were renting privately, and a small percentage were in public or community housing (1.9%), living with parents (0.7%) or had other arrangements (1.2%). Finally, of those who were in the process of purchasing their house or had a mortgage, 6.6% owed more on their house than what it was worth (negative equity).
The proportion of respondents who were purchasing their home (61.8%) is considerably higher than that for Australia generally (32.2%) (ABS, 2008). Correspondingly, the proportion owning their home outright is considerably lower than for Australia generally (19.6% compared with 34.3%). These differences are likely to be related to the characteristics of the survey sample, where respondents all have children aged less than 18 years living in the household.
Financial hardship
Respondents in the survey were asked a series of questions about their household's financial situation and whether there had been any changes in their circumstances in the six months prior to the survey.
Figure 8 shows the current household financial situation for all respondents. The majority of respondents (45.6%) considered their household to be 'just getting along' financially. This was closely followed by respondents who considered their households to be 'comfortable' (45.1%). Of the remaining families, 3.0% considered their households to be 'prosperous', 4.7% 'poor' and 1.6% 'very poor'.
Figure 8: Current household financial situation
[ top ]
Figure 9 shows the current financial circumstances of the respondents by whether they feel they are better, about the same, or worse compared with six months ago. Most respondents who considered their household to be poor or very poor reported their financial situation had worsened in the last six months (71.4% and 100.0% respectively). The most common reasons given for financial situations worsening were increased costs of living, having less work available and job loss.
The majority of households who were prosperous, comfortable or just getting along considered their financial situation to be about the same compared with six months ago (70.0%, 68.5% and 47.0% respectively). For a small proportion of households whose situation was prosperous, comfortable, just getting along and poor, their financial situation had improved in the last six months (16.0%, 15.3%, 6.4% and 6.5% respectively). The most common reason for improved financial circumstances were low interest rates, a new job and working more hours.
Figure 9: Current household financial situation compared with six months ago
All respondents were asked about whether they expected their household's financial situation to improve, stay the same or worsen over the next six months. Approximately 58% of respondents believe their family's financial situation will stay the same (see Figure 10). A further 19% think that their financial situation will improve and almost 17% are expecting their circumstances to worsen (6% don't know).
Figure 10: Expectation of financial situation change over the next six months
[ top ]
Figure 11 shows the breakdown of respondents' current financial situation by whether they expect it to improve, stay about the same or worsen over the next six months. Approximately the same percentage of families (around 20%) expected improvement in their financial situation across the five financial situation categories. The very poor families were the exception, with only 11.5% expecting their financial situation to improve.
The percentage of respondents expecting their financial situation to stay the same declined as their financial situation worsened (approximately 68% of respondents who reported that they were 'prosperous' and 'comfortable' expected their situation to stay the same, compared with 19.2% of 'very poor').
The proportion of respondents expecting their household's financial situation to worsen over the next six months increased where their current financial situation was poorer (4% of prosperous households compared with 57.7% of very poor households expected their financial situation to worsen).
Finally, the percentage of 'don't know' also increased where their financial situation was poorer (4% of prosperous compared to approximately 12% of poor and very poor expected their financial situation to decrease). This finding possibly reflects the increased uncertainty associated with the economic downturn.
Figure 11: Current financial situation by expected financial situation over the next six months
All respondents were asked about hardship measures that they had experienced in the six months leading up to the survey (see Figure 12). One third (34.0%) or respondents reported having experienced at least one hardship in the previous six months. Approximately 21% of all survey respondents reported being unable to pay their household's utility bills on time, with 14.7% seeking assistance from friends or family. Pawning or selling something was the third most common hardship experienced by respondents (around 9.6%), followed by being unable to pay rent or mortgage on time (8.3% of respondents).
Figure 12: Hardships experienced in last six months
More than 15% of families reported experiencing multiple financial hardships. Of these families, 8.1% had experienced two hardships, 4.4% experienced three hardships and 4.3% had experienced four or more. Two study respondents reported experiencing all seven of the financial hardships included in the survey.
The proportion of respondents reporting hardships is higher than those reported in the 2006 Household Income and Labour Dynamics in Australia Survey. For example, 21% of respondents reported being unable to pay utilities, compared to 11.5% of HILDA and 9.3% of respondents reported pawning or selling something, compared to 3.4% in HILDA. All other hardships were reported at a higher frequency in this survey compared to HILDA, suggesting there may have been a rise in hardship since 2006.
For all financial hardship measures, the majority of households had experienced the hardship for the first time in the last six months (Figure 13). Of families who were unable to pay their rent or mortgage on time, 76.9% were experiencing this for the first time. The proportions of families that were, for the first time, going without meals, pawning or selling something or unable to heat their home in the last six months were 70.3%, 69.8% and 67.8%, respectively.
Figure 13: Recent and longer term experience of hardship (of those who had experienced hardship in the last six months)
Some hardship measures showed more long-term patterns: 44.8% had been seeking welfare or assistance and 43.1% had been unable to pay utilities on time for longer than 6 months (Figure 13). Thus, it is worth noting that for a proportion of families who had been experiencing financial hardship the effect could not be attributed solely to the Economic Downturn, as it had been happening for longer than six months.
Respondents were asked about the types of strategies they have used for the first time as a response to their changing economic situation. Figure 14 shows the proportion of respondents who tried each in the last six months. The most common responses were increased working hours (39.9%) or developed a budget (34.4%). A smaller percentage consulted a financial advisor who was not from a community/welfare organisation (13.6%), sought professional counselling (5.6%), had received financial counselling from a community/welfare organisation (1.5%), or had received education to improve how they manage money from a welfare/community organisation (1.2%).
Figure 14: Hardship strategies used for the first time in the last six months
[ top ]
Sole parents' experience
We also examined the changing circumstances and expectations of respondents who were sole parents. Figure 15 shows that most sole parents are doing about the same or worse financially compared with six months ago (48.6% and 42.1% respectively).
Figure 15: Sole parents' current financial situation compared to six months ago
The majority of sole parents expect their financial circumstances to remain the same over the next six months (Figure 16).
Figure 16: Sole parents' expected financial circumstances over the next six months
Figure 17 shows the proportions of sole parents experiencing hardship during the previous six months. The most commonly experienced hardship was being unable to pay utility bills on time (39.1%) followed by seeking financial assistance from friends and family (35.1%).
Figure 17: Sole parents' experiences of hardship during the previous six months
[ top ]
Economic responses to the downturn
This section looks at changes in basic living standards over the past six months and things people have done in response to the economic downturn. Figure 18 shows the change in basic living standards over the last six months. The majority of respondents (74.8%) considered their family's living standards to have remained the same over the last six months. Approximately 20% reported a decline in their living standards compared with 5.1% who reported an improvement.
Figure 18: Changes in living standards over the last six months
Figure 19 shows the current financial situation of respondents by whether their family's living standards have declined, improved or remained the same over the last six months. Respondents who reported their current financial situation as 'poor' or 'very poor' were the most likely to have experienced a decline in their living standards over the last six months (64.5% and 88.5%, respectively). Correspondingly, respondents who were 'prosperous' or 'comfortable' were most likely to have experienced improvements in their living standards (18.0% and 6.3%, respectively).
Figure 19: Current financial circumstances by change in living standards over the last six months
Respondents were asked about any changes in their leisure activities over the last six months. Figure 20 shows changes in frequency of leisure activities over the last six months for the child/ren and the respondent and/or their partner. For the majority, the frequency of leisure activities remained about the same over the six month period (i.e., 66.3% of child/ren and 58.4% of respondents and/or their partners).
Figure 20: Change in frequency of leisure activities in the last six months by child/ren and respondent/partner
[ top ]
Health
This section looks at the health of the survey respondents. Questions were only asked about the respondent's health, not all people in the household.
The majority of respondents (around 73.1%) considered their health to have stayed 'about the same' over the last six months (Figure 21). The proportion of respondents who reported their health to be 'much better now' or 'a bit better now' was 4.9% and 8.5%, respectively. The proportion who reported their health to be 'much worse' than it was six months ago was 3.1% compared with 10.4% who considered it to be 'a bit worse'.
Figure 21: Respondent health compared with six months ago
Of respondents who consume alcohol, tobacco or who gamble, 17.4%, 13.0% and 4.7% reported a change in these activities in the last six months, respectively.
Figure 22 looks at the nature of these changes: whether they increased or decreased. During the six months prior to the survey, a relatively large proportion of respondents gave up using tobacco (22.0%) compared with those who gave up alcohol (6.0%) and gambling (10.6%). In contrast, higher proportions of alcohol consumers and gamblers had increased their activity to a 'little more', compared with tobacco users (32.8%, 31.9% and 22.0% respectively). Respondents who used tobacco were more likely to have increased their use to 'much more' than were those who consumed alcohol or those who gambled (12.2%, 4.3% and 0.0% respectively).
Figure 22: Changes in alcohol and tobacco use and gambling over the last six months
[ top ]
Emotional wellbeing and family relationships
Respondents were asked about how they felt they were going personally and how their relationships with other family members were faring. This section examines emotional wellbeing and family relationships and whether there were any changes in the six months prior to the survey.
Figure 23 shows the respondents' current levels of emotional wellbeing compared with six months ago. The majority of people with none, a few, or some problems or stress reported these levels as being the same as they were six months ago (77.7%, 65.2% and 52.8% of respondents, respectively). In contrast, the majority of people with many or very many stresses or problems reported that their emotional wellbeing had worsened (66.4% and 86.7% of respondents, respectively).
Figure 23: Emotional wellbeing compared with six months ago
Just over half of all respondents reported that they argue with their child/ren about money (56.6% of respondents). Of the respondents who reported arguing sometimes or rarely, the majority considered the frequency of their arguments to have stayed about the same in the last six months (62.9% and 88.8%, respectively). Of the respondents who reported that they always or often argued with their child/ren about money, the majority considered that the frequency of these arguments to have increased during the last six months (71.8% and 60.6%, respectively) (Figure 24).
Figure 24: Changes in frequency of money arguments with children over the last six months
For the majority of respondents, disagreements about financial matters with their partner/the child's other parent had stayed the same compared with six months ago (75.3%). Disagreements had increased for 20.4% and decreased for 4.3% of respondents (Figure 25).
Figure 25: Changes in frequency of financial disagreements with partner/child's other parent compared with six months ago
For respondents whose basic living standards remained about the same over the last six months, the majority experienced no change in arguments with their partner/the child's other parent about financial matters over the last six months (81.6%). A relatively large proportion of respondents who reported a decline in their standard of living considered the extent of financial disagreements with their partner/the child's other parent to have increased (45.4%) (Figure 26).
Figure 26: Change in basic living standards over the last six months by change in the extent of financial disagreements
Respondents were asked whether they considered their relationship with their partner to be in trouble in the last six months. Most respondents (88%) did not consider their relationship to be in trouble compared with 11.9% who did consider their relationship to be in trouble. Of those who considered their relationship to be in trouble, almost 48% reported that this was only in the last six months.
Conclusion
The preliminary results of this survey indicate that the economic downturn has had a negative impact on some families in terms of economic, social and relationship circumstances. There are also some disadvantaged families who were already experiencing financial hardships before the onset of the economic downturn, who appear to be further affected now and who expect their situation to deteriorate further over the next six months.
It appears that disadvantaged families have been more adversely affected by the economic downturn, and that those on lowest incomes have been the most affected. The families of concern are those who consider their current financial situation as 'very poor', 'poor' and 'just getting along', as these households may be quite sensitive to small changes in household income levels or in a reduction in hours of paid work.
- This figure includes single and dual parent families with children aged less than 15 years and has been adjusted for the CPI growth between August 2006 (census) and June 2009 (survey)
References
Australian Bureau of Statistics (2006) Census of Population and Housing Cat. No. 2068.0 ABS, Canberra.
Australian Bureau of Statistics (2008) Cat. No. 2068.0. ABS, Canberra.
Cass, B. (1983). Poverty and children: The effects of the recession 1974-1983, Social Alternatives, 3(4), 13-18.
Centre for Corporate Public Affairs (2009) Impact of the economic downturn on not-for-profit organisation management. The Centre fro Corporate Public Affairs
Conger, R. D., Rueter, M., A. & Glen H. Elder (1999). Couple resilience to economic pressure, Journal of Personality and Social Psychology, 76 (1), 54-71.
Curtis, P. (2009). Figures reveal shortfall of nearly 50,000 university places, The Guardian, Thursday, 9 July, 2009.
Davis, C.G. & Mantler, J. (2004). The Consequences of Financial Stress for Individuals, Families, and Society. Centre for Research on Stress, Coping and Well-being Carleton University, Ottawa.
Dooley, D., Prause, J. & Ham-Rowbottom, K. A., (2000) Underemployment and Depression: Longitudinal Relationships, Journal of Health and Social Behaviour, 41, 421-436.
Duxbury, L. & Higgins, C. (2001) Work-Life Conflict in Canada in the New Millennium. Carleton University, Ottawa.
Gallo, W. T., Bradley, E. H., Siegel, M. & Kasl, S. V. (2001). The impact of involuntary job loss on subsequent alcohol consumption by older workers: Findings From the health and retirement survey, Journal of Gerontology: Social Sciences, 56B(1), S3-S9.
Housing Industry Association - Commonwealth Bank (2008) Affordability Report December Quarter.
James, C. (2009). What do we know about the impact of recessions on family relationships? Family and Parenting Institute, London.
Kinnunen, U. & Natti, J. (1994). Job insecurity in Finland: Antecedents and consequences, European Work and Organizational Psychologist, 4(3), 297-321.
Leslie, D. & Blackaby, D. (1999). Measuring the cost of the fear of unemployment, LABOUR, 13(2), 481-508.
Lipsett, A. (2009). Over-20s in rush for scarce university places, The Guardian, Thursday, 23 April, 2009.
Marks, G. N. (2005). Issues in the school-to-work transition: Evidence from the Longitudinal Surveys of Australian Youth', Journal of Sociology, 41(4), 363-385.
Maslen 1993 'The arts of half-mast', The Bulletin May 18, pp.36-37
Minnery, J. & Greenhalgh, E. (2007) Approaches to homelessness policy in Europe, the United States, and Australia, Journal of Social Issues, 63(3) 641-655.
Solantaus, T. Leinonen, J. & Punamäki, R. (2004). Children's mental health in times of economic recession: Replication and extension of the family economic stress model in Finland. Developmental Psychology, 40 (3). 412-429
Wood, G. & Parkinson, S. (2009). Negative Equity and House Price Risk in Australia. AHURI RMIT Research Centre, Melbourne.
Appendix
Open Questions - The Effect of the Downturn on Attitudes
Three open questions were asked at the end of the survey. Respondents were randomly assigned one question about their attitudes to:
- how they feel about the importance of education and training;
- how they feel about debt and the use of credit; or
- work-life balance.
The following represent the key themes emerging from a preliminary analysis of these open questions.
What difference, if any, has the economic downturn made to how you feel about the importance of education and training? (n=564)
- education helps me (or my children) to have better (or better paid) jobs;
- the government needs to spend more on education and training;
- education means I (or my children) have more chance of getting a job;
- education is more costly now or affects my school choices;
- education and training need to be relevant to the skills needs of the future;
- education is very important;
- parents need to ensure that their children know the importance of education;
- education is important for job security;
- the downturn has made education less important as even the highly educated have lost their jobs;
- the downturn has made no difference to how I feel about education;
- education about financial matters and how to budget is important;
- on-going education and training is important; and
- private education provides the best opportunity for my children.
What difference, if any, has the economic downturn made to how you feel about debt and your use of credit? (n=558)
- I have a budget and live within my means and have never, or no longer, use credit;
- the downturn has provided more options for investment while interest rates are low;
- I have stopped using credit or spending money for investment purposes;
- I am buying less on impulse or using credit for 'luxury' items;
- the downturn has made me more aware of the trouble you can get into using credit;
- I am more cautious about your use of credit generally;
- okay for now but concerned about my finances in the future if the downturn continues;
- my priority is to pay off your credit card or get rid of debt altogether;
- I was already struggling financially and the downturn has made me more stressed; and
- I need to use your credit card just to get by each week.
What difference, if any, has the economic downturn made to how you feel about your work/life balance? (n=528)
- choice of time with my family over more work and more money;
- the downturn has meant I need to concentrate more on work, rather than on my family;
- concern about what might happen in the future;
- concern about job security;
- superannuation losses have delayed my retirement plans;
- I am working less and have less money for things my family wants to do;
- I am working longer hours for less money;
- I (or my partner) have become unemployed;
- I need to be more careful with money now;
- I (or my family) are very stressed about our situation;
- more work means no time to spend with my family;
- more work as my profession is in high demand in a downturn;
- mother had to return to work earlier than planned or increase her hours of work;
- thankful that I have a job when others have lost their job;
- work is uncertain as I am self employed or casual; and
- I need to work more just to cover the increased cost of living.
Last updated: