Characteristics of Disability Support Pension Recipients 2010
Table of contents
- Population characteristics
- Primary medical condition
- Earnings and income support duration
- Finalised claims
- Where DSP recipients are coming from and going to
Note: All Figures in this report are a graphical representation of the data contained in the associated table immediately above each figure.
Introduction
This report has been published annually since 2001 and provides the characteristics of the population of Disability Support Pension (DSP) recipients.
Who is the Disability Support Pension for?
DSP is designed to give people an adequate means of support if they are unable to work for at least 15 hours per week at or above the relevant minimum wage, independent of a program of support, due to a permanent physical, intellectual or psychiatric impairment.
Eligibility Requirements
To qualify for DSP a person must be 16 years or over and be under age pension age at the time of claim (as at June 2010 - 64 for women and 65 for men) and:
- be permanently blind; or
- have a physical, intellectual or psychiatric impairment (assessed at 20 points or more under the Impairment Tables);
- be unable to do any work of at least 15 hours a week, or be re-skilled for any work, for a period of at least two years; and
- have become unable to work while in Australia, or have 10 years qualifying Australian residence.
Notes
- The information contained in this report has been sourced from Centrelink Administrative Data as at 25 June 2010 and previous editions of this report. If an alternative source of data has been used it has been noted.
- Where items have been grouped in this report resulting percentages may not be equal to the sum of the constituent figures due to rounding.
Highlights
DSP population
At June 2010, the DSP population was 792,581, an increase of 4.7 percent over the June 2009 population of 757,118.
DSP by sex
As at June 2010 there were 433,456 male and 359,125 female DSP recipients. Between June 2009 and June 2010, females showed a greater percentage growth than males. Female recipient numbers increased by 7.3 percent over that year, while the number of men receiving DSP rose by 2.6 percent.
The trend for the population of women receiving DSP to grow at a faster rate than men has emerged over the last fifteen years. Since the 1990s there have been a number of policy changes that have affected women including:
- a gradual increase in the qualifying age for Age Pension;
- the closure to new entrants of alternative payments received primarily or solely by women (for example, Wife Pension, Widow B Pension and Partner Allowance); and
- a tightening of the eligibility criteria for Parenting Payment as part of the Welfare to Work changes.
DSP by medical condition
The primary medical conditions of the DSP population are primarily represented by three main categories:
- Musculo-skeletal and connective tissue – 29.2 percent;
- Psychological/psychiatric – 28.7 percent; and
- Intellectual/learning - 11.6 percent.
Since 2004 the proportion of recipients reporting against the Musculo-skeletal and connective tissue category has been falling while the proportions for Psychological/psychiatric and Intellectual/learning have been rising since 2001.
Claims processed
There were 142,709 DSP claims processed between 27 June 2009 and 25 June 2010, with 91,131 grants (63.9 percent) and 51,578 rejections (36.1 percent). The overall grant rate 1 rose from 63.0 percent in 2006-07 to 64.5 percent in 2008-09, but has fallen to 63.9 percent in 2009-10.
From age twenty the grant rate rises as the age of the claimant increases. From the age of 30 females have a higher grant rate in all age ranges.
In 2009-10 rejections on medical grounds accounted for 71.4 percent of rejections and rejections for non-medical reasons were 28.6 percent of rejections.
The main reason for rejection (53.6 percent) was that the claimant was allocated less than 20 points under the Impairment Tables.
There has been change in the reason claims were rejected in the years from 2006-07 to 2009-10. The proportion of rejections because the claimant’s impairment was less than 20 points against the Impairment Tables was the reason for 27.7 percent of rejections in 2006-07. In 2009-10 that proportion had risen to 53.6 percent.
Over the same period the proportion of rejections because the claimant’s disability was of a short-term nature fell from 28.6 percent to 8.2 percent.
Entrants to DSP
At June 2010, there were 85,023 DSP recipients who were not receiving DSP in June 2009. Of these ‘new entrants’2 to DSP, 45.8 percent were not in receipt of another income support payment in June 2009 and 54.2 percent were income support recipients, with 37.7 percent on Newstart Allowance at June 2009.
Exits from DSP
At June 2010, there were 49,560 ‘exits’ from DSP (ie people who were receiving DSP in June 2009 but were no longer receiving DSP as at June 2010). Of these exits, transfers to Age Pension accounted for 55.4 percent and movement off income support payments (including deceased recipients) accounted for 41.5 percent.
From 2001 to 2008 the proportion of exits from DSP to Age Pension fell from 55.5 percent to 50.8 percent. That figure rose to 58.2 percent in 2010.
1. Population characteristics
1.1 Population and growth
Table 1 details the DSP number and annual growth for the years from 1972 to 2010 by sex.
|
Year
|
Sex
|
Total
|
|||||||
|---|---|---|---|---|---|---|---|---|---|
|
Female
|
Male
|
||||||||
|
No.
|
Change
|
% of total
|
No.
|
Change
|
% of total
|
No.
|
Change
|
Annual growth (%)
|
|
| 1972 | 61,685 | 44.4 | 77,133 | 55.6 | 138,818 | ||||
| 1973 | 64,304 | 2,619 | 43.0 | 85,305 | 8,172 | 57.0 | 149,609 | 10,791 | 7.8 |
| 1974 | 64,643 | 339 | 41.2 | 92,140 | 6,835 | 58.8 | 156,783 | 7,174 | 4.8 |
| 1975 | 65,967 | 1,324 | 39.1 | 102,817 | 10,677 | 60.9 | 168,784 | 12,001 | 7.7 |
| 1976 | 67,669 | 1,702 | 36.8 | 116,118 | 13,301 | 63.2 | 183,787 | 15,003 | 8.9 |
| 1977 | 69,754 | 2,085 | 34.4 | 133,209 | 17,091 | 65.6 | 202,963 | 19,176 | 10.4 |
| 1978 | 67,699 | -2,055 | 33.0 | 137,245 | 4,036 | 67.0 | 204,944 | 1,981 | 1.0 |
| 1979 | 70,084 | 2,385 | 31.9 | 149,759 | 12,514 | 68.1 | 219,843 | 14,899 | 7.3 |
| 1980 | 70,892 | 808 | 30.9 | 158,327 | 8,568 | 69.1 | 229,219 | 9,376 | 4.3 |
| 1981 | 68,062 | -2,830 | 30.7 | 153,889 | -4,438 | 69.3 | 221,951 | -7,268 | -3.2 |
| 1982 | 65,503 | -2,559 | 30.2 | 151,146 | -2,743 | 69.8 | 216,649 | -5,302 | -2.4 |
| 1983 | 64,617 | -886 | 29.3 | 155,672 | 4,526 | 70.7 | 220,289 | 3,640 | 1.7 |
| 1984 | 67,511 | 2,894 | 28.1 | 173,063 | 17,391 | 71.9 | 240,574 | 20,285 | 9.2 |
| 1985 | 70,449 | 2,938 | 27.2 | 188,713 | 15,650 | 72.8 | 259,162 | 18,588 | 7.7 |
| 1986 | 72,912 | 2,463 | 26.6 | 200,898 | 12,185 | 73.4 | 273,810 | 14,648 | 5.7 |
| 1987 | 75,760 | 2,848 | 26.2 | 213,290 | 12,392 | 73.8 | 289,050 | 15,240 | 5.6 |
| 1988 | 77,745 | 1,985 | 26.2 | 219,168 | 5,878 | 73.8 | 296,913 | 7,863 | 2.7 |
| 1989 | 80,510 | 2,765 | 26.2 | 227,285 | 8,117 | 73.8 | 307,795 | 10,882 | 3.7 |
| 1990 | 83,462 | 2,952 | 26.4 | 233,251 | 5,966 | 73.6 | 316,713 | 8,918 | 2.9 |
| 1991 | 89,535 | 6,073 | 26.8 | 244,699 | 11,448 | 73.2 | 334,234 | 17,521 | 5.5 |
| 1992 | 104,861 | 15,326 | 27.7 | 273,697 | 28,998 | 72.3 | 378,558 | 44,324 | 13.3 |
| 1993 | 115,101 | 10,240 | 28.3 | 291,471 | 17,774 | 71.7 | 406,572 | 28,014 | 7.4 |
| 1994 | 127,111 | 12,010 | 29.1 | 309,123 | 17,652 | 70.9 | 436,234 | 29,662 | 7.3 |
| 1995 | 139,758 | 12,647 | 30.1 | 324,672 | 15,549 | 69.9 | 464,430 | 28,196 | 6.5 |
| 1996 | 158,979 | 19,221 | 31.8 | 340,256 | 15,584 | 68.2 | 499,235 | 34,805 | 7.5 |
| 1997 | 174,907 | 15,928 | 33.2 | 352,607 | 12,351 | 66.8 | 527,514 | 28,279 | 5.7 |
| 1998 | 191,797 | 16,890 | 34.7 | 361,539 | 8,932 | 65.3 | 553,336 | 25,822 | 4.9 |
| 1999 | 204,342 | 12,545 | 35.4 | 373,340 | 11,801 | 64.6 | 577,682 | 24,346 | 4.4 |
| 2000 | 219,929 | 15,587 | 36.5 | 382,351 | 9,011 | 63.5 | 602,280 | 24,598 | 4.3 |
| 2001 | 231,572 | 11,643 | 37.1 | 392,354 | 10,003 | 62.9 | 623,926 | 21,646 | 3.6 |
| 2002 | 252,022 | 20,450 | 38.2 | 406,893 | 14,539 | 61.8 | 658,915 | 34,989 | 5.6 |
| 2003 | 260,557 | 8,535 | 38.7 | 412,777 | 5,884 | 61.3 | 673,334 | 14,419 | 2.2 |
| 2004 | 277,913 | 17,356 | 39.9 | 418,829 | 6,052 | 60.1 | 696,742 | 23,408 | 3.5 |
| 2005 | 286,709 | 8,796 | 40.6 | 420,073 | 1,244 | 59.4 | 706,782 | 10,040 | 1.4 |
| 2006 | 296,545 | 9,836 | 41.6 | 415,618 | -4,455 | 58.4 | 712,163 | 5,381 | 0.8 |
| 2007 | 301,123 | 4,578 | 42.2 | 413,033 | -2,585 | 57.8 | 714,156 | 1,993 | 0.3 |
| 2008 | 318,883 | 17,760 | 43.5 | 413,484 | 451 | 56.5 | 732,367 | 18,211 | 2.6 |
| 2009 | 334,828 | 15,945 | 44.2 | 422,290 | 8,806 | 55.8 | 757,118 | 24,751 | 3.4 |
| 2010 | 359,125 | 24,297 | 45.3 | 433,456 | 11,166 | 54.7 | 792,581 | 35,463 | 4.7 |
As at June 2010, the number of people receiving DSP was 792,581. The number of DSP recipients grew by 35,463 (4.7 percent) between June 2009 and June 2010.
At June 2010 males represented 54.7 percent of the DSP population and females 45.3 percent. The female population increased by 7.3 percent between June 2009 and June 2010, while the male population increased by 2.6 percent.
Figure 1 shows overall trends in population by sex and growth in the years from June 1972 to June 2010.
Figure 1 – DSP population and growth – June 1972 to June 2010

The rate of growth in the DSP population fell from over 13 percent in the mid 1990s to a low of 0.3 percent in 2006-2007 and has since been rising. The most recent yearly growth rate from 2009 to 2010 is 4.7 percent.
Much of the recent increase in the DSP population has been in the growth in the number of female recipients who account for 68.5 percent of the 35,463 additional recipients from 2009 to 2010.
1.2 Age
Table 2 details the DSP recipient population as at June 2010 by gender and age range.
|
Age range (years)
|
Sex
|
Total
|
||||
|---|---|---|---|---|---|---|
|
Female
|
Male
|
|||||
|
No.
|
%
|
No.
|
%
|
No.
|
%
|
|
| 16-19 | 7,551 | 2.1 | 12,263 | 2.8 | 19,814 | 2.5 |
| 20-24 | 13,066 | 3.6 | 18,207 | 4.2 | 31,273 | 3.9 |
| 25-29 | 14,989 | 4.2 | 20,670 | 4.8 | 35,659 | 4.5 |
| 30-34 | 16,861 | 4.7 | 23,917 | 5.5 | 40,778 | 5.1 |
| 35-39 | 23,951 | 6.7 | 32,133 | 7.4 | 56,084 | 7.1 |
| 40-44 | 31,202 | 8.7 | 39,831 | 9.2 | 71,033 | 9.0 |
| 45-49 | 42,830 | 11.9 | 50,018 | 11.5 | 92,848 | 11.7 |
| 50-54 | 55,825 | 15.5 | 57,921 | 13.4 | 113,746 | 14.4 |
| 55-59 | 68,322 | 19.0 | 69,251 | 16.0 | 137,573 | 17.4 |
| 60-64 | 79,313 | 22.1 | 97,946 | 22.6 | 177,259 | 22.4 |
| 65 and over | 5,215 | 1.5 | 11,299 | 2.6 | 16,514 | 2.1 |
| Total | 359,125 | 100.0 | 433,456 | 100.0 | 792,581 | 100.0 |
Figure 2 shows the proportion of DSP recipients by age range and sex as at June 2010.
Figure 2 – Recipients by age range and sex – June 2010

The number of DSP recipients in each age range increases up to Age Pension age. In the 50 to 59 age range the proportion of recipients by sex is nearly even with females accounting for 49.4 percent of the total. For the 16 to 49 age range only 43.3 percent are female.
As at June 2010, over half (56.3 percent) of all DSP recipients were over 50 years old and 2.1 percent aged over 65.
Table 3 details the number and proportion of DSP recipients by age range for the years from June 2001 to June 2010.
|
Year
|
Age Range (Years)
|
Total
|
|||||||||||
|---|---|---|---|---|---|---|---|---|---|---|---|---|---|
|
16-24
|
25-34
|
35-44
|
45-54
|
55-64
|
65 & over
|
||||||||
|
No.
|
%
|
No.
|
%
|
No.
|
%
|
No.
|
%
|
No.
|
%
|
No.
|
%
|
||
| 2001 | 39,368 | 6.3 | 66,057 | 10.6 | 108,102 | 17.3 | 168,654 | 27.0 | 238,740 | 38.3 | 3,005 | 0.5 | 623,926 |
| 2002 | 41,976 | 6.4 | 68,679 | 10.4 | 113,055 | 17.2 | 174,195 | 26.4 | 257,552 | 39.1 | 3,458 | 0.5 | 658,915 |
| 2003 | 42,748 | 6.3 | 70,132 | 10.4 | 114,719 | 17.0 | 177,055 | 26.3 | 263,525 | 39.1 | 5,155 | 0.8 | 673,334 |
| 2004 | 44,761 | 6.4 | 71,541 | 10.3 | 117,134 | 16.8 | 182,500 | 26.2 | 274,768 | 39.4 | 6,038 | 0.9 | 696,742 |
| 2005 | 46,017 | 6.5 | 71,891 | 10.2 | 117,819 | 16.7 | 185,823 | 26.3 | 278,862 | 39.5 | 6,370 | 0.9 | 706,782 |
| 2006 | 46,222 | 6.5 | 70,889 | 10.0 | 117,256 | 16.5 | 185,514 | 26.0 | 285,098 | 40.0 | 7,184 | 1.0 | 712,163 |
| 2007 | 46,013 | 6.4 | 70,198 | 9.8 | 116,629 | 16.3 | 187,529 | 26.3 | 284,539 | 39.8 | 9,248 | 1.3 | 714,156 |
| 2008 | 46,144 | 6.3 | 70,443 | 9.6 | 118,298 | 16.2 | 191,241 | 26.1 | 295,570 | 40.4 | 10,671 | 1.5 | 732,367 |
| 2009 | 48,074 | 6.3 | 73,093 | 9.7 | 122,293 | 16.2 | 198,736 | 26.2 | 301,300 | 39.8 | 13,622 | 1.8 | 757,118 |
| 2010 | 51,087 | 6.4 | 76,437 | 9.6 | 127,117 | 16.0 | 206,594 | 26.1 | 314,832 | 39.7 | 16,514 | 2.1 | 792,581 |
Figure 3 shows the proportion of DSP recipients in each age range for the years 2001 to 2010.
Figure 3 – Recipients by age range – June 2001 to June 2010

From June 2001 to June 2010 the age profile of DSP recipients has changed. With the exception of the 16 to 24 age range, which has remained steady at around 6.4 percent, the proportion of DSP recipients aged under 55 has consistently fallen while the proportion over 55 has risen.
As at June 2001, 38.7 percent of recipients were aged 55 and over by June 2010 that proportion had risen to 41.8 percent.
Table 4 details the number and proportion of DSP recipients by sex and whether they were under or over 55 years old for the years from June 2001 to June 2010.
|
Year
|
Under 55
|
55 and over
|
Total
|
||||||||||
|---|---|---|---|---|---|---|---|---|---|---|---|---|---|
|
Female
|
Male
|
Total
|
Female
|
Male
|
Total
|
||||||||
|
No.
|
%
|
No.
|
%
|
No.
|
%
|
No.
|
%
|
No.
|
%
|
No.
|
%
|
||
| 2001 | 159,233 | 25.5 | 222,948 | 35.7 | 382,181 | 61.3 | 72,339 | 11.6 | 169,406 | 27.2 | 241,745 | 38.7 | 623,926 |
| 2002 | 166,867 | 25.3 | 231,038 | 35.1 | 397,905 | 60.4 | 85,155 | 12.9 | 175,855 | 26.7 | 261,010 | 39.6 | 658,915 |
| 2003 | 169,770 | 25.2 | 234,884 | 34.9 | 404,654 | 60.1 | 90,787 | 13.5 | 177,893 | 26.4 | 268,680 | 39.9 | 673,334 |
| 2004 | 175,243 | 25.2 | 240,693 | 34.5 | 415,936 | 59.7 | 102,670 | 14.7 | 178,136 | 25.6 | 280,806 | 40.3 | 696,742 |
| 2005 | 178,667 | 25.3 | 242,883 | 34.4 | 421,550 | 59.6 | 108,042 | 15.3 | 177,190 | 25.1 | 285,232 | 40.4 | 706,782 |
| 2006 | 179,037 | 25.1 | 240,844 | 33.8 | 419,881 | 59.0 | 117,508 | 16.5 | 174,774 | 24.5 | 292,282 | 41.0 | 712,163 |
| 2007 | 180,813 | 25.3 | 239,556 | 33.5 | 420,369 | 58.9 | 120,310 | 16.8 | 173,477 | 24.3 | 293,787 | 41.1 | 714,156 |
| 2008 | 186,768 | 25.5 | 239,358 | 32.7 | 426,126 | 58.2 | 132,115 | 18.0 | 174,126 | 23.8 | 306,241 | 41.8 | 732,367 |
| 2009 | 196,195 | 25.9 | 246,001 | 32.5 | 442,196 | 58.4 | 138,633 | 18.3 | 176,289 | 23.3 | 314,922 | 41.6 | 757,118 |
| 2010 | 206,275 | 26.0 | 254,960 | 32.2 | 461,235 | 58.2 | 152,850 | 19.3 | 178,496 | 22.5 | 331,346 | 41.8 | 792,581 |
Figure 4 shows the change in the proportion of DSP recipients aged 55 and over by sex for the years from June 2001 to June 2010.
Figure 4 – Recipients aged 55 and over by sex – June 2001 to June 2010

The overall proportion of DSP recipients who were age 55 and over at the date of data extraction rose slightly between June 2001 and June 2010. However, the gender mix of that cohort has changed. The proportion of male DSP recipients 55 and over was 27.2 percent of the total DSP population in June 2001 but by June 2010 that proportion had fallen to 22.5 percent. Conversely, the proportion of female DSP recipients aged 55 and over was 11.6 percent of the total DSP population in June 2001 but this had increased to 19.3 percent in June 2010.
The male DSP population aged 55 and over fell from June 2004 (178,136) to June 2007 (173,477). However it has since increased to 178,496 as at June 2010.
1.3 State/Territory
Table 5 details the number and proportion of DSP recipients by State or Territory of residence as at June 2010.
|
State/Territory
|
Sex
|
Total
|
||||
|---|---|---|---|---|---|---|
|
Female
|
Male
|
|||||
|
No.
|
%
|
No.
|
%
|
No.
|
%
|
|
| New South Wales | 114,661 | 31.9 | 141,504 | 32.6 | 256,165 | 32.3 |
| Victoria | 90,979 | 25.3 | 101,194 | 23.3 | 192,173 | 24.2 |
| Queensland | 67,314 | 18.7 | 85,537 | 19.7 | 152,851 | 19.3 |
| South Australia | 33,885 | 9.4 | 40,563 | 9.4 | 74,448 | 9.4 |
| Western Australia | 28,694 | 8.0 | 33,817 | 7.8 | 62,511 | 7.9 |
| Tasmania | 12,199 | 3.4 | 14,978 | 3.5 | 27,177 | 3.4 |
| Northern Territory | 4,163 | 1.2 | 5,441 | 1.3 | 9,604 | 1.2 |
| ACT | 3,750 | 1.0 | 4,005 | 0.9 | 7,755 | 1.0 |
| Not Coded/IOB | 3,480 | 1.0 | 6,417 | 1.5 | 9,897 | 1.2 |
| Total | 359,125 | 100.0 | 433,456 | 100.0 | 792,581 | 100.0 |
IOB is the Centrelink International Operations Branch which manages the administration of payments to Centrelink customers who are overseas.
Figure 5 shows the proportion of DSP recipients by State or Territory of residence and sex as at June 2010.
Figure 5 – Recipients by State / Territory – June 2010

As expected, the majority of DSP recipients resided in the more populous Australian states. New South Wales was the largest with 32.3 percent of the DSP population, while the Australian Capital Territory was the smallest with 1.0 percent.
1.4 Country of birth
Table 6 details the top 10 countries of birth of DSP recipients as at June 2010 by sex.
|
Country of birth
|
Sex
|
Total
|
||||
|---|---|---|---|---|---|---|
|
Female
|
Male
|
|||||
|
No.
|
%
|
No.
|
%
|
No.
|
%
|
|
| Australia | 263,994 | 73.5 | 327,671 | 75.6 | 591,665 | 74.7 |
| UK (incl Ireland/Eire) | 18,326 | 5.1 | 22,696 | 5.2 | 41,022 | 5.2 |
| New Zealand | 6,438 | 1.8 | 7,522 | 1.7 | 13,960 | 1.8 |
| Lebanon | 5,175 | 1.4 | 6,340 | 1.5 | 11,515 | 1.5 |
| Yugoslavia | 4,568 | 1.3 | 5,376 | 1.2 | 9,944 | 1.3 |
| Greece | 4,775 | 1.3 | 5,047 | 1.2 | 9,822 | 1.2 |
| Italy | 4,672 | 1.3 | 5,037 | 1.2 | 9,709 | 1.2 |
| Vietnam | 4,300 | 1.2 | 4,829 | 1.1 | 9,129 | 1.2 |
| Turkey | 3,316 | 0.9 | 2,712 | 0.6 | 6,028 | 0.8 |
| Malta | 1,822 | 0.5 | 3,237 | 0.7 | 5,059 | 0.6 |
| Other | 41,739 | 11.6 | 42,989 | 9.9 | 84,728 | 10.7 |
| Total | 359,125 | 100.0 | 433,456 | 100.0 | 792,581 | 100.0 |
Figure 6 shows the proportion of DSP recipients born outside Australia as at June 2010 by country of birth and sex.
Figure 6 – Recipients by top 10 countries of birth (excl. Australia) – June 2010

Over 74 percent of DSP recipients were born in Australia, 73.5 percent of females and 75.6 percent of males The second largest group was born in the United Kingdom (5.2 percent).
Table 7 details the number and proportion of DSP recipients by whether they were born in Australia or overseas for the years from June 2001 to June 2010.
|
Year
|
Autralian born
|
Born overseas
|
Total
|
||||||||||
|---|---|---|---|---|---|---|---|---|---|---|---|---|---|
|
Female
|
Male
|
Total
|
Female
|
Male
|
Total
|
||||||||
|
No.
|
%
|
No.
|
%
|
No.
|
%
|
No.
|
%
|
No.
|
%
|
No.
|
%
|
||
| 2001 | 171,941 | 27.6 | 276,527 | 44.3 | 448,468 | 71.9 | 59,631 | 9.6 | 115,827 | 18.6 | 175,458 | 28.1 | 623,926 |
| 2002 | 187,296 | 28.4 | 289,169 | 43.9 | 476,465 | 72.3 | 64,726 | 9.8 | 117,724 | 17.9 | 182,450 | 27.7 | 658,915 |
| 2003 | 193,877 | 28.8 | 295,432 | 43.9 | 489,309 | 72.7 | 66,680 | 9.9 | 117,345 | 17.4 | 184,025 | 27.3 | 673,334 |
| 2004 | 205,852 | 29.5 | 302,417 | 43.4 | 508,269 | 72.9 | 72,061 | 10.3 | 116,412 | 16.7 | 188,473 | 27.1 | 696,742 |
| 2005 | 212,093 | 30.0 | 305,951 | 43.3 | 518,044 | 73.3 | 74,616 | 10.6 | 114,122 | 16.1 | 188,738 | 26.7 | 706,782 |
| 2006 | 219,102 | 30.8 | 304,828 | 42.8 | 523,930 | 73.6 | 77,443 | 10.9 | 110,790 | 15.6 | 188,233 | 26.4 | 712,163 |
| 2007 | 222,369 | 31.1 | 304,696 | 42.7 | 527,065 | 73.8 | 78,754 | 11.0 | 108,337 | 15.2 | 187,091 | 26.2 | 714,156 |
| 2008 | 234,264 | 32.0 | 307,248 | 42.0 | 541,512 | 73.9 | 84,619 | 11.6 | 106,236 | 14.5 | 190,855 | 26.1 | 732,367 |
| 2009 | 246,074 | 32.5 | 316,289 | 41.8 | 562,363 | 74.3 | 88,754 | 11.7 | 106,001 | 14.0 | 194,755 | 25.7 | 757,118 |
| 2010 | 263,994 | 33.3 | 327,671 | 41.3 | 591,665 | 74.7 | 95,131 | 12.0 | 105,785 | 13.3 | 200,916 | 25.3 | 792,581 |
Figure 7 shows the proportion of Australian born DSP recipients between June 2001 and June 2010 by sex.
Figure 7 – Australian born by sex – June 2001 to June 2010

In June 2001, the majority of DSP recipients (71.9 percent – 27.6 percent females and 44.3 percent males) were Australian-born. By June 2010, the percentage of DSP recipients who were Australian born had risen to 74.7 percent – 33.3 percent female and 41.3 percent male.
Although the number of male DSP recipients has risen by 10.5 percent from 2001 to 2010 (see Table 1), the number and proportion of male recipients born overseas has fallen from 115,827 (18.6 percent) as at June 2001 to 105,785 (13.3 percent) as at June 2010.
1.5 Relationship status
Table 8 details the DSP recipient population as at June 2010 by relationship status and sex.
|
Relationship status
|
Sex
|
Total
|
||||
|---|---|---|---|---|---|---|
|
Female
|
Male
|
|||||
|
No.
|
%
|
No.
|
%
|
No.
|
%
|
|
| Married | 93,651 | 26.1 | 117,384 | 27.1 | 211,035 | 26.6 |
| Defacto | 18,938 | 5.3 | 22,669 | 5.2 | 41,607 | 5.2 |
| Single | 115,459 | 32.2 | 185,859 | 42.9 | 301,318 | 38.0 |
| Separated | 79,883 | 22.2 | 81,382 | 18.8 | 161,265 | 20.3 |
| Divorced | 33,444 | 9.3 | 20,514 | 4.7 | 53,958 | 6.8 |
| Widowed | 17,750 | 4.9 | 5,648 | 1.3 | 23,398 | 3.0 |
| Total | 359,125 | 100.0 | 433,456 | 100.0 | 792,581 | 100.0 |
Figure 8 shows the DSP recipient number as at June 2010 by relationship status and sex.
Figure 8 – Recipients by relationship status and sex – June 2010

As at June 2010, the majority of DSP recipients (68.1 percent), were non-partnered and 31.9 percent were partnered either in married or de facto relationships.
Males are over ten percent more likely to be single (42.9 percent) than females (32.2 percent); while females are more heavily represented in the divorced, separated or widowed categories.
Table 9 details the number and percentage of DSP recipients who were partnered and non-partnered by sex for the years from June 2001 to June 2010.
|
Year
|
Partnered
|
Not partnered
|
Total
|
||||||||||
|---|---|---|---|---|---|---|---|---|---|---|---|---|---|
|
Female
|
Male
|
Total
|
Female
|
Male
|
Total
|
||||||||
|
No.
|
%
|
No.
|
%
|
No.
|
%
|
No.
|
%
|
No.
|
%
|
No.
|
%
|
||
| 2001 | 68,295 | 10.9 | 172,666 | 27.7 | 240,961 | 38.6 | 163,277 | 26.2 | 219,688 | 35.2 | 382,965 | 61.4 | 623,926 |
| 2002 | 76,446 | 11.6 | 174,574 | 26.5 | 251,020 | 38.1 | 175,576 | 26.6 | 232,319 | 35.3 | 407,895 | 61.9 | 658,915 |
| 2003 | 79,555 | 11.8 | 172,098 | 25.6 | 251,653 | 37.4 | 181,002 | 26.9 | 240,679 | 35.7 | 421,681 | 62.6 | 673,334 |
| 2004 | 86,203 | 12.4 | 168,389 | 24.2 | 254,592 | 36.5 | 191,710 | 27.5 | 250,440 | 35.9 | 442,150 | 63.5 | 696,742 |
| 2005 | 89,363 | 12.6 | 162,936 | 23.1 | 252,299 | 35.7 | 197,346 | 27.9 | 257,137 | 36.4 | 454,483 | 64.3 | 706,782 |
| 2006 | 93,861 | 13.2 | 156,793 | 22.0 | 250,654 | 35.2 | 202,684 | 28.5 | 258,825 | 36.3 | 461,509 | 64.8 | 712,163 |
| 2007 | 95,458 | 13.4 | 150,408 | 21.1 | 245,866 | 34.4 | 205,665 | 28.8 | 262,625 | 36.8 | 468,290 | 65.6 | 714,156 |
| 2008 | 101,594 | 13.9 | 145,861 | 19.9 | 247,455 | 33.8 | 217,289 | 29.7 | 267,623 | 36.5 | 484,912 | 66.2 | 732,367 |
| 2009 | 106,200 | 14.0 | 143,267 | 18.9 | 249,467 | 32.9 | 228,628 | 30.2 | 279,023 | 36.9 | 507,651 | 67.1 | 757,118 |
| 2010 | 112,589 | 14.2 | 140,053 | 17.7 | 252,642 | 31.9 | 246,536 | 31.1 | 293,403 | 37.0 | 539,939 | 68.1 | 792,581 |
Figure 9 shows the percentage of partnered recipients by sex for the years from June 2001 to June 2010.
Figure 9 – Recipients by relationship status – June 2001 to June 2010

In June 2001, partnered recipients accounted for 38.6 percent of the DSP recipient population (with 10.9 percent female and 27.7 percent male). Over the years to June 2010, that figure fell to 31.9 percent (with 14.2 percent female and 11.7 percent male).
Although the number of male DSP recipients has risen by 10.5 percent from 2001 to 2010 (see Table 1), the number of male recipients who are partnered has fallen from 172,666 as at June 2001 to 140,053 as at June 2010, a fall of 18.9 percent.
At the same time the number of partnered females has risen by 64.9 percent while the number of females overall has risen by 55.1 percent.
1.6 Home ownership
Table 10 details the June 2010 DSP recipient population by homeownership status and sex. Homeowners are recipients who own or are buying a home.
|
Homeownership status
|
Sex
|
Total
|
||||
|---|---|---|---|---|---|---|
|
Female
|
Male
|
|||||
|
No.
|
%
|
No.
|
%
|
No.
|
%
|
|
| Homeowner | 122,104 | 34.0 | 125,399 | 28.9 | 247,503 | 31.2 |
| Non-homeowner* | 237,021 | 66.0 | 308,057 | 71.1 | 545,078 | 68.8 |
| Total | 359,125 | 100.0 | 433,456 | 100.0 | 792,581 | 100.0 |
* Includes unknown status
Figure 10 shows the proportion of DSP recipients by homeownership status and sex as at June 2010.
Figure 10 – Recipients by homeownership status and sex – June 2010

As at June 2010, the majority of DSP recipients (68.8 percent) were non-homeowners. A higher proportion of females receiving DSP own a home, than males (34.0 percent compared to 28.9 percent).
Table 11 details the number and percentage of DSP recipients who were homeowners by sex for the years from June 2001 to June 2010.
|
Year
|
Female
|
Male
|
Total
|
|||||||||
|---|---|---|---|---|---|---|---|---|---|---|---|---|
|
Homeowner
|
Non Home-owner*
|
Homeowner
|
Non Home-owner*
|
Homeowner
|
Non Home-owner*
|
|||||||
|
No.
|
%
|
No.
|
%
|
No.
|
%
|
No.
|
%
|
No.
|
%
|
No.
|
%
|
|
| 2001 | 79,239 | 34.2 | 152,333 | 65.8 | 149,444 | 38.1 | 242,910 | 61.9 | 228,683 | 36.7 | 395,243 | 63.3 |
| 2002 | 88,228 | 35.0 | 163,794 | 65.0 | 152,650 | 37.5 | 254,243 | 62.5 | 240,878 | 36.6 | 418,037 | 63.4 |
| 2003 | 90,753 | 34.8 | 169,804 | 65.2 | 151,369 | 36.7 | 261,408 | 63.3 | 242,122 | 36.0 | 431,212 | 64.0 |
| 2004 | 98,136 | 35.3 | 179,777 | 64.7 | 149,014 | 35.6 | 269,815 | 64.4 | 247,150 | 35.5 | 449,592 | 64.5 |
| 2005 | 100,733 | 35.1 | 185,976 | 64.9 | 144,802 | 34.5 | 275,271 | 65.5 | 245,535 | 34.7 | 461,247 | 65.3 |
| 2006 | 104,623 | 35.3 | 191,922 | 64.7 | 138,626 | 33.4 | 276,992 | 66.6 | 243,249 | 34.2 | 468,914 | 65.8 |
| 2007 | 104,088 | 34.6 | 197,035 | 65.4 | 133,437 | 32.3 | 279,596 | 67.7 | 237,525 | 33.3 | 476,631 | 66.7 |
| 2008 | 110,474 | 34.6 | 208,409 | 65.4 | 129,443 | 31.3 | 284,041 | 68.7 | 239,917 | 32.8 | 492,450 | 67.2 |
| 2009 | 114,761 | 34.3 | 220,067 | 65.7 | 127,767 | 30.3 | 294,523 | 69.7 | 242,528 | 32.0 | 514,590 | 68.0 |
| 2010 | 122,104 | 34.0 | 237,021 | 66.0 | 125,399 | 28.9 | 308,057 | 71.1 | 247,503 | 31.2 | 545,078 | 68.8 |
* Includes unknown status
2001 data source: Pensions SuperCross database 1/6/01 – Centrelink administrative data
Figure 11 shows the homeownership rate of DSP recipients by sex for the years from June 2001 to June 2010.
Figure 11 – Homeownership rate by sex - 2001 to 2010

In the years from June 2001 to June 2010 the homeownership rate for DSP recipients has fallen from 36.7 percent to 31.2 percent. While the female homeownership rate has remained at around 34 to 35 percent, the male homeownership rate has fallen from 38.1 percent in June 2001 to 28.9 percent in June 2010.
In June 2001 there were 149,444 male DSP recipients who were homeowners – 24.0 percent of the total DSP population. By June 2010 this figure had fallen to 125,399 – 15.8 percent of the DSP recipient population.
1.7 Age and home ownership
Table 12 details the number and percentage of DSP recipient homeowners by age range as at June 2010
|
Age range (years)
|
Homeownership Status
|
Total
|
||||
|---|---|---|---|---|---|---|
|
Homeowner
|
Non-homeowner*
|
|||||
|
No.
|
%
|
No.
|
%
|
No.
|
%
|
|
| 16-19 | 173 | 0.1 | 19,641 | 3.6 | 19,814 | 2.5 |
| 20-24 | 458 | 0.2 | 30,815 | 5.7 | 31,273 | 3.9 |
| 25-29 | 1,370 | 0.6 | 34,289 | 6.3 | 35,659 | 4.5 |
| 30-34 | 3,011 | 1.2 | 37,767 | 6.9 | 40,778 | 5.1 |
| 35-39 | 6,919 | 2.8 | 49,165 | 9.0 | 56,084 | 7.1 |
| 40-44 | 12,389 | 5.0 | 58,644 | 10.8 | 71,033 | 9.0 |
| 45-49 | 22,093 | 8.9 | 70,755 | 13.0 | 92,848 | 11.7 |
| 50-54 | 35,834 | 14.5 | 77,912 | 14.3 | 113,746 | 14.4 |
| 55-59 | 58,593 | 23.7 | 78,980 | 14.5 | 137,573 | 17.4 |
| 60-64 | 98,941 | 40.0 | 78,318 | 14.4 | 177,259 | 22.4 |
| 65 & over | 7,722 | 3.1 | 8,792 | 1.6 | 16,514 | 2.1 |
| Total | 247,503 | 100.0 | 545,078 | 100.0 | 792,581 | 100.0 |
* Includes unknown status.
Figure 12 shows the number of homeowners and non homeowners by age range as at June 2010.
Figure 12 - Recipients by homeownership status and age – June 2010

Over half the DSP recipients who own their own home are over 50 years of age. In the 60 to 64 age range there are more homeowners than non-homeowners.
2. Primary medical condition
2.1 Medical condition
Table 13 details the number and percentage of DSP recipients by sex and primary medical condition.
|
Primary medical condition
|
Sex
|
Total
|
||||
|---|---|---|---|---|---|---|
|
Female
|
Male
|
|||||
|
No.
|
%
|
No.
|
%
|
No.
|
%
|
|
| Musculo-Skeletal & Connective Tissue | 107,841 | 30.0 | 123,571 | 28.5 | 231,412 | 29.2 |
| Psychological/Psychiatric | 101,872 | 28.4 | 125,548 | 29.0 | 227,420 | 28.7 |
| Intellectual/Learning | 38,472 | 10.7 | 53,352 | 12.3 | 91,824 | 11.6 |
| Nervous System | 19,504 | 5.4 | 18,643 | 4.3 | 38,147 | 4.8 |
| Circulatory System | 12,232 | 3.4 | 24,326 | 5.6 | 36,558 | 4.6 |
| Respiratory System | 11,063 | 3.1 | 11,066 | 2.6 | 22,129 | 2.8 |
| Sense Organs | 9,826 | 2.7 | 11,326 | 2.6 | 21,152 | 2.7 |
| Acquired Brain Impairment | 5,810 | 1.6 | 13,350 | 3.1 | 19,160 | 2.4 |
| Endocrine & Immune System | 8,419 | 2.3 | 9,493 | 2.2 | 17,912 | 2.3 |
| Cancer/Tumour | 7,297 | 2.0 | 7,176 | 1.7 | 14,473 | 1.8 |
| Granted Prior To 12/11/91 | 5,634 | 1.6 | 8,701 | 2.0 | 14,335 | 1.8 |
| Chronic Pain | 6,750 | 1.9 | 5,904 | 1.4 | 12,654 | 1.6 |
| Congenital Anomalies | 5,767 | 1.6 | 6,305 | 1.5 | 12,072 | 1.5 |
| Poorly Defined Cause | 8,177 | 2.3 | 3,113 | 0.7 | 11,290 | 1.4 |
| Visceral Disorder | 2,725 | 0.8 | 3,688 | 0.9 | 6,413 | 0.8 |
| Gastro-Intestinal System | 3,435 | 1.0 | 2,344 | 0.5 | 5,779 | 0.7 |
| Urogenital System | 2,107 | 0.6 | 2,187 | 0.5 | 4,294 | 0.5 |
| Infectious Diseases | 809 | 0.2 | 1,444 | 0.3 | 2,253 | 0.3 |
| Amputation | 292 | 0.1 | 1,170 | 0.3 | 1,462 | 0.2 |
| Skin Disorder & Burns | 318 | 0.1 | 389 | 0.1 | 707 | 0.1 |
| Inherited Disorders | 322 | 0.1 | 318 | 0.1 | 640 | 0.1 |
| Reproductive System | 433 | 0.1 | 16 | 0.0 | 449 | 0.1 |
| Unknown | 20 | 0.0 | 26 | 0.0 | 46 | 0.0 |
Figure 13 shows the percentage of DSP recipients of each sex and total for the top five primary medical conditions.
Figure 13 – Recipients - top 5 primary medical conditions by sex – June 2010
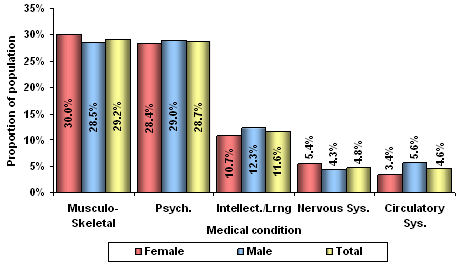
For both males and females, the most common medical categories were Musculo-skeletal and connective tissue and Psychological/psychiatric, followed by Intellectual/learning.
The distribution of primary medical conditions is very similar for both sexes. The conditions with the largest differences are Circulatory system (almost twice as many males as females – a 2.2 percentage point difference); Poorly defined cause (over two and a half times as many females as males - 1.6 percentage point difference); and Acquired brain impairment (over twice as many males as females - 1.5 percentage point difference).
Table 14 details the number and percentage of DSP recipients reported against the top five medical conditions and others for the years from June 2001 to June 2010.
|
Year
|
Medical Condition
|
Total
|
|||||||||||
|---|---|---|---|---|---|---|---|---|---|---|---|---|---|
|
Musculo-skeletal & connective tissue
|
Psychological / psychiatric
|
Intellectual / learning
|
Nervous system
|
Circulatory system
|
Other
|
||||||||
|
No.
|
%
|
No.
|
%
|
No.
|
%
|
No.
|
%
|
No.
|
%
|
No.
|
%
|
||
| 2001 | 202,732 | 32.5 | 140,965 | 22.6 | 63,168 | 10.1 | 19,270 | 3.1 | 33,742 | 5.4 | 164,049 | 26.3 | 623,926 |
| 2002 | 219,740 | 33.3 | 155,998 | 23.7 | 67,090 | 10.2 | 20,505 | 3.1 | 35,485 | 5.4 | 160,097 | 24.3 | 658,915 |
| 2003 | 226,989 | 33.7 | 166,040 | 24.7 | 70,747 | 10.5 | 21,538 | 3.2 | 35,654 | 5.3 | 152,366 | 22.6 | 673,334 |
| 2004 | 237,103 | 34.0 | 177,048 | 25.4 | 74,453 | 10.7 | 22,650 | 3.3 | 36,507 | 5.2 | 148,981 | 21.4 | 696,742 |
| 2005 | 239,723 | 33.9 | 185,351 | 26.2 | 77,854 | 11.0 | 23,266 | 3.3 | 36,313 | 5.1 | 144,275 | 20.4 | 706,782 |
| 2006 | 239,309 | 33.6 | 190,793 | 26.8 | 80,742 | 11.3 | 24,203 | 3.4 | 36,101 | 5.1 | 141,015 | 19.8 | 712,163 |
| 2007 | 228,134 | 31.9 | 195,059 | 27.3 | 80,260 | 11.2 | 30,927 | 4.3 | 35,461 | 5.0 | 144,315 | 20.2 | 714,156 |
| 2008 | 227,641 | 31.1 | 202,421 | 27.6 | 82,368 | 11.2 | 33,368 | 4.6 | 35,627 | 4.9 | 150,942 | 20.6 | 732,367 |
| 2009 | 227,271 | 30.0 | 213,672 | 28.2 | 86,403 | 11.4 | 35,809 | 4.7 | 35,873 | 4.7 | 158,090 | 20.9 | 757,118 |
| 2010 | 231,412 | 29.2 | 227,420 | 28.7 | 91,824 | 11.6 | 38,147 | 4.8 | 36,558 | 4.6 | 167,220 | 21.1 | 792,581 |
Figure 14 shows the percentage of DSP recipients reported against the top three medical conditions for the years from June 2001 to June 2010.
Figure 14 – Recipients by top 3 primary medical conditions – June 2001 to June 2010
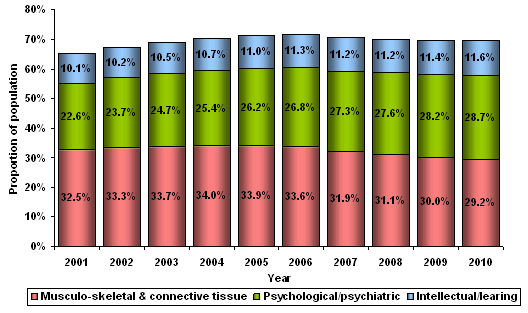
As at June 2001, nearly two thirds (65.2 percent) of DSP recipients had Musculo-skeletal and connective tissue, Psychological/psychiatric or Intellectual/learning as their primary medical condition. By June 2010 that figure was 69.5 percent. Of the three most common primary medical conditions, Psychological/psychiatric and Intellectual/learning have been increasing in incidence while Musculo-skeletal and connective tissue peaked at 34.0 percent of the recipient population in 2004 and has since had a decreasing representation.
Table 15 details the percentage of DSP recipients of each sex reported against the top five primary medical conditions (and others) for the years from June 2001 to June 2010.
|
Year
|
Medical Condition
|
|||||||||||
|---|---|---|---|---|---|---|---|---|---|---|---|---|
|
Musculo-skeletal & connective tissue
|
Psychological / psychiatric
|
Intellectual / learning
|
Nervous system
|
Circulatory system
|
Other
|
|||||||
|
No.
|
%
|
No.
|
%
|
No.
|
%
|
No.
|
%
|
No.
|
%
|
No.
|
%
|
|
| 2001 | 30.8 | 33.5 | 25.3 | 21.0 | 11.5 | 9.3 | 3.8 | 2.7 | 3.3 | 6.7 | 25.2 | 26.9 |
| 2002 | 32.0 | 34.2 | 26.0 | 22.3 | 11.3 | 9.5 | 3.8 | 2.7 | 3.4 | 6.6 | 23.7 | 24.7 |
| 2003 | 32.5 | 34.5 | 26.8 | 23.3 | 11.5 | 9.9 | 3.9 | 2.8 | 3.4 | 6.5 | 21.9 | 23.0 |
| 2004 | 33.4 | 34.5 | 27.0 | 24.3 | 11.3 | 10.3 | 3.9 | 2.8 | 3.5 | 6.4 | 20.9 | 21.7 |
| 2005 | 33.5 | 34.2 | 27.5 | 25.3 | 11.4 | 10.8 | 3.9 | 2.9 | 3.5 | 6.3 | 20.2 | 20.5 |
| 2006 | 33.6 | 33.6 | 27.7 | 26.1 | 11.4 | 11.3 | 4.0 | 3.0 | 3.6 | 6.1 | 19.7 | 19.9 |
| 2007 | 31.7 | 32.1 | 27.8 | 27.0 | 11.2 | 11.3 | 5.0 | 3.8 | 3.5 | 6.1 | 20.8 | 19.7 |
| 2008 | 31.3 | 30.9 | 27.8 | 27.5 | 10.9 | 11.5 | 5.2 | 4.1 | 3.5 | 5.9 | 21.4 | 20.0 |
| 2009 | 30.4 | 29.7 | 28.2 | 28.3 | 10.8 | 11.9 | 5.4 | 4.2 | 3.4 | 5.8 | 21.8 | 20.2 |
| 2010 | 30.0 | 28.5 | 28.4 | 29.0 | 10.7 | 12.3 | 5.4 | 5.3 | 3.4 | 5.6 | 22.1 | 19.3 |
Figure 15 shows the percentage of DSP recipients of each sex for the top three primary medical conditions for the years from June 2001 to June 2010.
Figure 15 – Recipients sex by top 3 primary medical conditions – June 2001 to June 2010
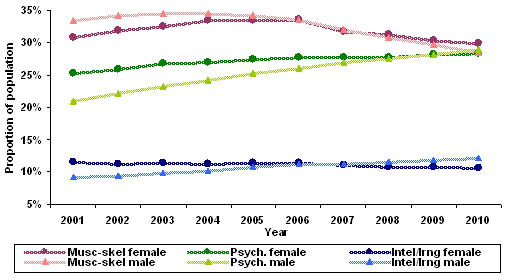
In the years from June 2001 to June 2010 there has been a change in the proportion of each sex with the top three medical conditions as their primary medical condition. While the proportion of recipients with Musculo-skeletal and connective tissue recorded as their primary medical condition has been decreasing generally, that trend is more pronounced in the male population than the female. Similarly, Psychological/ psychiatric has been increasing in proportion since 2001 and that trend is also occurring with male recipients.
The proportion of females with Intellectual/learning recorded as their primary medical condition has fallen from 11.5 percent in June 2001 to 10.7 percent in June 2010 – this is the opposite of the male recipient population where the proportion of males reporting against the category has risen from 9.3 percent in 2001 to 12.3 percent in 2010.
2.2 Top three primary medical conditions by age range and sex
Musculo-skeletal and connective tissue
Table 16 details the number and percentage of DSP recipients with Musculo-skeletal and connective tissue as their primary medical condition by age range and sex.
|
Age range (years)
|
Sex
|
Total
|
||||
|---|---|---|---|---|---|---|
|
Female
|
Male
|
|||||
|
No.
|
%
|
No.
|
%
|
No.
|
%
|
|
| 16-24 | 833 | 0.8 | 797 | 0.6 | 1,630 | 0.7 |
| 25-34 | 2,546 | 2.4 | 3,092 | 2.5 | 5,638 | 2.4 |
| 35-44 | 9,123 | 8.5 | 12,723 | 10.3 | 21,846 | 9.4 |
| 45-54 | 28,101 | 26.1 | 32,630 | 26.4 | 60,731 | 26.2 |
| 55-64 | 65,122 | 60.4 | 70,132 | 56.8 | 135,254 | 58.4 |
| 65 & over | 2,116 | 2.0 | 4,197 | 3.4 | 6,313 | 2.7 |
| Total | 107,841 | 100.0 | 123,571 | 100.0 | 231,412 | 100.0 |
Figure 16 shows the percentage of DSP recipients with Musculo-skeletal and connective tissue recorded as their primary medical condition by age range and sex.
Figure 16 – Musculo-skeletal & connective tissue recipients by age range and sex – June 2010
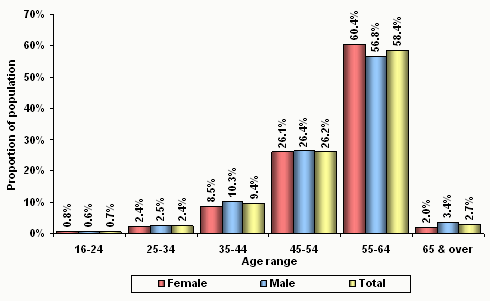
The age distribution for recipients with a primary medical condition of Musculo-skeletal and connective tissue is skewed strongly towards the older age ranges.
Psychological/psychiatric
Table 17 details the number and percentage of DSP recipients with Psychological/psychiatric as their primary medical condition by age range and sex.
|
Age range (years)
|
Sex
|
Total
|
||||
|---|---|---|---|---|---|---|
|
Female
|
Male
|
|||||
|
No.
|
%
|
No.
|
%
|
No.
|
%
|
|
| 16-24 | 4,541 | 4.5 | 8,637 | 6.9 | 13,178 | 5.8 |
| 25-34 | 11,606 | 11.4 | 19,643 | 15.6 | 31,249 | 13.7 |
| 35-44 | 21,745 | 21.3 | 30,605 | 24.4 | 52,350 | 23.0 |
| 45-54 | 31,978 | 31.4 | 34,250 | 27.3 | 66,228 | 29.1 |
| 55-64 | 31,075 | 30.5 | 31,066 | 24.7 | 62,141 | 27.3 |
| 65 & over | 927 | 0.9 | 1,347 | 1.1 | 2,274 | 1.0 |
| Total | 101,872 | 100.0 | 125,548 | 100.0 | 227,420 | 100.0 |
Figure 17 shows the percentage of DSP recipients with Psychological/psychiatric medical condition by age range and sex.
Figure 17 – Psychological/psychiatric recipients by age range and sex – June 2010
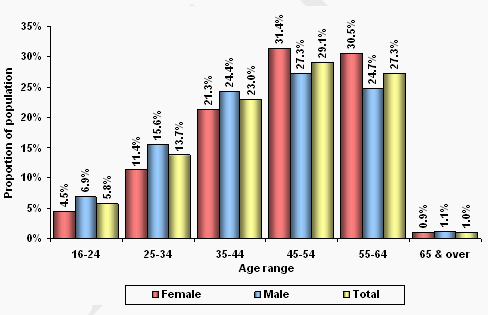
Psychological/psychiatric condition is the second most common primary medical condition recorded and, while more evenly distributed across age ranges than Musculo-skeletal and connective tissue conditions, also shows a high representation in the 45 to 54 and 55 to 64 age ranges.
There is a difference in the proportion of DSP recipients with a Psychological/ psychiatric condition according to gender and whether they are aged over 45 years. Females under 45 account for only 37.2 percent of all females with the condition; while for males with Psychological/psychiatric condition, 46.9 percent are under 45 years old.
Intellectual/learning
Table 18 details the number and percentage of DSP recipients with Intellectual/learning as their primary medical condition by age range and sex.
|
Age range (years)
|
Sex
|
Total
|
||||
|---|---|---|---|---|---|---|
|
Female
|
Male
|
|||||
|
No.
|
%
|
No.
|
%
|
No.
|
%
|
|
| 16-24 | 10,059 | 26.1 | 15,152 | 28.4 | 25,211 | 27.5 |
| 25-34 | 9,131 | 23.7 | 12,763 | 23.9 | 21,894 | 23.8 |
| 35-44 | 7,588 | 19.7 | 10,382 | 19.5 | 17,970 | 19.6 |
| 45-54 | 7,135 | 18.5 | 9,014 | 16.9 | 16,149 | 17.6 |
| 55-64 | 4,365 | 11.3 | 5,735 | 10.7 | 10,100 | 11.0 |
| 65 & over | 194 | 0.5 | 306 | 0.6 | 500 | 0.5 |
| Total | 38,472 | 100.0 | 53,352 | 100.0 | 91,824 | 100.0 |
Figure 18 shows the percentage of DSP recipients with Intellectual/learning as their primary medical condition by age range and sex.
Figure 18 – Intellectual/learning recipients by age range and sex – June 2010
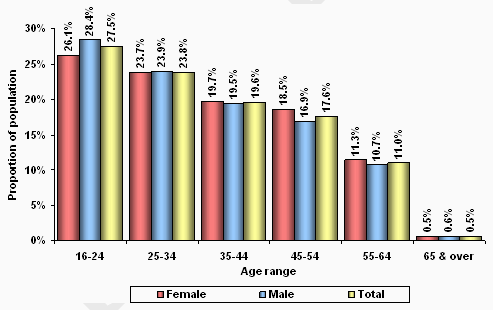
Recipients with Intellectual/learning conditions are predominantly in the younger age ranges.
There are only slight differences in the age distribution by sex for recipients with a slightly higher proportion of males in the under 35 age ranges.
3. Earnings and income support duration
3.1 Earnings
Table 19 details the number and percentage of DSP recipients by their earnings declared in the fortnight prior to 25 June 2010 (the date of data extraction) and sex.
|
Earnings range
|
Sex
|
Total
|
||||
|---|---|---|---|---|---|---|
|
Female
|
Male
|
|||||
|
No.
|
%
|
No.
|
%
|
No.
|
%
|
|
| Nil earnings | 327,269 | 91.1 | 396,120 | 91.4 | 723,389 | 91.3 |
| Less than $250 | 15,194 | 4.2 | 19,135 | 4.4 | 34,329 | 4.3 |
| $250 to < $500 | 7,524 | 2.1 | 8,355 | 1.9 | 15,879 | 2.0 |
| $500 to < $750 | 4,214 | 1.2 | 4,102 | 0.9 | 8,316 | 1.0 |
| $750 to < $1,000 | 2,368 | 0.7 | 2,556 | 0.6 | 4,924 | 0.6 |
| $1,000 to < $1,250 | 1,321 | 0.4 | 1,422 | 0.3 | 2,743 | 0.3 |
| $1,250 to < $1,500 | 615 | 0.2 | 809 | 0.2 | 1,424 | 0.2 |
| $1500 and over | 620 | 0.2 | 957 | 0.2 | 1,577 | 0.2 |
| Total | 359,125 | 100.0 | 433,456 | 100.0 | 792,581 | 100.0 |
Figure 19 shows the percentage of DSP recipients of each sex by their earnings declared in the fortnight to 25 June 2010.
Figure 19 – Recipients by earnings range and sex - fortnight to 25 June 2010
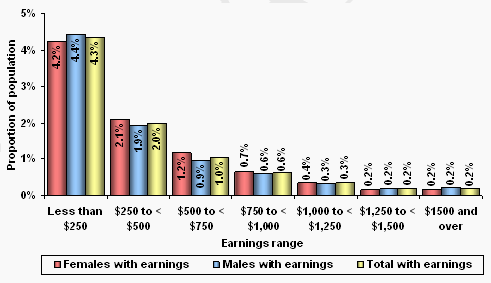
There were 69,192 DSP recipients (8.7 percent of all recipients) who declared earnings in the fortnight ending 25 June 2010.
Of those recipients who reported earnings, 49.6 percent reported earnings of less than $250.00 in the fortnight. This is below the income free area for a couple.
A higher proportion of females declared earnings between $250 and $1250 in the fortnight than males (4.3 percent for females compared to 3.8 percent for males).
Table 20 details the number and percentage of DSP recipients who reported earnings in the fortnight before the data extraction date, and those with no reported earnings, by sex for the years from June 2007 to June 2010.
|
Year
|
With earnings
|
No earnings
|
Total
|
||||||||||
|---|---|---|---|---|---|---|---|---|---|---|---|---|---|
|
Female
|
Male
|
Total
|
Female
|
Male
|
Total
|
||||||||
|
No.
|
%
|
No.
|
%
|
No.
|
%
|
No.
|
%
|
No.
|
%
|
No.
|
%
|
||
| 2007 | 31,238 | 4.4 | 39,615 | 5.5 | 70,853 | 9.9 | 269,885 | 37.8 | 373,418 | 52.3 | 643,303 | 90.1 | 714,156 |
| 2008 | 32,585 | 4.4 | 39,322 | 5.4 | 71,907 | 9.8 | 286,298 | 39.1 | 374,162 | 51.1 | 660,460 | 90.2 | 732,367 |
| 2009 | 31,891 | 4.2 | 37,850 | 5.0 | 69,741 | 9.2 | 302,937 | 40.0 | 384,440 | 50.8 | 687,377 | 90.8 | 757,118 |
| 2010 | 31,856 | 4.0 | 37,336 | 4.7 | 69,192 | 8.7 | 327,269 | 41.3 | 396,120 | 50.0 | 723,389 | 91.3 | 792,581 |
Figure 20 shows the percentage of DSP recipients who reported earnings in the fortnight before the data extraction date, by sex for the years from 2007 to 2010.
Figure 20 – Recipients with earnings by sex - 2007 to 2010
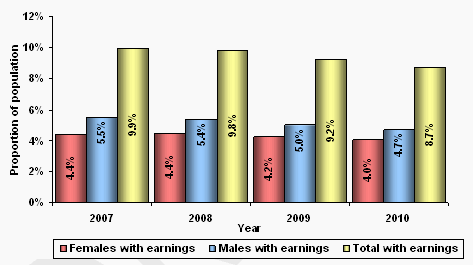
The proportion of DSP recipients with earnings in the fortnight before the data extraction date has fallen from 9.9 percent in 2007 to 8.7 percent in 2010, with male recipients responsible for most of the fall.
In the years from 2007 to 2010 the number of male DSP recipients reporting earnings in the fortnight before the data extraction date fell by 2,279 – a fall of 5.8 percent - despite the total male recipient population rising by 20,423 (4.9 percent).
Over the same years, the female DSP recipient population rose by 19.26 percent and the population who reported earnings rose by 2.0 percent.
Table 21 details the number and percentage of DSP recipients who declared earnings by the earnings range for the years from 2007 to 2010.
|
Year
|
Earnings range
|
Total
|
|||||||||||||
|---|---|---|---|---|---|---|---|---|---|---|---|---|---|---|---|
|
Less than $250
|
$250 to < $500
|
$500 to < $750
|
$750 to < $1,000
|
$1,000 to < $1,250
|
$1,250 to < $1,500
|
$1,500 and over
|
|||||||||
|
No.
|
%
|
No.
|
%
|
No.
|
%
|
No.
|
%
|
No.
|
%
|
No.
|
%
|
No.
|
%
|
||
| 2007 | 37,617 | 53.1 | 14,208 | 20.1 | 8,429 | 11.9 | 5,356 | 7.6 | 2,780 | 3.9 | 1,236 | 1.7 | 1,227 | 1.7 | 70,853 |
| 2008 | 36,348 | 50.5 | 15,188 | 21.1 | 8,777 | 12.2 | 5,680 | 7.9 | 3,020 | 4.2 | 1,418 | 2.0 | 1,476 | 2.1 | 71,907 |
| 2009 | 35,211 | 50.5 | 15,339 | 22.0 | 8,454 | 12.1 | 5,045 | 7.2 | 2,852 | 4.1 | 1,377 | 2.0 | 1,463 | 2.1 | 69,741 |
| 2010 | 34,329 | 49.6 | 15,879 | 22.9 | 8,316 | 12.0 | 4,924 | 7.1 | 2,743 | 4.0 | 1,424 | 2.1 | 1,577 | 2.3 | 69,192 |
Figure 21 shows the percentage of DSP recipients who declared earnings by the earnings range for the years from 2007 to 2010.
Figure 21 – Recipients with earnings by earnings range - 2007 to 2010
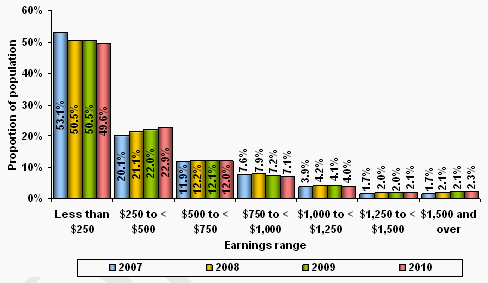
In the years from 2007 to 2010, the distribution of DSP recipients with earnings by the amount earned has remained relatively steady.
There has been a slight decrease in those earning less than $250 and an increase in most other categories. In particular the proportion of earnings in the $250 to less than $500 range has increased from 20.1 percent in June 2007 to 22.9 percent in June 2010.
3.2 Income support duration
Note: Duration on income support includes the period of time a person has been in receipt of DSP together with the period of time the person may have been in receipt of any other income support payment(s).
Table 22 details the number and percentage of DSP recipients by the duration of income support and sex as at June 2010.
|
Duration
|
Sex
|
Total
|
||||
|---|---|---|---|---|---|---|
|
Female
|
Male
|
|||||
|
No.
|
%
|
No.
|
%
|
No.
|
%
|
|
| Under 1 yr | 19,412 | 5.4 | 27,777 | 6.4 | 47,189 | 6.0 |
| 1 to < 2 yrs | 20,055 | 5.6 | 25,646 | 5.9 | 45,701 | 5.8 |
| 2 to < 3 yrs | 17,082 | 4.8 | 21,547 | 5.0 | 38,629 | 4.9 |
| 3 to < 4 yrs | 15,411 | 4.3 | 19,324 | 4.5 | 34,735 | 4.4 |
| 4 to < 5 yrs | 14,541 | 4.0 | 18,805 | 4.3 | 33,346 | 4.2 |
| 5 to < 6 yrs | 15,074 | 4.2 | 18,861 | 4.4 | 33,935 | 4.3 |
| 6 to < 7 yrs | 15,497 | 4.3 | 18,735 | 4.3 | 34,232 | 4.3 |
| 7 to < 8 yrs | 14,883 | 4.1 | 19,188 | 4.4 | 34,071 | 4.3 |
| 8 to < 9 yrs | 15,479 | 4.3 | 19,324 | 4.5 | 34,803 | 4.4 |
| 9 to < 10 yrs | 15,281 | 4.3 | 19,647 | 4.5 | 34,928 | 4.4 |
| 10 to < 15 yrs | 77,114 | 21.5 | 91,581 | 21.1 | 168,695 | 21.3 |
| 15 to < 20 yrs | 73,077 | 20.3 | 83,863 | 19.3 | 156,940 | 19.8 |
| Over 20 yrs | 46,219 | 12.9 | 49,158 | 11.3 | 95,377 | 12.0 |
| Total | 359,125 | 100.0 | 433,456 | 100.0 | 792,581 | 100.0 |
Figure 22 shows the percentage of DSP recipients by the duration of income support and sex as at June 2010.
Figure 22 – Recipients by income support duration and sex– June 2010
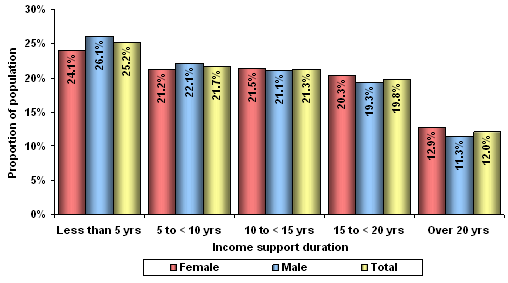
Nearly a third of DSP recipients (31.8 percent) have been in receipt of either DSP or another income support payment for more than fifteen years (33.2 percent of females and 30.7 percent of males). Proportionally, more males have been in receipt of income support for less than 10 years (48.2 percent) than females (45.3 percent).
Table 23 details the DSP recipient population by their duration on income support for the years June 2007 to June 2010.
|
Year
|
Income support duration (range)
|
Total
|
|||||||||
|---|---|---|---|---|---|---|---|---|---|---|---|
|
Less than 5 years
|
5 years to <10 years
|
10 years to <15 years
|
15 years to <20 years
|
20 years and over
|
|||||||
|
No.
|
%
|
No.
|
%
|
No.
|
%
|
No.
|
%
|
No.
|
%
|
||
| 2007 | 166,330 | 23.3 | 187,734 | 26.3 | 192,530 | 27.0 | 89,705 | 12.6 | 77,857 | 10.9 | 714,156 |
| 2008 | 165,434 | 22.6 | 180,155 | 24.6 | 196,656 | 26.9 | 106,831 | 14.6 | 83,291 | 11.4 | 732,367 |
| 2009 | 184,056 | 24.3 | 173,288 | 22.9 | 188,238 | 24.9 | 123,404 | 16.3 | 88,132 | 11.6 | 757,118 |
| 2010 | 199,600 | 25.2 | 171,969 | 21.7 | 168,695 | 21.3 | 156,940 | 19.8 | 95,377 | 12.0 | 792,581 |
Figure 23 shows the percentage of DSP recipients in each of the income support duration ranges for the years from June 2007 to June 2010.
Figure 23 – Recipients by income support duration – June 2007 to June 2010
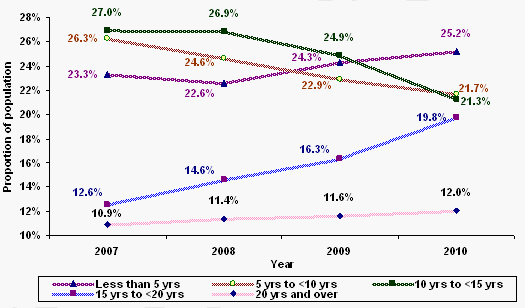
As at June 2007 over three quarters (76.5 percent) of DSP recipients had been in receipt of income support for less than fifteen years. By June 2010 that figure had fallen to 68.2 percent and 31.8 percent of recipients had been receiving income support for fifteen years or more.
Table 24 details the number and proportion of each sex of DSP recipients by whether they have been in receipt of income support for under or over fifteen years for the years from June 2007 to June 2010.
|
Year
|
Female
|
Male
|
Total
|
|||||||||
|---|---|---|---|---|---|---|---|---|---|---|---|---|
|
Under 15 yrs
|
15 yrs & over
|
Under 15 yrs
|
15 yrs & over
|
Under 15 yrs
|
15 yrs & over
|
|||||||
|
No.
|
%
|
No.
|
%
|
No.
|
%
|
No.
|
%
|
No.
|
%
|
No.
|
%
|
|
| 2007 | 230,535 | 76.6 | 70,588 | 23.4 | 316,059 | 76.5 | 96,974 | 23.5 | 546,594 | 76.5 | 167,562 | 23.5 |
| 2008 | 236,911 | 74.3 | 81,972 | 25.7 | 305,334 | 73.8 | 108,150 | 26.2 | 542,245 | 74.0 | 190,122 | 26.0 |
| 2009 | 241,757 | 72.2 | 93,071 | 27.8 | 303,825 | 71.9 | 118,465 | 28.1 | 545,582 | 72.1 | 211,536 | 27.9 |
| 2010 | 239,829 | 66.8 | 119,296 | 33.2 | 300,435 | 69.3 | 133,021 | 30.7 | 540,264 | 68.2 | 252,317 | 31.8 |
Figure 24 shows the proportion of each sex of DSP recipients with a total income support duration of fifteen years and over for the years from June 2007 to June 2010.
Figure 24 – Recipients on income support for over 15 yrs duration by sex – June 2007 to June 2010
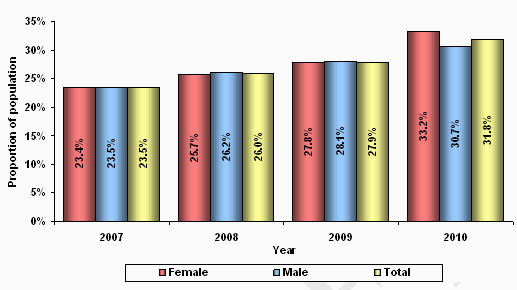
For the years from June 2007 to June 2009 the gender balance of recipients who had been in receipt of income support for more than fifteen years had remained steady and the proportion for both sexes had been growing at around 2 percent per year.
For June 2010 that situation has changed. Nearly one third of female DSP recipients (33.2% - an increase of 5.4 percentage points over the previous year) have been in receipt of income support for fifteen years and over; whereas only 30.7 percent of males (an increase of 2.6 percentage points over the previous year) are in that cohort.
4. Finalised claims
4.1 Finalised claims by age and sex
Table 25 details the volume and proportion of finalised claims by age range and sex for the period from June 2009 to June 2010.
|
Age
|
Grants
|
Grant Rate (%)
|
Rejections
|
Total claims
|
||||||||
|---|---|---|---|---|---|---|---|---|---|---|---|---|
|
Female
|
Male
|
Total Grants
|
Female
|
Male
|
Female
|
Male
|
Total
|
|||||
|
No.
|
% GR*
|
No.
|
% GR*
|
|||||||||
| 16-19 | 2,923 | 67.0 | 4,774 | 71.2 | 7,697 | 69.5 | 1,438 | 1,934 | 4,361 | 6,708 | 11,069 | |
| 20-24 | 1,384 | 50.9 | 1,749 | 52.3 | 3,133 | 51.7 | 1,335 | 1,594 | 2,719 | 3,343 | 6,062 | |
| 25-29 | 1,554 | 55.5 | 2,084 | 55.2 | 3,638 | 55.3 | 1,248 | 1,694 | 2,802 | 3,778 | 6,580 | |
| 30-34 | 2,031 | 59.1 | 2,736 | 57.6 | 4,767 | 58.3 | 1,403 | 2,010 | 3,434 | 4,746 | 8,180 | |
| 35-39 | 3,306 | 60.1 | 3,581 | 58.0 | 6,887 | 59.0 | 2,194 | 2,589 | 5,500 | 6,170 | 11,670 | |
| 40-44 | 4,494 | 60.5 | 4,211 | 60.3 | 8,705 | 60.4 | 2,940 | 2,773 | 7,434 | 6,984 | 14,418 | |
| 45-49 | 5,793 | 62.5 | 5,013 | 62.1 | 10,806 | 62.3 | 3,482 | 3,061 | 9,275 | 8,074 | 17,349 | |
| 50-54 | 6,779 | 64.0 | 5,735 | 63.8 | 12,514 | 63.9 | 3,809 | 3,251 | 10,588 | 8,986 | 19,574 | |
| 55-59 | 8,043 | 68.2 | 7,307 | 66.3 | 15,350 | 67.3 | 3,753 | 3,713 | 11,796 | 11,020 | 22,816 | |
| 60 & over | 7,681 | 72.2 | 9,953 | 69.3 | 17,634 | 70.6 | 2,955 | 4,402 | 10,636 | 14,355 | 24,991 | |
| Total | 43,988 | 64.2 | 47,143 | 63.6 | 91,131 | 63.9 | 24,557 | 27,021 | 68,545 | 74,164 | 142,709 | |
* GR= Grant rate
Figure 25 shows the proportion of each sex granted DSP and the overall grant rate3 for each age range in the period from June 2009 to June 2010.
Figure 25 – Grant rate by age range and sex – 2009-10
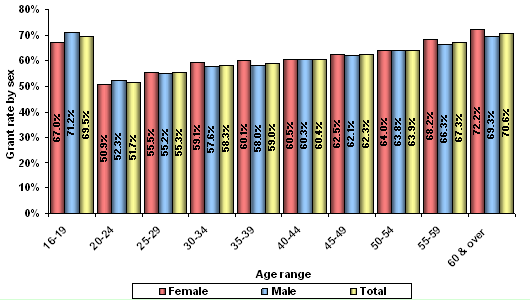
From June 2009 to June 2010, there were 142,709 new claims for DSP processed. Of these, 91,131 (63.9 percent) were granted DSP and 51,578 (36.1 percent) were rejected.
Excluding the 16 to 19 age range, the number of grants in each age range increases as the age of the claimant rises from 3,133 for 20 to 24 year olds to 17,634 for those claimants 60 years old and over.
Just over half (51.7 percent) of DSP grants were to males, and 48.3 percent were to females. The majority of grants to claimants aged under 40 and over 60 were to males. The majority of grants in the 40 to 60 age range were to females.
The 16 to 19 year old range has a grant rate of 69.5 percent. For the other age ranges, the grant rate rises with each age increment from 51.7% for 20 to 24 year olds to 70.6% for those aged 60 and over.
The grant rate for females is slightly higher than that for males. With the exception of the under 25 age range – a higher proportion of females than males are granted in each age range.
Table 26 details the number and proportion of each sex granted DSP, DSP rejections and total claims for each year for the years ending from 2006-07 to 2009-10.
|
Age
|
Grants
|
Grant Rate (%)
|
Rejections
|
Total claims
|
||||||||
|---|---|---|---|---|---|---|---|---|---|---|---|---|
|
Female
|
Male
|
Total Grants
|
Female
|
Male
|
Female
|
Male
|
Total
|
|||||
|
No.
|
% Gr
|
No.
|
% Gr
|
|||||||||
| 2006-07 | 28,669 | 63.2 | 33,939 | 62.8 | 62,608 | 63.0 | 16,723 | 20,087 | 45,392 | 54,026 | 99,418 | |
| 2007-08 | 36,901 | 64.5 | 37,778 | 63.7 | 74,679 | 64.1 | 20,296 | 21,555 | 57,197 | 59,333 | 116,530 | |
| 2008-09 | 41,830 | 65.0 | 45,000 | 64.0 | 86,830 | 64.5 | 22,509 | 25,315 | 64,339 | 70,315 | 134,654 | |
| 2009-10 | 43,988 | 64.2 | 47,143 | 63.6 | 91,131 | 63.9 | 24,557 | 27,021 | 68,545 | 74,164 | 142,709 | |
Figure 26 shows the proportion of grants for each sex for the years from 2006 -07 to 2009-10.
Figure 26 – Grant rate by sex – 2006-07 to 2009-10
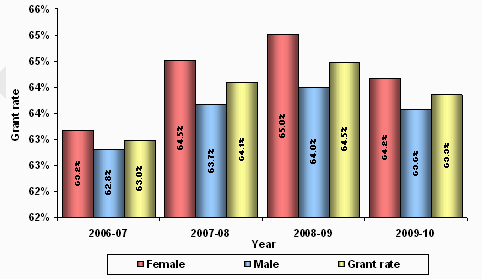
The number of DSP claims finalised rose from 99,418 in 2006-07 to 142,709 in 2009-10. In 2006-07 females accounted for 45.7 percent of claims finalised and by 2009-10 that figure was 48.0 percent. The grant rate rose from 63.0 percent in 2006-07 to 64.5 percent in 2008-09. Since then it has fallen to 63.9 percent.
The grant rate for females is consistently above the rate for males. In 2006-07 female DSP claimants were 0.4 percent more likely than male claimants to be granted. In 2008-09 that gap had expanded to 1.0 percentage point but has contracted to 0.6 percentage points in 2009-10.
4.2 Grants by primary medical condition
Table 27 details the number and percentage of DSP grants between June 2009 and June 2010 by the primary medical condition of the claimant.
|
Primary medical condition
|
Sex
|
Total grants
|
||||
|---|---|---|---|---|---|---|
|
Female
|
Male
|
|||||
|
No.
|
%
|
No.
|
%
|
No.
|
%
|
|
| Musculo-Skeletal & Connective Tissue | 13,422 | 30.5 | 12,543 | 26.6 | 25,965 | 28.5 |
| Psychological/Psychiatric | 12,006 | 27.3 | 12,701 | 26.9 | 24,707 | 27.1 |
| Intellectual/Learning | 2,601 | 5.9 | 4,014 | 8.5 | 6,615 | 7.3 |
| Cancer/Tumour | 2,678 | 6.1 | 3,187 | 6.8 | 5,865 | 6.4 |
| Circulatory System | 1,952 | 4.4 | 3,592 | 7.6 | 5,544 | 6.1 |
| Nervous System | 2,245 | 5.1 | 2,085 | 4.4 | 4,330 | 4.8 |
| Respiratory System | 1,574 | 3.6 | 1,682 | 3.6 | 3,256 | 3.6 |
| Endocrine & Immune System | 1,195 | 2.7 | 1,111 | 2.4 | 2,306 | 2.5 |
| Acquired Brain Impairment | 734 | 1.7 | 1,413 | 3.0 | 2,147 | 2.4 |
| Chronic Pain | 1,136 | 2.6 | 982 | 2.1 | 2,118 | 2.3 |
| Sense Organs | 952 | 2.2 | 1,067 | 2.3 | 2,019 | 2.2 |
| Poorly Defined Cause | 1,336 | 3.0 | 438 | 0.9 | 1,774 | 1.9 |
| Gastro-Intestinal System | 719 | 1.6 | 467 | 1.0 | 1,186 | 1.3 |
| Urogenital System | 428 | 1.0 | 447 | 0.9 | 875 | 1.0 |
| Congenital Anomalies | 373 | 0.8 | 439 | 0.9 | 812 | 0.9 |
| Visceral Disorder | 210 | 0.5 | 384 | 0.8 | 594 | 0.7 |
| Infectious Diseases | 154 | 0.4 | 267 | 0.6 | 421 | 0.5 |
| Other | 273 | 0.6 | 324 | 0.7 | 597 | 0.7 |
| Total | 43,988 | 100.0 | 47,143 | 100.0 | 91,131 | 100.0 |
Figure 27 shows the percentage of grants in the period from June 2009 to June 2010 by the top five primary medical conditions and sex.
Figure 27 – Grants by top 5 primary medical conditions – 2009-10
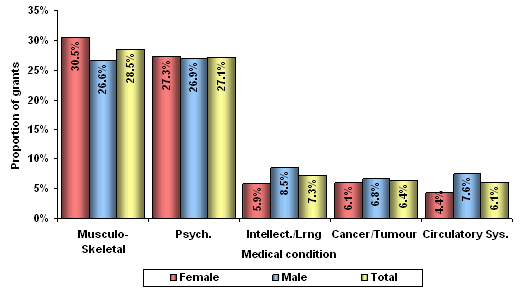
Musculo-skeletal & connective tissue and Psychological/psychiatric are the largest categories granted accounting for 55.6 percent of grants. This is similar to the proportion in the recipient population (see Table 14) where these two primary medical conditions account for 57.9 percent of the population.
Musculo-skeletal & connective tissue and Psychological/psychiatric are the primary medical conditions for 57.8 percent of all grants to females and 53.5 percent of all grants to males.
Table 28 details the count and proportion of DSP grants by medical condition (top five and others) for the years from 2006-07 to 2009-10.
|
Year
|
Medical Condition
|
Total
|
|||||||||||
|---|---|---|---|---|---|---|---|---|---|---|---|---|---|
|
Musculo-skeletal & connective tissue
|
Psychological / psychiatric
|
Intellectual / learning
|
Nervous system
|
Circulatory system
|
Other
|
||||||||
|
No.
|
%
|
No.
|
%
|
No.
|
%
|
No.
|
%
|
No.
|
%
|
No.
|
%
|
||
| 2006-07 | 18,807 | 30.0 | 15,020 | 24.0 | 3,674 | 5.9 | 4,889 | 7.8 | 4,248 | 6.8 | 15,970 | 25.5 | 62,608 |
| 2007-08 | 22,728 | 30.4 | 18,500 | 24.8 | 4,404 | 5.9 | 5,200 | 7.0 | 4,901 | 6.6 | 18,946 | 25.4 | 74,679 |
| 2008-09 | 25,479 | 29.3 | 23,134 | 26.6 | 5,971 | 6.9 | 5,713 | 6.6 | 5,334 | 6.1 | 21,199 | 24.4 | 86,830 |
| 2009-10 | 25,965 | 28.5 | 24,707 | 27.1 | 6,615 | 7.3 | 5,865 | 6.4 | 5,544 | 6.1 | 22,435 | 24.6 | 91,131 |
Figure 28 shows the proportion of DSP grants by the top five primary medical conditions for the years from 2006-07 to 2009-10.
Figure 28 – Grants by top 5 primary medical conditions – 2006-07 to 2009-10
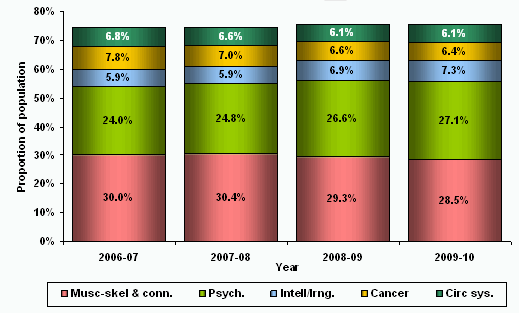
In the years from 2006-07 to 2009-10, the proportion of new grants in the Musculo-skeletal & connective tissue, Cancer/tumour and Circulatory system categories have fallen from 44.6 percentto 41.0 percent. In the same period, Psychological/ psychiatric and Intellectual/learning have risen in proportion from 29.9 percent to 34.4 percent of grants.
Table 29 details the proportion of new claims granted for each sex for the top five primary medical conditions for the years from 2006-07 to 2009-10.
|
Year
|
Primary Medical Condition
|
|||||||||||
|---|---|---|---|---|---|---|---|---|---|---|---|---|
|
Musculo-skeletal & connective tissue
|
Psychological / psychiatric
|
Intellectual / learning
|
Cancer / tumour
|
Circulatory system
|
Other
|
|||||||
|
%
Female |
%
Male |
%
Female |
%
Male |
%
Female |
%
Male |
%
Female |
%
Male |
%
Female |
%
Male |
%
Female |
%
Male |
|
| 2006-07 | 32.0 | 28.4 | 24.0 | 24.0 | 5.0 | 6.6 | 7.3 | 8.2 | 4.6 | 8.7 | 27.1 | 24.1 |
| 2007-08 | 32.5 | 28.4 | 25.3 | 24.3 | 4.8 | 6.9 | 6.2 | 7.7 | 4.4 | 8.6 | 26.8 | 24.1 |
| 2008-09 | 31.4 | 27.4 | 26.8 | 26.5 | 5.7 | 7.9 | 6.2 | 6.9 | 4.2 | 7.9 | 25.7 | 23.4 |
| 2009-10 | 30.5 | 26.6 | 27.3 | 26.9 | 5.9 | 8.5 | 6.1 | 6.8 | 4.4 | 7.6 | 25.8 | 23.6 |
Figure 29 shows the proportion of each sex granted DSP for the top three primary medical conditions for the years 2006-07 to 2009-10.
Figure 29 – Grants by top 5 primary medical conditions – 2006-07 to 2009-10
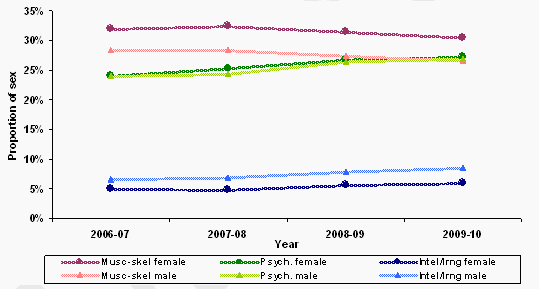
The higher proportion of females granted with Musculo-skeletal & connective tissue conditions than males has been consistent throughout the years from 2006-07 to 2009-10, as has the lower proportion of females granted with Intellectual/learning conditions.
Table 30 details the DSP grants made from June 2009 to June 2010 by the top five primary medical conditions and age range.
|
Year
|
Primary Medical Condition
|
|||||||||||
|---|---|---|---|---|---|---|---|---|---|---|---|---|
|
Musculo-skeletal & connective tissue
|
Psychological / psychiatric
|
Intellectual / learning
|
Cancer / tumour
|
Circulatory system
|
||||||||
|
No.
|
%
|
No.
|
%
|
No.
|
%
|
No.
|
%
|
No.
|
%
|
|||
| 16-24 | 425 | 1.6 | 3,564 | 14.4 | 4,410 | 66.7 | 166 | 2.8 | 86 | 1.6 | ||
| 25-34 | 1,083 | 4.2 | 4,479 | 18.1 | 704 | 10.6 | 211 | 3.6 | 123 | 2.2 | ||
| 35-44 | 3,659 | 14.1 | 6,321 | 25.6 | 745 | 11.3 | 590 | 10.1 | 383 | 6.9 | ||
| 45-54 | 7,469 | 28.8 | 6,229 | 25.2 | 556 | 8.4 | 1,673 | 28.5 | 1,391 | 25.1 | ||
| 55 & over | 13,329 | 51.3 | 4,114 | 16.7 | 200 | 3.0 | 3,225 | 55.0 | 3,561 | 64.2 | ||
| Total | 25,965 | 100.0 | 24,707 | 100.0 | 6,615 | 100.0 | 5,865 | 100.0 | 5,544 | 100.0 | ||
Figure 30 shows the proportion of the 2009-10 grants for each of the top five primary medical conditions by age range.
Figure 30 – Grants for top 5 medical conditions by age range – 2008-09
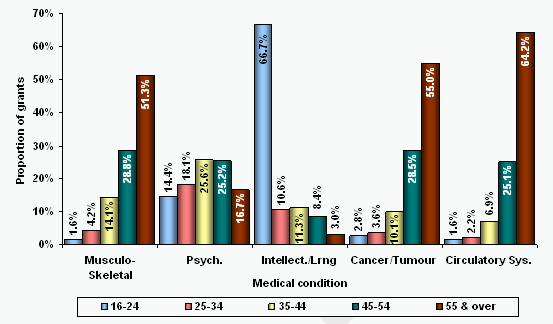
Where Musculo-skeletal and connective tissue was recorded as the primary medical condition, the majority of granted claims (51.3 percent) were to people aged 55 years and above. The number of claims granted rises as the age of the claimant increases.
Granted claims for people with Psychological/psychiatric as the primary medical condition are fairly evenly spread across all of the age ranges. The incidence increases in the 35 to 54 year range and then drops off in the 55 years and over.
Over two thirds (66.7 percent) of claims granted where Intellectual/learning was recorded as the primary medical condition, were to claimants in the 16 to 24 year age range.
The distribution of claims granted across age ranges for applicants with Cancer/tumour and Circulatory system recorded as their primary medical condition is a similar pattern to that of the Musculo-skeletal and connective tissue category with the number of claims granted rising as the age of the claimant increases.
4.3 Rejections
Table 31 details the number and proportion of claims rejected in the period from June 2009 to June 2010 by rejection reason and sex.
|
Rejection reason
|
Female
|
Male
|
Total
|
|||
|---|---|---|---|---|---|---|
|
No.
|
%
|
No.
|
%
|
No.
|
%
|
|
|
Medical rejection reasons
|
||||||
| Less than 20 points impaired | 13,533 | 55.1 | 14,095 | 52.2 | 27,628 | 53.6 |
| Disability is short-term | 1,955 | 8.0 | 2,266 | 8.4 | 4,221 | 8.2 |
| Manifest - temporary | 805 | 3.3 | 851 | 3.1 | 1,656 | 3.2 |
| >20 pts impaired / can work 15+ hrs p/w | 653 | 2.7 | 887 | 3.3 | 1,540 | 3.0 |
| >20 pts Impaired / reskill 15+ hrs p/w | 609 | 2.5 | 661 | 2.4 | 1,270 | 2.5 |
| Manifest - can work 15 hrs p/w | 148 | 0.6 | 137 | 0.5 | 285 | 0.6 |
| Manifest - not sufficient impairment | 86 | 0.4 | 95 | 0.4 | 181 | 0.4 |
| Manifest - can work 30 hrs p/w | 15 | 0.1 | 20 | 0.1 | 35 | 0.1 |
| >20 pts impaired / can work full-time | 5 | 0.0 | 10 | 0.0 | 15 | 0.0 |
| >20 pts impaired / can be re-skilled | 2 | 0.0 | 5 | 0.0 | 7 | 0.0 |
| Not permanently blind | 5 | 0.0 | 4 | 0.0 | 9 | 0.0 |
| Total medical rejections | 17,816 | 72.5 | 19,031 | 70.4 | 36,847 | 71.4 |
|
Non-medical rejection reasons
|
||||||
| Failed to supply requested information | 4,022 | 16.4 | 4,999 | 18.5 | 9,021 | 17.5 |
| Excess income | 793 | 3.2 | 617 | 2.3 | 1,410 | 2.7 |
| Fail to attend assessment/med exam | 387 | 1.6 | 428 | 1.6 | 815 | 1.6 |
| Compensation related | 435 | 1.8 | 825 | 3.1 | 1,260 | 2.4 |
| Residence related | 424 | 1.7 | 342 | 1.3 | 766 | 1.5 |
| Failed agreement specific rules | 192 | 0.8 | 187 | 0.7 | 379 | 0.7 |
| Assets over limit | 111 | 0.5 | 130 | 0.5 | 241 | 0.5 |
| Withdrawn / voluntary surrender | 94 | 0.4 | 110 | 0.4 | 204 | 0.4 |
| Doesn't meet age requirements | 41 | 0.2 | 44 | 0.2 | 85 | 0.2 |
| Proof of identity not provided | 31 | 0.1 | 37 | 0.1 | 68 | 0.1 |
| Other | 211 | 0.9 | 271 | 1.0 | 482 | 0.9 |
| Total non-medical rejection reasons | 6,741 | 27.5 | 7,990 | 29.6 | 14,731 | 28.6 |
|
Total Rejections
|
24,557 | 100.0 | 27,021 | 100.0 | 51,578 | 100.0 |
Figure 31 shows the proportion of claims rejected for each sex in the period from June 2009 to June 2010, by the top five rejection reasons.
Figure 31 – Rejections by top 5 reasons and sex – 2009-10
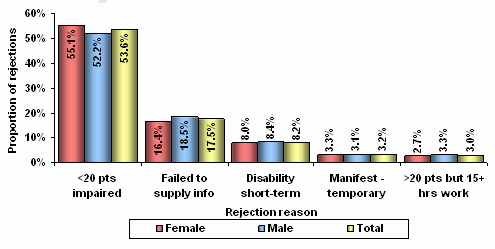
During the year June 2009 to June 2010 there were 142,709 claims for DSP finalised. Of these, 51,578 were rejected (36.1 percent). Medical rejections comprised 71.4 percent of all rejections, while non medical rejections comprised 28.6 percent.
The main reason for rejection of DSP claims was that claimants’ impairments were assessed at less than twenty points under the Impairment Tables (53.6 percent of all rejections), followed by failure to supply requested information (17.5 percent).
Males accounted for 52.4 percent of total rejections and females for 47.6 percent. Medical rejections comprised 72.5 percent of female rejections and 70.4 percent of male rejections.
For females, 55.1 percent of all rejections were because their impairment was assessed as less than twenty points under the impairment tables, for males this figure was 52.2 percent. Conversely, 18.5 percent of males and 16.4 percent of females were rejected for failing to provide requested information.
Table 32 details the number and proportion of DSP rejections by top five rejection reasons and others for the years from 2006-07 to 2009-10.
|
Year
|
Rejection Reason
|
Total
|
|||||||||||
|---|---|---|---|---|---|---|---|---|---|---|---|---|---|
|
<20 points impaired
|
Failed to supply info
|
Disability short - term
|
Manifest - temporary
|
>20 pts but 15+ hrs work
|
Other
|
||||||||
|
No.
|
%
|
No.
|
%
|
No.
|
%
|
No.
|
%
|
No.
|
%
|
No.
|
%
|
||
| 2006-07 | 10,178 | 27.7 | 5,765 | 15.7 | 10,517 | 28.6 | 1,071 | 2.9 | 1,678 | 4.6 | 7,601 | 20.6 | 36,810 |
| 2007-08 | 18,338 | 43.8 | 7,760 | 18.5 | 5,876 | 14.0 | 937 | 2.2 | 1,717 | 4.1 | 7,223 | 17.3 | 41,851 |
| 2008-09 | 23,341 | 48.8 | 9,338 | 19.5 | 4,388 | 9.2 | 1,644 | 3.4 | 1,464 | 3.1 | 7,649 | 16.0 | 47,824 |
| 2009-10 | 27,628 | 53.6 | 9,021 | 17.5 | 4,221 | 8.2 | 1,656 | 3.2 | 1,540 | 3.0 | 7,512 | 14.6 | 51,578 |
Figure 32 shows the proportion of DSP rejections for the top three reasons for rejections for the years from 2006-07 to 2009-10.
Figure 32 – Rejections by top 3 reasons and sex – 2009-10
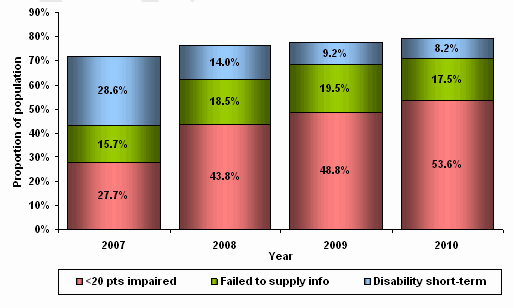
There has been a change in the reason for claims being rejected in the years from 2006-07 to 2009-10. In 2006-07 the proportion of rejections due to the claimant’s impairment being assessed as less than twenty points (against the Impairment Tables) was 27.7 percent. In 2009-10 that proportion had risen to 53.6 percent.
Over the same years the proportion of rejections because the claimant’s disability was of a short-term nature fell from 28.6 percent to 8.2 percent.
Table 33 details the number and percentage of clients of each sex with rejected DSP applications by the top five rejection reasons for the years 2006-07 to 2009-10.
|
Year
|
Rejection Reason
|
|||||||||||
|---|---|---|---|---|---|---|---|---|---|---|---|---|
|
<20 points impaired
|
Failed to supply info
|
Disability short - term
|
Manifest - temporary
|
>20 pts but 15+ hrs work
|
Other
|
|||||||
|
%
Female |
%
Male |
%
Female |
%
Male |
%
Female |
%
Male |
%
Female |
%
Male |
%
Female |
%
Male |
%
Female |
%
Male |
|
| 2006-07 | 28.5 | 26.9 | 15.2 | 16.1 | 28.8 | 28.4 | 3.2 | 2.7 | 4.2 | 4.9 | 20.1 | 21.0 |
| 2007-08 | 45.4 | 42.3 | 17.7 | 19.3 | 14.2 | 13.9 | 2.2 | 2.3 | 3.8 | 4.4 | 16.7 | 17.8 |
| 2008-09 | 50.4 | 47.4 | 18.5 | 20.5 | 9.1 | 9.3 | 3.4 | 3.5 | 2.8 | 3.3 | 15.8 | 16.0 |
| 2009-10 | 55.1 | 52.2 | 16.4 | 18.5 | 8.0 | 8.4 | 3.3 | 3.1 | 2.7 | 3.3 | 14.5 | 14.5 |
Figure 33 shows the percentage of each sex with rejected DSP applications by the top three rejection reasons for the years 2006-07 to 2009-10.
Figure 33 – Rejections by sex by top 3 rejection reasons – 2006-07 to 2009-10
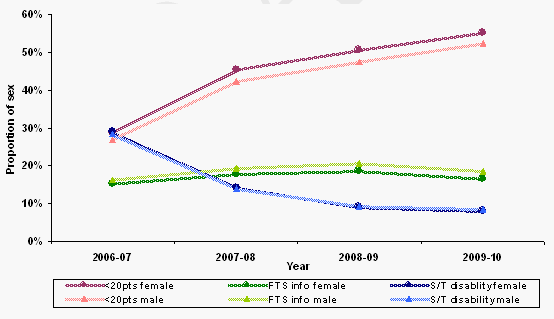
For the years from 2006-07 to 2009-10, a higher proportion of females than males were rejected on the basis that their impairment was assessed at less than twenty points against the Impairment Tables. A higher proportion of males than females were rejected for failing to supply requested information. Rejections because the claimant’s disability is short-term have remained gender-balanced.
5. Where DSP recipients are coming from and going to
5.1 Where DSP recipients are coming from
Table 34 details the number and proportion of ‘new entrants’4 between June 2009 and June 2010 by their previous income support payment.
|
Previous status / income support payment
|
No.
|
%
|
|---|---|---|
| Non Client | 38,972 | 45.8 |
| Newstart Allowance (NSA) | 32,065 | 37.7 |
| Parenting Payments (PP) | 6,142 | 7.2 |
| Youth Allowance (YA) | 2,137 | 2.5 |
| Carer Payment (CP) | 2,204 | 2.6 |
| Sickness Allowance (SA) | 1,068 | 1.3 |
| Widow Allowance (WA) | 820 | 1.0 |
| Partner Allowance (PA) | 490 | 0.6 |
| Other Income Support Payments | 1,125 | 1.3 |
| Total | 85,023 | 100.0 |
Figure 34 shows the proportion of new entrants between June 2009 and June 2010 by their previous income support payment.
Figure 34 – New entrants by previous income support type - 2010
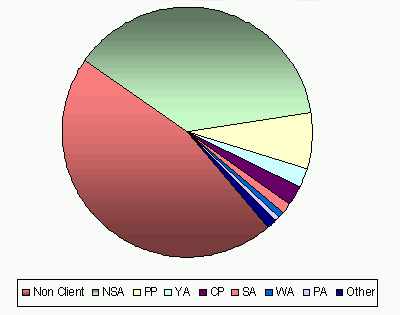
There were 85,023 DSP recipients in June 2010 who were not receiving DSP in June 2009. Of these ‘new entrants’, 45.8 percent were not receiving an income support payment in June 2009, while 54.2 percent were in receipt of another income support payment with Newstart Allowance being the most common accounting for 37.7 percent.
The remaining 16.4 percent of ‘new entrants’ to DSP were receiving a range of other payments, including Parenting Payment (Single & Partnered), Youth Allowance, Sickness Allowance and Partner Allowance.
Table 35 details the number and proportion of ‘new entrants’ for each reporting year by their previous income support type for the reporting years from 2001 to 2010.
|
Year
|
Income Support Type
|
Total Income Support
|
Non Client
|
Total new entrants
|
|||||||
|---|---|---|---|---|---|---|---|---|---|---|---|
|
Newstart Allowance
|
Parenting Payments
|
Other
|
|||||||||
|
No.
|
%
|
No.
|
%
|
No.
|
%
|
No.
|
%
|
No.
|
%
|
||
| 2001 | 26,543 | 34.4 | 4,314 | 5.6 | 11,788 | 15.3 | 42,645 | 55.2 | 34,554 | 44.8 | 77,199 |
| 2002 | 27,787 | 35.0 | 3,754 | 4.7 | 12,839 | 16.2 | 44,380 | 55.9 | 35,070 | 44.1 | 79,450 |
| 2003 | 22,180 | 32.9 | 3,745 | 5.6 | 10,862 | 16.1 | 36,787 | 54.6 | 30,622 | 45.4 | 67,409 |
| 2004 | 22,739 | 32.3 | 4,045 | 5.7 | 11,698 | 16.6 | 38,482 | 54.6 | 32,024 | 45.4 | 70,506 |
| 2005 | 21,238 | 32.7 | 4,108 | 6.3 | 10,198 | 15.7 | 35,544 | 54.7 | 29,410 | 45.3 | 64,954 |
| 2006 | 18,954 | 32.8 | 3,751 | 6.5 | 8,546 | 14.8 | 31,251 | 54.1 | 26,547 | 45.9 | 57,798 |
| 2007 | 20,839 | 34.1 | 4,471 | 7.3 | 8,745 | 14.3 | 34,055 | 55.8 | 27,008 | 44.2 | 61,063 |
| 2008 | 24,398 | 35.2 | 8,326 | 12.0 | 6,172 | 8.9 | 38,896 | 56.2 | 30,355 | 43.8 | 69,251 |
| 2009 | 29,584 | 36.6 | 6,453 | 8.0 | 6,862 | 8.5 | 42,899 | 53.0 | 38,010 | 47.0 | 80,909 |
| 2010 | 32,065 | 37.7 | 6,142 | 7.2 | 7,844 | 9.2 | 46,051 | 54.2 | 38,972 | 45.8 | 85,023 |
Figure 35 shows the proportion of ‘new entrants’ for each reporting year by their previous income support payment type for the reporting years from 2001 to 2010.
Figure 35 – New entrants by prior income support type – 2001 to 2010
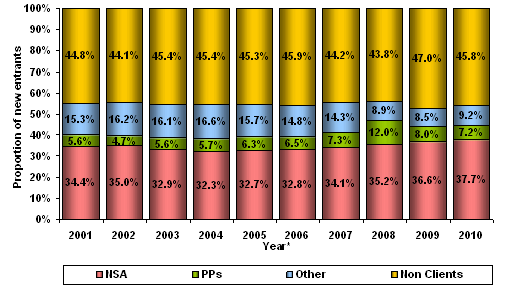
*Denotes year of report – ie clients counted were in receipt of DSP as at June of that year but not June of the year before
In the 2001 reporting year, the proportion of ‘new entrants’ to DSP whose previous income support payment type was Newstart Allowance was 34.4 percent. That figure fell to 32.3 percent in 2004, and since then has risen to 37.7 percent in 2010.
In the 2008 reporting year, there was a sharp increase in proportion of new entrants whose previous income support payment type was Parenting Payment.
The proportion of ‘new entrants’ who were not in receipt of another income support payment a year before the report date has been reasonably steady at around 45 percent in the reporting years from 2001 to 2010, having risen to 47.0 percent in the 2009 reporting year before falling to the current level of 45.8 percent.
5.2 Where DSP recipients are exiting to
Table 36 details the number and proportion of clients who were DSP recipients as at June 2009 but no longer in receipt as at June 2010 (‘exits from DSP’) by their subsequent status or income support payment type.
|
Subsequent status / income support type
|
No.
|
%
|
|---|---|---|
| Age Pension | 27,478 | 55.4 |
| Non Client | 20,580 | 41.5 |
| Newstart/Youth Allowance | 620 | 1.3 |
| Carer Payment | 522 | 1.1 |
| Parenting Payment | 84 | 0.2 |
| Other Income Support Payments | 276 | 0.6 |
| Total | 49,560 | 100.0 |
Figure 36 shows the proportion of ‘exits from DSP’ by subsequent status or income support payment type as at June 2010.
Figure 36 – Exits by subsequent status/income support payment type - 2010
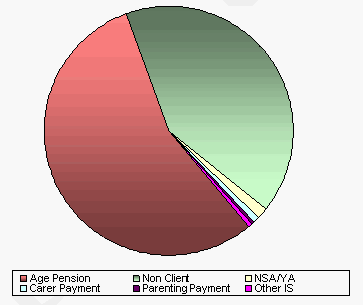
There were 49,560 clients who were in receipt of DSP as at June 2009 who were no longer receiving that pension in June 2010. Of these, 27,478 (55.4 percent) exited to Age Pension and 20,580 (41.5 percent) were no longer in receipt of income support or were deceased.
Table 37 details the number and proportion of ‘exits from DSP’ by their subsequent status or income support payment type for the reporting years from 2001 to 2010.
|
Year
|
Income Support Type
|
Total Income Support
|
Non Client
(includes deceased) |
Total exits
|
|||||
|---|---|---|---|---|---|---|---|---|---|
|
Age Pension
|
Other
|
||||||||
|
No.
|
%
|
No.
|
%
|
No.
|
%
|
No.
|
%
|
||
| 2001 | 30,028 | 58.3 | 2,268 | 4.4 | 32,296 | 62.7 | 19,211 | 37.3 | 51,507 |
| 2002 | 25,315 | 52.5 | 2,511 | 5.2 | 27,826 | 57.8 | 20,354 | 42.2 | 48,180 |
| 2003 | 31,146 | 56.7 | 2,681 | 4.9 | 33,827 | 61.6 | 21,112 | 38.4 | 54,939 |
| 2004 | 24,246 | 50.2 | 2,828 | 5.9 | 27,074 | 56.0 | 21,260 | 44.0 | 48,334 |
| 2005 | 32,521 | 55.6 | 2,898 | 5.0 | 35,419 | 60.5 | 23,085 | 39.5 | 58,504 |
| 2006 | 26,224 | 48.4 | 3,692 | 6.8 | 29,916 | 55.2 | 24,245 | 44.8 | 54,161 |
| 2007 | 32,160 | 53.3 | 3,641 | 6.0 | 35,801 | 59.4 | 24,494 | 40.6 | 60,295 |
| 2008 | 24,431 | 47.8 | 3,652 | 7.1 | 28,083 | 54.9 | 23,047 | 45.1 | 51,130 |
| 2009 | 34,018 | 60.6 | 2,157 | 3.8 | 36,175 | 64.4 | 19,983 | 35.6 | 56,158 |
| 2010 | 27,478 | 55.4 | 1,502 | 3.0 | 28,980 | 58.5 | 20,580 | 41.5 | 49,560 |
* Denotes the reporting year – ie the clients counted were not receiving DSP in June of that year but were DSP recipients in June of the previous year.
In the reporting years from 2001 to 2010 there is a fluctuation in the number of recipients exiting to Age Pension with odd numbered years having a higher value and even numbered years a lower value. This pattern coincides with the changing Age Pension qualification age for women, which has been rising by six months every two years.
Figure 37 shows the proportion of ‘exits from DSP’ by the subsequent status or income support type for the reporting years from 2001 to 2010. Reporting years have been paired to eliminate the fluctuation mentioned above.
Figure 37 – Exits by subsequent income support type - 2001 to 2010
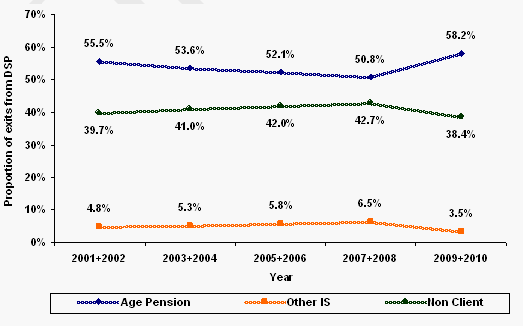
In the years from 2001 to 2008 the proportion of exits from DSP to Age Pension fell from 55.5 percent to 50.8 percent. In 2009-2010 it increased to 58.2 percent.
- Grant rate (%) = Grants/(Grants + Rejections) x 100
- Note that the number of ‘new entrants’ is not the same as the number of grants. This is because ‘new entrants’ are people on DSP in June 2010 who were not receiving DSP in June 2009, while the number of grants is a count of claims granted during a period and some clients may be granted more than once in the period, ie they may be granted, cancelled and re-granted or no longer be receiving DSP as at June 2010.
- See footnote1.
- See footnote 2.
Last updated:

