Characteristics of Disability Support Pension Customers, June 2004
Attachments
Table of Contents
- Overview
- 1. Disability Support Pension Population Characteristics
- 2. Medical Condition
- 3. Earnings and Duration on Income Support
- 4. New Claims
- 5. Where DSP Recipients are Coming From and Going To
Disability Support Pension - Overview
Who is this Payment for?
Disability Support Pension (DSP) is paid to people who are unable to work for at least 30 hours per week, or be re-skilled for such work, for more than two years because of a disability. DSP is intended to ensure that people with disabilities have adequate levels of income and maximum opportunities to participate in society.
Eligibility Requirements
To qualify for DSP a person must:
be over 16 and be under Age Pension age (currently 62½ for women and 65 for men); and
- be permanently blind; or
- have a physical, intellectual or psychiatric impairment (assessed at 20 points or more under the Impairment Tables); and be unable to do any work, or be re-skilled for any work, for a period of at least two years; and
- have become unable to work while in Australia, or have 10 years qualifying Australian residence.
Trends
As at June 2004, there were 696,742 people receiving DSP. Almost two thirds of these customers were aged 45 years or over; 60.1% were male; 72.9% were born in Australia; and, on average, they had been in receipt of an income suuport payment for 7.9 years. The three main medical conditions were musculo-skeletal or connective tissue conditions, representing 34.0% of the total DSP population, psychological/psychiatric conditions, representing 25.4%, and intellectual/learning difficulties, representing 10.7%.
Since 1982 the DSP customer population has been steadily increasing, with the greatest growth, of 13.3%, occurring in 1992 following the introduction of the Disability Reform Package (DSP replaced the Invalid Pension and Sheltered Employment Allowance in November 1991). Between 1996 and 2001 the growth rate reduced gradually from 7.5% to 3.6%. It increased to 5.6% in 2002, dropped to 2.2% in 2003 (with the introduction of the AWT Better Assessment and Early Intervention initiative) and increased again in 2004 to 3.5%. The proportion of females on DSP has increased each year since 1989 and now represents 39.9% of the total DSP population.
Over 74,000 claims for DSP were granted in the 2003-04 financial year and just over 43,000 claims rejected (36.7% of total claims processed). Lack of medical eligibility was the main reason for rejecting a claim for DSP (37.8%).
Of people coming onto DSP in the 12 month period prior to June 2004, over half came from other income support payments (32.3% from Newstart or Youth Allowance, 5.7% from Parenting Payments and 1.8% from Sickness Allowance), while 45.4% had not been in receipt of an income support payment.
1. Disability Support Pension Population Characteristics
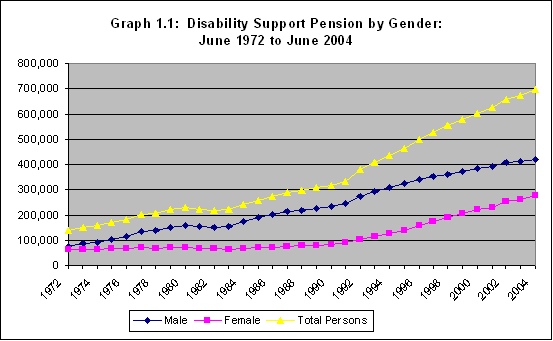
1.1 Customers by Gender 1972 to 2004
As at June 2004, the number of people receiving Disability Support Pension (DSP) was 696,742 and has been steadily increasing since 1982, with the greatest growth period (13.3%) occurring in 1992 following the introduction of the Disability Reform Package. The growth rate in DSP for 2003-04 was 3.5%, up on the 2.2% increase in 2002-03.
Several factors have been suggested as contributing to the increases in the DSP customer numbers in the last decade:
- changed eligibility criteria for disability payments following the introduction of the Disability Reform Package;
- loss of access to other forms of support such as Veterans' Affairs Service Pension, Widow B and Wife Pension;
- increases in the Age Pension qualifying age for females;
- demographic effects such as the ageing of the population; and
- changes in the labour market which have resulted in a reduced capacity for people with disabilities to retain or find work.
The proportion of the DSP population that is female has been increasing, from a low of 26.2% in 1989 to the current figure of 39.9%.
Source: Characteristics of Disability Support Pension Customers (June 2003); Superstar Pensions Database 11/06/2004
| At June each year | Males | Females | Total Persons | |||||
|---|---|---|---|---|---|---|---|---|
| Count | Change | % of Total | Count | Change | % of Total | Count | % Growth | |
| 1972 | 77,133 | 55.6% | 61,685 | 44.4% | 138,818 | |||
| 1973 | 85,305 | 8,172 | 57.0% | 64,304 | 2,619 | 43.0% | 149,609 | 7.8% |
| 1974 | 92,140 | 6,835 | 58.8% | 64,643 | 339 | 41.2% | 156,783 | 4.8% |
| 1975 | 102,817 | 10,677 | 60.9% | 65,967 | 1,324 | 39.1% | 168,784 | 7.7% |
| 1976 | 116,118 | 13,301 | 63.2% | 67,669 | 1,702 | 36.8% | 183,787 | 8.9% |
| 1977 | 133,209 | 17,091 | 65.6% | 69,754 | 2,085 | 34.4% | 202,963 | 10.4% |
| 1978 | 137,245 | 4,036 | 67.0% | 67,699 | -2,055 | 33.0% | 204,944 | 1.0% |
| 1979 | 149,759 | 12,514 | 68.1% | 70,084 | 2,385 | 31.9% | 219,843 | 7.3% |
| 1980 | 158,327 | 8,568 | 69.1% | 70,892 | 808 | 30.9% | 229,219 | 4.3% |
| 1981 | 153,889 | -4,438 | 69.3% | 68,062 | -2,830 | 30.7% | 221,951 | -3.2% |
| 1982 | 151,146 | -2,743 | 69.8% | 65,503 | -2,559 | 30.2% | 216,649 | -2.4% |
| 1983 | 155,672 | 4,526 | 70.7% | 64,617 | -886 | 29.3% | 220,289 | 1.7% |
| 1984 | 173,063 | 17,391 | 71.9% | 67,511 | 2,894 | 28.1% | 240,574 | 9.2% |
| 1985 | 188,713 | 15,650 | 72.8% | 70,449 | 2,938 | 27.2% | 259,162 | 7.7% |
| 1986 | 200,898 | 12,185 | 73.4% | 72,912 | 2,463 | 26.6 | 273,810 | 5.7 |
| 1987 | 213,290 | 12,392 | 73.8 | 75,760 | 2,848 | 26.2 | 289,050 | 5.6 |
| 1988 | 219,168 | 5,878 | 73.8 | 77,745 | 1,985 | 26.2% | 296,913 | 2.7% |
| 1989 | 227,285 | 8,117 | 73.8% | 80,510 | 2,765 | 26.2% | 307,795 | 3.7% |
| 1990 | 233,251 | 5,966 | 73.6% | 83,462 | 2,952 | 26.4% | 316,713 | 2.9% |
| 1991 | 244,699 | 11,448 | 73.2% | 89,535 | 6,073 | 26.8% | 334,234 | 5.5% |
| 1992 | 273,697 | 28,998 | 72.3% | 104,861 | 15,326 | 27.7% | 378,558 | 13.3% |
| 1993 | 291,471 | 17,774 | 71.7% | 115,101 | 10,240 | 28.3% | 406,572 | 7.4% |
| 1994 | 309,123 | 17,652 | 70.9% | 127,111 | 12,010 | 29.1% | 436,234 | 7.3% |
| 1995 | 324,672 | 15,549 | 69.9% | 139,758 | 12,647 | 30.1% | 464,430 | 6.5% |
| 1996 | 340,256 | 15,584 | 68.2% | 158,979 | 19,221 | 31.8% | 499,235 | 7.5% |
| 1997 | 352,607 | 12,351 | 66.8% | 174,907 | 15,928 | 33.2% | 527,514 | 5.7% |
| 1998 | 361,539 | 8,932 | 65.3% | 191,797 | 16,890 | 34.7% | 553,336 | 4.9% |
| 1999 | 373,340 | 11,801 | 64.6% | 204,342 | 12,545 | 35.4% | 577,682 | 4.4% |
| 2000 | 382,351 | 9,011 | 63.5% | 219,929 | 15,587 | 36.5% | 602,280 | 4.3% |
| 2001 | 392,354 | 10,003 | 62.9% | 231,572 | 11,643 | 37.1% | 623,926 | 3.6% |
| 2002 | 406,893 | 14,539 | 61.8% | 252,022 | 20,450 | 38.2% | 658,915 | 5.6% |
| 2003 | 412,777 | 5,885 | 61.3% | 260,557 | 8,536 | 38.7% | 673,334 | 2.2% |
| 2004 | 418,829 | 6,052 | 60.1% | 277,913 | 17,356 | 39.9% | 696,742 | 3.5% |
Source: Characteristics of Disability Support Pension Customers (June 2003)
Superstar Pensions Database 11/06/2004
From 1972 to the introduction of the Disability Reform Package in 1991 the number of male customers more than tripled (77,133 to 244,699). In the same period of time the number of female customers increased by less than half (61,685 to 89,535).
From 1991 to 2004 the number of male customers has less than doubled (244,699 to 418,829) while the number of female customers has more than tripled (89,535 to 277,913).
1.2 Customers by Age and Gender
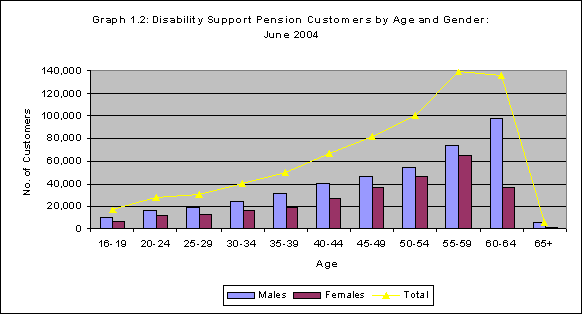
People aged 55 years and over represent 40.3% of the overall DSP customer population. The smaller proportion of females in the 60 to 64 years age group is due to the lower Age Pension qualifying age for women, currently 62½ years. As the qualifying age increases for females, it is expected that this age group will grow and eventually exceed the number in the 55 to 59 years age group. The trend in the graph below is consistent with the trend for all Australians with a disability, which shows that the occurrence of a disability increases with age.
Source: Superstar Pensions Database 11/06/2004
| Age | Males | % | Females | % | Total | % |
|---|---|---|---|---|---|---|
| 16-19 | 10,139 | 2.4% | 6,692 | 2.4% | 16,831 | 2.4% |
| 20-24 | 16,302 | 3.9% | 11,628 | 4.2% | 27,930 | 4.0% |
| 25-29 | 18,368 | 4.4% | 12,370 | 4.5% | 30,738 | 4.4% |
| 30-34 | 24,527 | 5.9% | 16,276 | 5.9% | 40,803 | 5.9% |
| 35-39 | 30,794 | 7.4% | 19,296 | 6.9% | 50,090 | 7.2% |
| 40-44 | 40,203 | 9.6% | 26,841 | 9.7% | 67,044 | 9.6% |
| 45-49 | 46,019 | 11.0% | 35,899 | 12.9% | 81,918 | 11.8% |
| 50-54 | 54,341 | 13.0% | 46,241 | 16.6% | 100,582 | 14.4% |
| 55-59 | 74,551 | 17.8% | 64,600 | 23.2% | 139,151 | 20.0% |
| 60-64 | 98,103 | 23.4% | 37,514 | 13.5% | 135,617 | 19.5% |
| 65+ | 5,482 | 1.3% | 556 | 0.2% | 6,038 | 0.9% |
| Total | 418,829 | 100.0% | 277,913 | 100.0% | 696,742 | 100.0% |
Source: Superstar Pensions Database 11/06/2004
Males represent the majority of customers in all age groups. Females made up 46.4% of customers in the 55-59 year old age group and only 38.5% of customers in the 35‑39 year old age group. As mentioned above, the proportion of females in the 60‑64 age group continues to increase (up from 22.2% in 2003 to 27.7% in 2004) as the qualifying age for Age Pension for women increases.
1.3 Customers by Geographic State
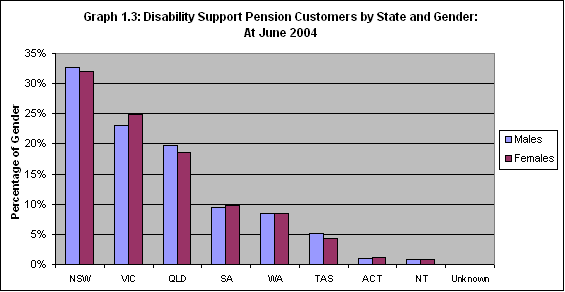
As expected the majority of DSP customers can be found in the more populous Australian States. New South Wales is the largest with 32.4% of the DSP population, while the Northern Territory is the smallest with 0.8%.
The ACT has the highest percentage of females (44.4%) while Tasmania has the lowest (36.0%).
When compared with the ABS Census 2001, the proportion of DSP customers living in Tasmania and South Australia is higher than the proportion of the total Australian population in these States.
Source: Superstar Pensions Database 11/06/2004
| State | Male | % | Female | % | Total DSP | DSP % | ABS Census 2001 |
|---|---|---|---|---|---|---|---|
| NSW | 136,740 | 32.6% | 88,909 | 32.0% | 225,649 | 32.4% | 33.6% |
| VIC | 96,224 | 23.0% | 69,353 | 25.0% | 165,577 | 23.8% | 24.5% |
| QLD | 82,384 | 19.7% | 51,843 | 18.7% | 134,227 | 19.3% | 19.3% |
| SA | 39,277 | 9.4% | 27,006 | 9.7% | 66,283 | 9.5% | 7.7% |
| WA | 35,280 | 8.4% | 23,448 | 8.4% | 58,728 | 8.4% | 9.8% |
| TAS | 21,309 | 5.1% | 11,981 | 4.3% | 33,290 | 4.8% | 2.4% |
| ACT | 3,879 | 0.9% | 3,103 | 1.1% | 6,982 | 1.0% | 1.6% |
| NT | 3,542 | 0.8% | 2,169 | 0.8% | 5,711 | 0.8% | 1.1% |
| Unknown | 194 | 0.0% | 101 | 0.0% | 295 | 0.0% | |
| Total | 418,829 | 100.0% | 277,913 | 100.0% | 696,742 | 100.0% | 100.0% |
Source: Superstar Pensions Database 11/06/2004
ABS Census of Population and Housing 2015.0, 2001
Note: Tasmanian figures include customers living overseas (approximately 8,500).
1.4 Customers by Country of Birth
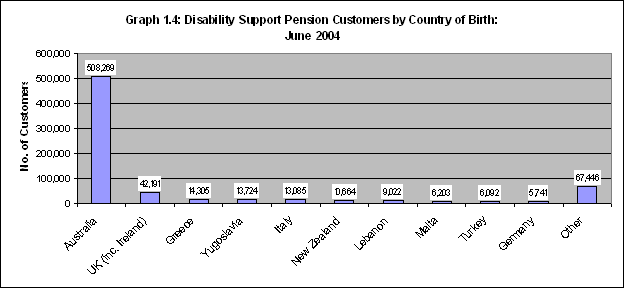
The following graph and table reports on the country of birth of DSP customers. The 10 countries with the highest number of customers are shown.
The majority of DSP customers were born in Australia (72.9%). The next largest group was those born in the United Kingdom (including Ireland) (6.1%). When compared with ABS Census 2001 country of birth data, 9 out of the top 10 countries are over-represented on DSP (the exception being New Zealand).
Source: Superstar Pensions Database 11/06/2004
| Country of Birth | Males | % | Females | % | Total DSP | DSP % | ABS Census 2001 |
|---|---|---|---|---|---|---|---|
| Australia | 302,417 | 72.2% | 205,852 | 74.1% | 508,269 | 72.9% | 71.8% |
| UK (inc. Ireland) | 26,348 | 6.3% | 15,843 | 5.7% | 42,191 | 6.1% | 5.7% |
| Greece | 8,700 | 2.1% | 5,605 | 2.0% | 14,305 | 2.1% | 0.6% |
| Yugoslavia | 8,838 | 2.1% | 4,886 | 1.8% | 13,724 | 2.0% | 0.3% |
| Italy | 8,422 | 2.0% | 4,663 | 1.7% | 13,085 | 1.9% | 1.2% |
| New Zealand | 6,409 | 1.5% | 4,255 | 1.5% | 10,664 | 1.5% | 1.9% |
| Lebanon | 6,183 | 1.5% | 2,839 | 1.0% | 9,022 | 1.3% | 0.4% |
| Malta | 4,436 | 1.1% | 1,767 | 0.6% | 6,203 | 0.9% | 0.2% |
| Turkey | 3,350 | 0.8% | 2,742 | 1.0% | 6,092 | 0.9% | 0.2% |
| Germany | 3,567 | 0.9% | 2,174 | 0.8% | 5,741 | 0.8% | 0.6% |
| Other | 40,159 | 9.6% | 27,287 | 9.8% | 67,446 | 9.7% | 17.1% |
| Total | 418,829 | 100.0% | 277,913 | 100.0% | 696,742 | 100.0% | 100.0% |
Source: Superstar Pensions Database 11/06/04; ABS Census of Population and Housing 2015.0, 2001
While males only represent 49.4% of the Australian population (ABS Census 2001), they represent 60.1% of the DSP population (June 2004). Males are over represented on DSP for all ten countries listed above, with Malta (71.5% of DSP compared to 51.9% reported in the ABS Census 2001) and Lebanon (68.5% of DSP compared to 52.0% reported in the ABS Census 2001) being the highest. Turkey is the lowest of the ten countries at 55.0% and 51.5% respectively.
1.5 Customers by Marital Status and Gender
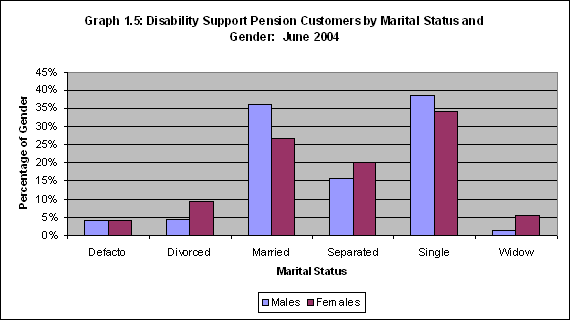
The majority of DSP customers are not partnered (63.5%) with females more likely to not have a partner than males (69.0% of the female population are not partnered, compared to 59.8% of males). Proportionally, males and females are similar in the
de facto category (4.2%). Males are more likely than females to be married or single while females are more likely to be divorced, separated or widowed.
The higher percentages of divorced, separated and widowed women could be the result of a number of factors:
Source: Superstar Pensions Database 11/06/2004
| Marital Status | Males | % | Females | % | Total | % |
|---|---|---|---|---|---|---|
| De facto | 17,516 | 4.2% | 11,754 | 4.2% | 29,270 | 4.2% |
| Divorced | 18,124 | 4.3% | 26,148 | 9.4% | 44,272 | 6.4% |
| Married | 150,873 | 36.0% | 74,449 | 26.8% | 225,322 | 32.3% |
| Separated | 65,143 | 15.6% | 55,774 | 20.1% | 120,917 | 17.4% |
| Single | 161,796 | 38.6% | 94,865 | 34.1% | 256,661 | 36.8% |
| Widow | 5,377 | 1.3% | 14,923 | 5.4% | 20,300 | 2.9% |
| Total | 418,829 | 100.0% | 277,913 | 100.0% | 696,742 | 100.0% |
Source: Superstar Pensions Database 11/06/2004
1.6 Customers by Gender and Home Ownership
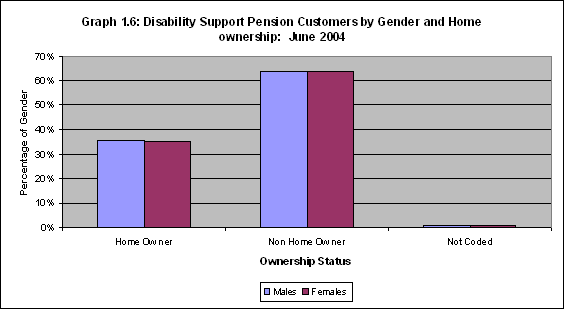
The majority of DSP customers do not own their home (63.8%). Males receiving DSP are marginally more likely to own a home, including paying it off, than females (35.6% compared to 35.3%).
Source: Superstar Pensions Database 11/06/2004
| Housing Status | Males | % | Females | % | Total | % |
|---|---|---|---|---|---|---|
| Home Owner | 149,014 | 35.6% | 98,136 | 35.3% | 247,150 | 35.5% |
| Non Home Owner | 266,569 | 63.6% | 177,608 | 63.9% | 444,177 | 63.8% |
| Not Coded | 3,246 | 0.8% | 2,169 | 0.8% | 5,415 | 0.8% |
| Total | 418,829 | 100.0% | 277,913 | 100.0% | 696,742 | 100.0% |
Source: Superstar Pensions Database 11/06/2004
1.7 Customers by Age and Home Ownership
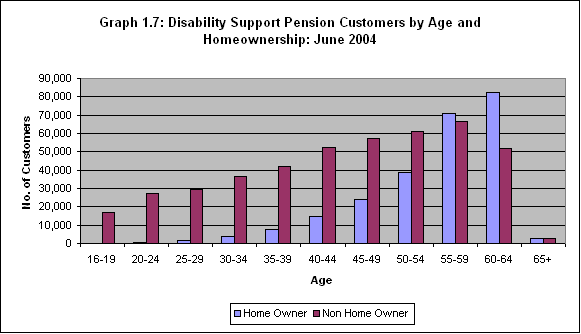
DSP customers who own their own home (either own their home outright or are paying it off) tend to be skewed towards the older age groups with the 55+ age groups containing more homeowners than non-homeowners. 91.6% of customers aged less than 40 are non-homeowners.
Source: Superstar Pensions Database 11/06/2004
| Age | Home Owner | % | Non Home Owner | % | Other | % | Total | % |
|---|---|---|---|---|---|---|---|---|
| 16-19 | 143 | 0.1% | 16,680 | 3.8% | 8 | 0.1% | 16,831 | 2.4% |
| 20-24 | 447 | 0.2% | 27,466 | 6.2% | 17 | 0.3% | 27,930 | 4.0% |
| 25-29 | 1,480 | 0.6% | 29,215 | 6.6% | 43 | 0.8% | 30,738 | 4.4% |
| 30-34 | 3,942 | 1.6% | 36,791 | 8.3% | 70 | 1.3% | 40,803 | 5.9% |
| 35-39 | 7,752 | 3.1% | 42,222 | 9.5% | 116 | 2.1% | 50,090 | 7.2% |
| 40-44 | 14,622 | 5.9% | 52,154 | 11.7% | 268 | 4.9% | 67,044 | 9.6% |
| 45-49 | 24,035 | 9.7% | 57,404 | 12.9% | 479 | 8.8% | 81,918 | 11.8% |
| 50-54 | 38,526 | 15.6% | 61,142 | 13.8% | 914 | 16.9% | 100,582 | 14.4% |
| 55-59 | 71,104 | 28.8% | 66,495 | 15.0% | 1,552 | 28.7% | 139,151 | 20.0% |
| 60-64 | 82,120 | 33.2% | 51,692 | 11.6% | 1,805 | 33.3% | 135,617 | 19.5% |
| 65+ | 2,979 | 1.2% | 2,916 | 0.7% | 143 | 2.6% | 6,038 | 0.9% |
| Total | 247,150 | 100.0% | 444,177 | 100.0% | 5,415 | 100.0% | 696,742 | 100.0% |
Source: Superstar Pensions Database 11/06/2004
-
- Women who have separated from a spouse who was the main income earner which resulted in them having to seek income support;
- The closing off of payments such as Widow B Pension; and
- The shorter lifespan of men increasing the probability of widowhood among women.
2. Medical Condition
2.1 Customers by Medical Condition
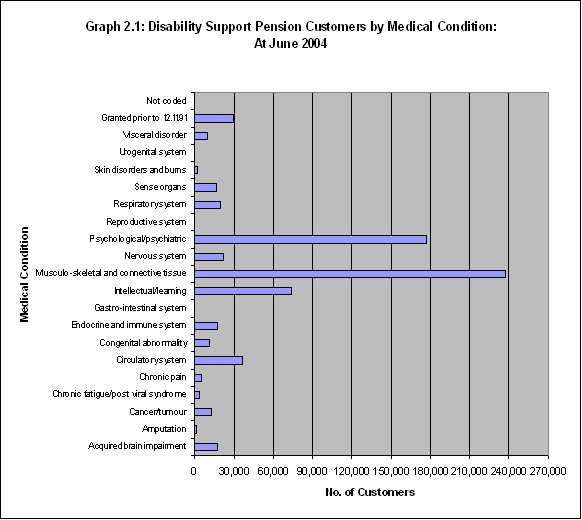
With the introduction of the DSP in 1991, the medical condition of customers was collected and recorded on their Centrelink record. Most of the customers on payment prior to 1991 have since had their medical condition recorded (or have left payment) although at June 2004, 4.2% of the total DSP population still do not have their medical condition recorded.
The medical conditions reported here represent the primary condition that is recorded on a customer's record.
The three largest groups are customers with Musculo-skeletal/Connective tissue (34.0%), Psychological/ Psychiatric (25.4%) or Intellectual/Learning medical conditions (10.7%).
10,538 (1.5%) of DSP customers are identified as being blind.
Source: Superstar Pensions Database 11/06/2004
2.2 Customers by Medical Condition and Gender
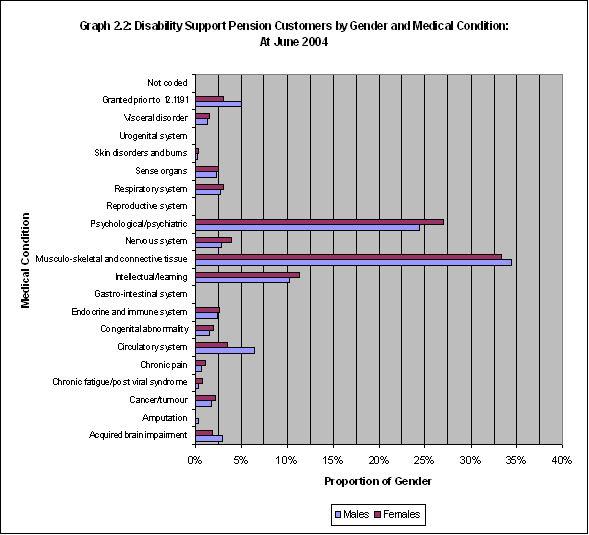
Males and females show a similar distribution of medical conditions. The only noticeable differences (ie. a greater than 2 percentage point difference) are for customers with Psychological/Psychiatric conditions (24.3% male compared to 27.0% female) and for customers with circulatory conditions (6.4% male and 3.5% female).
More males were former Invalid Pension recipients (granted prior to 1991) than females and therefore do not have their medical condition coded. This needs to be taken into account when interpreting the data as this may contribute to situations where the percentage of females with a particular condition appears greater than the percentage of males.
Source: Superstar Pensions Database 11/06/2004
| Medical Condition | Males | % | Females | % | Total | % |
|---|---|---|---|---|---|---|
| Acquired brain impairment | 12,417 | 3.0% | 4,920 | 1.8% | 17,337 | 2.5% |
| Amputation | 1,378 | 0.3% | 342 | 0.1% | 1,720 | 0.2% |
| Cancer/tumour | 7,198 | 1.7% | 6,160 | 2.2% | 13,358 | 1.9% |
| Chronic fatigue/post viral syndrome | 1,462 | 0.3% | 1,973 | 0.7% | 3,435 | 0.5% |
| Chronic pain | 2,609 | 0.6% | 3,124 | 1.1% | 5,733 | 0.8% |
| Circulatory system | 26,866 | 6.4% | 9,641 | 3.5% | 36,507 | 5.2% |
| Congenital abnormality | 6,163 | 1.5% | 5,245 | 1.9% | 11,408 | 1.6% |
| Endocrine and immune system | 10,167 | 2.4% | 7,364 | 2.6% | 17,531 | 2.5% |
| Gastro-intestinal system | 214 | 0.1% | 271 | 0.1% | 485 | 0.1% |
| Intellectual/learning | 43,108 | 10.3% | 31,345 | 11.3% | 74,453 | 10.7% |
| Musculo-skeletal and connective tissue | 144,325 | 34.5% | 92,778 | 33.4% | 237,103 | 34.0% |
| Nervous system | 11,823 | 2.8% | 10,827 | 3.9% | 22,650 | 3.3% |
| Psychological/psychiatric | 101,937 | 24.3% | 75,111 | 27.0% | 177,048 | 25.4% |
| Reproductive system | 7 | 0.0% | 30 | 0.0% | 37 | 0.0% |
| Respiratory system | 11,526 | 2.8% | 8,315 | 3.0% | 19,841 | 2.8% |
| Sense organs | 9,605 | 2.3% | 6,942 | 2.5% | 16,547 | 2.4% |
| Skin disorders and burns | 1,045 | 0.2% | 794 | 0.3% | 1,839 | 0.3% |
| Urogenital system | 116 | 0.0% | 95 | 0.0% | 211 | 0.0% |
| Visceral disorder | 5,388 | 1.3% | 4,174 | 1.5% | 9,562 | 1.4% |
| Granted prior to 12.11.91 | 21,281 | 5.1% | 8,312 | 3.0% | 29,593 | 4.2% |
| Not coded | 194 | 0.0% | 150 | 0.1% | 344 | 0.0% |
| Total | 418,829 | 100.0% | 277,913 | 100.0% | 696,742 | 100.0% |
Source: Pensions Superstar Database 11/06/2004
| Medical Condition | Males | % | Females | % | Total | % |
|---|---|---|---|---|---|---|
| Acquired brain impairment | 12,417 | 71.6% | 4,920 | 28.4% | 17,337 | 100.0% |
| Amputation | 1,378 | 80.1% | 342 | 19.9% | 1,720 | 100.0% |
| Cancer/tumour | 7,198 | 53.9% | 6,160 | 46.1% | 13,358 | 100.0% |
| Chronic fatigue/post viral syndrome | 1,462 | 42.6% | 1,973 | 57.4% | 3,435 | 100.0% |
| Chronic pain | 2,609 | 45.5% | 3,124 | 54.5% | 5,733 | 100.0% |
| Circulatory system | 26,866 | 73.6% | 9,641 | 26.4% | 36,507 | 100.0% |
| Congenital abnormality | 6,163 | 54.0% | 5,245 | 46.0% | 11,408 | 100.0% |
| Endocrine and immune system | 10,167 | 58.0% | 7,364 | 42.0% | 17,531 | 100.0% |
| Gastro-intestinal system | 214 | 44.1% | 271 | 55.9% | 485 | 100.0% |
| Intellectual/learning | 43,108 | 57.9% | 31,345 | 42.1% | 74,453 | 100.0% |
| Musculo-skeletal and connective tissue | 144,325 | 60.9% | 92,778 | 39.1% | 237,103 | 100.0% |
| Nervous system | 11,823 | 52.2% | 10,827 | 47.8% | 22,650 | 100.0% |
| Psychological/psychiatric | 101,937 | 57.6% | 75,111 | 42.4% | 177,048 | 100.0% |
| Reproductive system | 7 | 18.9% | 30 | 81.1% | 37 | 100.0% |
| Respiratory system | 11,526 | 58.1% | 8,315 | 41.9% | 19,841 | 100.0% |
| Sense organs | 9,605 | 58.0% | 6,942 | 42.0% | 16,547 | 100.0% |
| Skin disorders and burns | 1,045 | 56.8% | 794 | 43.2% | 1,839 | 100.0% |
| Urogenital system | 116 | 55.0% | 95 | 45.0% | 211 | 100.0% |
| Visceral disorder | 5,388 | 56.3% | 4,174 | 43.7% | 9,562 | 100.0% |
| Granted prior to 12.11.91 | 21,281 | 71.9% | 8,312 | 28.1% | 29,593 | 100.0% |
| Not coded | 194 | 56.4% | 150 | 43.6% | 344 | 100.0% |
| Total | 418,829 | 60.1% | 277,913 | 39.9% | 696,742 | 100.0% |
Source: Pensions Superstar Database 11/06/2004
Of the medical condition groups listed in table 2.1, females outnumbered males in only four groups. These groups are Chronic Fatigue/Post Viral Syndrome (57.4%), Chronic Pain (54.5%), Gastro-intestinal system (55.9%) and Reproductive system (81.1%).
Male customers make up 80.1% of the Amputation medical condition group. The next highest male dominated group is Circulatory System with 73.6% followed by Acquired Brain Injury with 71.6%.
2.3 Customers by Musculo-skeletal/Connective tissue, Psychological/Psychiatric and Intellectual Medical Conditions
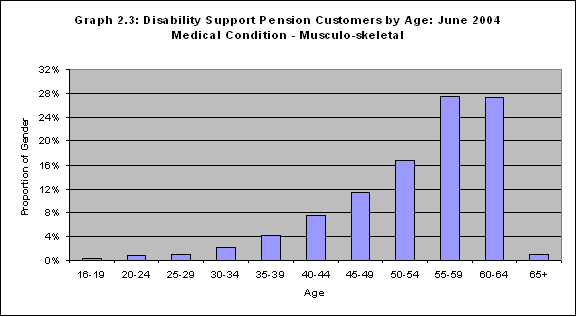
The age distribution for customers with Musculo-skeletal/Connective tissue conditions is skewed strongly towards the older age groups. This indicates a strong correlation between this type of condition and age.
Source: Superstar Pensions Database 11/06/2004
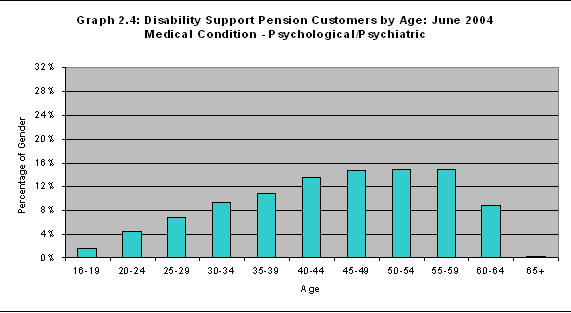
Psychological/Psychiatric conditions also show a high representation in the older age groups but substantial numbers are in the younger age groups, leading to a more even distribution.
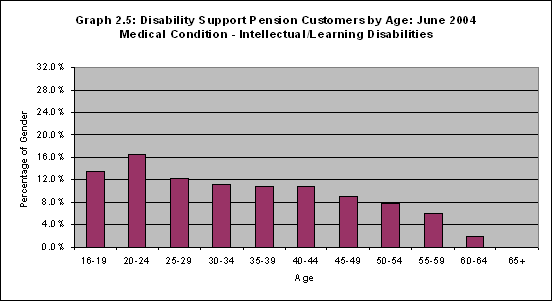
Customers with Intellectual or Learning disabilities vary again in that they are skewed towards the younger age groups. The majority of these customers are born with their condition and may have a reduced lifespan as a result of their condition. This is reflected in information on duration on DSP for customers with these disabilities,
where over half have been on payment for 10 years or more.
Source: Superstar Pensions Database 11/06/2004
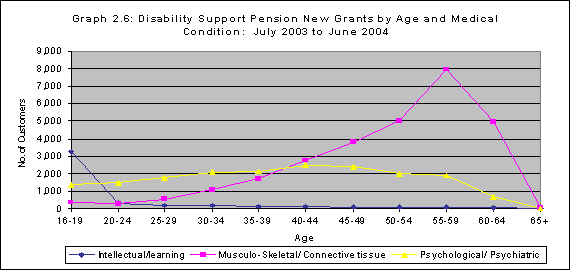
A comparison of the age distributions of the total DSP population to customers granted in the 2003-04 financial year shows that:
Source: Superstar Common Events Databases 11/07/2003 to 11/06/2004
-
- new customers with musculo-skeletal/connective tissue conditions have similar age distributions to the overall DSP population with the same condition;
- new customers with psychological/psychiatric conditions tend to be in the younger age groups (less than 45 years old) than the overall DSP population with the same condition; and
- new customers with Intellectual/Learning difficulties show a higher proportion of young customers (under 20 years) coming onto payment.
3. Earnings and Duration on Income Support
3.1 Customers with Earnings from Employment
Note: Information on earnings is not yet available.
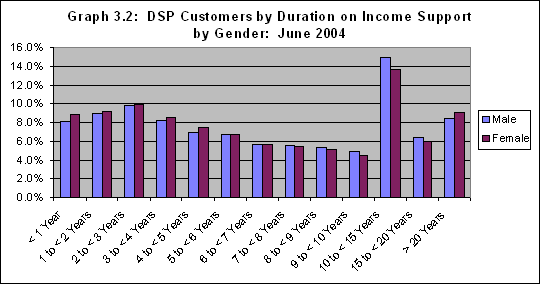
3.2 Customers by Duration on Income Support and Gender
Note: Duration on income support includes the period of time a customer has been on DSP together with the period of time the customer may have spent on any other payment/s prior to being granted DSP. This differs to the methodology used for reports pre 2004.
The distribution of DSP customers by duration on an income support payment show that the largest category is customers who have been on a payment for 2 to less than 3 years, representing 9.9% of all DSP recipients. There are also a significant proportion of customers who have been in receipt of a payment for 10 years or more (29.3%, however after 9 years each year represents less than 4% of the total DSP population).
The average duration on income support for male, female and all DSP customers is 7.9 years.
Source: Superstar Pensions Database 11/06/2004
| Duration | Male | % | Female | % | Total | % |
|---|---|---|---|---|---|---|
| < 1 Year | 33,926 | 8.1% | 24,565 | 8.8% | 58,491 | 8.4% |
| 1 to < 2 Years | 37,324 | 8.9% | 25,374 | 9.1% | 62,698 | 9.0% |
| 2 to < 3 Years | 41,034 | 9.8% | 27,617 | 9.9% | 68,651 | 9.9% |
| 3 to < 4 Years | 34,384 | 8.2% | 23,678 | 8.5% | 58,062 | 8.3% |
| 4 to < 5 Years | 29,155 | 7.0% | 20,619 | 7.4% | 49,774 | 7.1% |
| 5 to < 6 Years | 28,147 | 6.7% | 18,671 | 6.7% | 46,818 | 6.7% |
| 6 to < 7 Years | 23,770 | 5.7% | 15,735 | 5.7% | 39,505 | 5.7% |
| 7 to < 8 Years | 23,319 | 5.6% | 15,190 | 5.5% | 38,509 | 5.5% |
| 8 to < 9 Years | 22,456 | 5.4% | 14,208 | 5.1% | 36,664 | 5.3% |
| 9 to < 10 Years | 20,385 | 4.9% | 12,506 | 4.5% | 32,891 | 4.7% |
| 10 to < 15 Years | 62,683 | 15.0% | 37,996 | 13.7% | 100,679 | 14.4% |
| 15 to < 20 Years | 26,760 | 6.4% | 16,538 | 6.0% | 43,298 | 6.2% |
| > 20 Years | 35,486 | 8.5% | 25,216 | 9.1% | 60,702 | 8.7% |
| Total | 418,829 | 100.0% | 277,913 | 100.0% | 696,742 | 100.0% |
Source: Superstar Pensions Database 11/06/2004
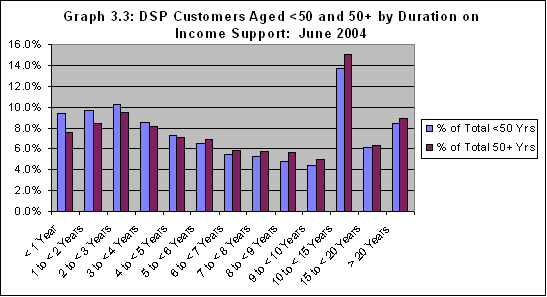
3.3 Customers by Duration on Income Support and Gender by those aged less than 50 and those aged 50 and over
Note: Duration on income support includes the period of time a customer has been on DSP together with the period of time the customer may have spent on any other payment/s prior to being granted DSP. This differs to the methodology used for reports pre 2004.
DSP customers aged 50 years or over make up over half of the total DSP population (54.7%). These customers also tend to have been on an income support payment for longer periods than customers aged less than 50 years (8.2 years compared to 7.5 years respectively).
Source: Superstar Pensions Database 11/06/2004
| Duration | < 50 Years of Age | 50+ Years of Age | ||||||
|---|---|---|---|---|---|---|---|---|
| Male | Female | Total | % of Total <50 Yrs | Male | Female | Total | % of Total 50+ Yrs | |
| < 1 Year | 17,385 | 12,262 | 29,647 | 9.4% | 16,541 | 12,303 | 28,844 | 7.6% |
| 1 to < 2 Years | 18,059 | 12,548 | 30,607 | 9.7% | 19,265 | 12,826 | 32,091 | 8.4% |
| 2 to < 3 Years | 19,206 | 13,097 | 32,303 | 10.2% | 21,828 | 14,520 | 36,348 | 9.5% |
| 3 to < 4 Years | 15,860 | 11,135 | 26,995 | 8.6% | 18,524 | 12,543 | 31,067 | 8.1% |
| 4 to < 5 Years | 13,414 | 9,458 | 22,872 | 7.3% | 15,741 | 11,161 | 26,902 | 7.1% |
| 5 to < 6 Years | 12,346 | 8,197 | 20,543 | 6.5% | 15,801 | 10,474 | 26,275 | 6.9% |
| 6 to < 7 Years | 10,337 | 7,005 | 17,342 | 5.5% | 13,433 | 8,730 | 22,163 | 5.8% |
| 7 to < 8 Years | 10,084 | 6,639 | 16,723 | 5.3% | 13,235 | 8,551 | 21,786 | 5.7% |
| 8 to < 9 Years | 9,171 | 5,999 | 15,170 | 4.8% | 13,285 | 8,209 | 21,494 | 5.6% |
| 9 to < 10 Years | 8,475 | 5,447 | 13,922 | 4.4% | 11,910 | 7,059 | 18,969 | 5.0% |
| 10 to < 15 Years | 26,331 | 16,953 | 43,284 | 13.7% | 36,352 | 21,043 | 57,395 | 15.0% |
| 15 to < 20 Years | 10,953 | 8,274 | 19,227 | 6.1% | 15,807 | 8,264 | 24,071 | 6.3% |
| > 20 Years | 14,731 | 11,988 | 26,719 | 8.5% | 20,755 | 13,228 | 33,983 | 8.9% |
| Total | 186,352 | 129,002 | 315,354 | 100.0% | 232,477 | 148,911 | 381,388 | 100.0% |
Source: Superstar Pensions Database 11/06/2004
4. New Claims
4.1 New Claims Granted by Age and Gender
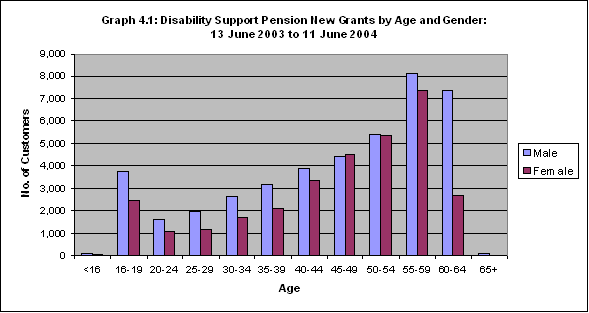
During the period 13 June 2003 to 11 June 2004, there were 116,985 new claims for DSP processed. Of these, 74,211 were granted (63.3%).
Males make up 57.3% of new grants for DSP while females comprise 42.7% (this compares to 59.2% for males and 40.8% for females in 2002-03). These proportions are similar to the percentage distribution of males and females in the overall DSP population (males currently make up 60.1% of the total DSP population and females 39.9%). The age distribution of new grants also shows a higher percentage of customers in the age groups 16-19, 40-49 and 55-59 than is found in the total DSP population.
Source: Superstar Common Events Databases 11/07/2003 to 11/06/2004
| Age | New Grants | Total DSP customers | ||||||
|---|---|---|---|---|---|---|---|---|
| Male | % | Female | % | Total | % | Total | % | |
| <16 | 61 | 0.1% | 30 | 0.1% | 91 | 0.1% | 0 | 0.0% |
| 16-19 | 3,729 | 8.8% | 2,449 | 7.7% | 6,178 | 8.3% | 16,831 | 2.4% |
| 20-24 | 1,616 | 3.8% | 1,045 | 3.3% | 2,661 | 3.6% | 27,930 | 4.0% |
| 25-29 | 1,984 | 4.7% | 1,127 | 3.6% | 3,111 | 4.2% | 30,738 | 4.4% |
| 30-34 | 2,617 | 6.2% | 1,685 | 5.3% | 4,302 | 5.8% | 40,803 | 5.9% |
| 35-39 | 3,173 | 7.5% | 2,087 | 6.6% | 5,260 | 7.1% | 50,090 | 7.2% |
| 40-44 | 3,909 | 9.2% | 3,347 | 10.6% | 7,256 | 9.8% | 67,044 | 9.6% |
| 45-49 | 4,426 | 10.4% | 4,534 | 14.3% | 8,960 | 12.1% | 81,918 | 11.8% |
| 50-54 | 5,386 | 12.7% | 5,335 | 16.8% | 10,721 | 14.4% | 100,582 | 14.4% |
| 55-59 | 8,149 | 19.2% | 7,374 | 23.3% | 15,523 | 20.9% | 139,151 | 20.0% |
| 60-64 | 7,408 | 17.4% | 2,654 | 8.4% | 10,062 | 13.6% | 135,617 | 19.5% |
| 65+ | 78 | 0.2% | 8 | 0.0% | 86 | 0.1% | 6,038 | 0.9% |
| Total | 42,536 | 100.0% | 31,675 | 100.0% | 74,211 | 100.0% | 696,742 | 100.0% |
Source: Superstar Common Events Databases 11/07/2003 to 11/06/2004
4.2 Comparison of New Grants and Current Customers by Medical Condition
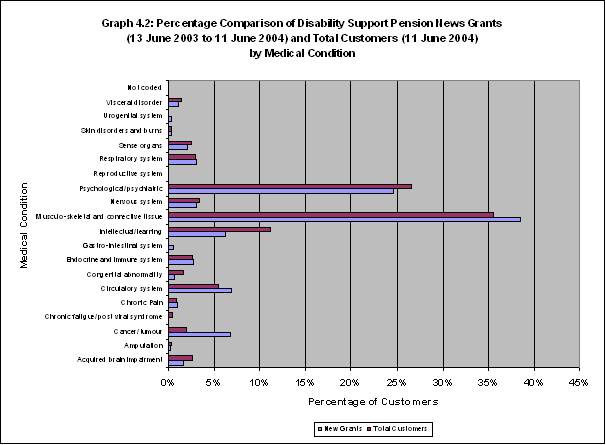
The distributions of new grants and current customers by medical condition are very similar. A few notable exceptions are the reduced percentage of new grants of customers with intellectual/learning disabilities (6.2% of new grants compared to 11.2% of total DSP population) and the increased number of new grants for customers with cancer/tumour (6.8% of new grants compared to 2.0% of total DSP population) and musculo-skeletal/connective tissue conditions (38.5% of new grants compared to 35.5% of total DSP population).
When Invalid Pension ceased in November 1991, current customers were transferred to DSP. These customers did not have a medical condition recorded on their Centrelink record. They are being progressively reviewed and ascribed a medical condition, but as at June 2004, ex-Invalid Pension customers without a medical condition recorded on their Centrelink record made up 4.2% of the total DSP population.
By including these customers when looking at medical conditions, it has the effect of reducing the percentages in the other categories. Therefore, ex-Invalid Pensioners have been excluded from this graph to provide a clearer picture of the relationship between current customers and new grants.
Source: Superstar Common Events Databases 11/07/2003 to 11/06/2004
Superstar Pensions Database 11/06/2004
| Medical Condition | Male | % | Female | % | New Grants | % | Total Customers | % |
|---|---|---|---|---|---|---|---|---|
| Acquired brain impairment | 871 | 2.0% | 350 | 1.1% | 1,221 | 1.6% | 17,337 | 2.6% |
| Amputation | 107 | 0.3% | 44 | 0.1% | 151 | 0.2% | 1,720 | 0.3% |
| Cancer/tumour | 2,922 | 6.9% | 2,126 | 6.7% | 5,048 | 6.8% | 13,358 | 2.0% |
| Chronic fatigue/post viral syndrome | 3 | 0.0% | 3 | 0.0% | 6 | 0.0% | 3,435 | 0.5% |
| Chronic Pain | 353 | 0.8% | 419 | 1.3% | 772 | 1.0% | 5,733 | 0.9% |
| Circulatory system | 3,637 | 8.6% | 1,461 | 4.6% | 5,098 | 6.9% | 36,507 | 5.5% |
| Congenital abnormality | 270 | 0.6% | 249 | 0.8% | 519 | 0.7% | 11,408 | 1.7% |
| Endocrine and immune system | 1,106 | 2.6% | 925 | 2.9% | 2,031 | 2.7% | 17,531 | 2.6% |
| Gastro-intestinal system | 201 | 0.5% | 226 | 0.7% | 427 | 0.6% | 485 | 0.1% |
| Intellectual/learning | 2,864 | 6.7% | 1,734 | 5.5% | 4,598 | 6.2% | 74,453 | 11.2% |
| Musculo-skeletal and connective tissue | 15,699 | 36.9% | 12,866 | 40.6% | 28,565 | 38.5% | 237,103 | 35.5% |
| Nervous system | 1,171 | 2.8% | 1,140 | 3.6% | 2,311 | 3.1% | 22,650 | 3.4% |
| Psychological/psychiatric | 10,387 | 24.4% | 7,920 | 25.0% | 18,307 | 24.7% | 177,048 | 26.5% |
| Reproductive system | 6 | 0.0% | 30 | 0.1% | 36 | 0.0% | 37 | 0.0% |
| Respiratory system | 1,358 | 3.2% | 964 | 3.0% | 2,322 | 3.1% | 19,841 | 3.0% |
| Sense organs | 852 | 2.0% | 681 | 2.1% | 1,533 | 2.1% | 16,547 | 2.5% |
| Skin disorders and burns | 117 | 0.3% | 112 | 0.4% | 229 | 0.3% | 1,839 | 0.3% |
| Urogenital system | 108 | 0.3% | 79 | 0.2% | 187 | 0.3% | 211 | 0.0% |
| Visceral disorder | 480 | 1.1% | 322 | 1.0% | 802 | 1.1% | 9,562 | 1.4% |
| Not coded | 24 | 0.1% | 24 | 0.1% | 48 | 0.1% | 344 | 0.1% |
| Total | 42,536 | 100.0% | 31,675 | 100.0% | 74,211 | 100.0% | 667,149 | 100.0% |
Source: Superstar Common Events Databases 11/07/2003 to 11/06/2004
Superstar Pensions Database 11/06/2004
* Excludes customers granted prior to 12/11/1991 (29,593 customers).
4.3 New Claims Rejected by Reason and Gender
During the period 13 June 2003 to 11 June 2004, there were 116,985 new claims for DSP processed. Of these, 42,774 were rejected (36.6%). The main reasons for rejecting the claim were because the customer had less than 20 points impairment as assessed under the Impairment Tables (37.9%), or had a short-term disability (17.9%).
Of the medical rejection reasons, females were more likely than males to be rejected because their disability was short‑term or their impairment level was less than 20 points. Males were more likely than females to be rejected because their impairment level was greater than 20% but they could return to full time work or be re-skilled.
| Males | % | Females | % | Total | % | |
|---|---|---|---|---|---|---|
| Medical Rejection Reasons | ||||||
| Less than 20% impaired | 9,191 | 37.5% | 7,018 | 38.5% | 16,209 | 37.9% |
| Disability is short term | 4,228 | 17.2% | 3,445 | 18.9% | 7,673 | 17.9% |
| Greater than 20% impaired/can work full time | 731 | 3.0% | 423 | 2.3% | 1,154 | 2.7% |
| Greater than 20% impaired/can be reskilled | 343 | 1.4% | 164 | 0.9% | 507 | 1.2% |
| Not permanently blind | 26 | 0.1% | 39 | 0.2% | 65 | 0.2% |
| Non-medical Rejection Reasons | ||||||
| Failed to supply requested information | 2,809 | 13.4% | 1,982 | 10.9% | 4,791 | 11.2% |
| Manifest | 1,940 | 7.9% | 1,508 | 8.3% | 3,448 | 8.1% |
| Fail to attend assessment/medical exam | 872 | 3.6% | 644 | 3.5% | 1,516 | 3.5% |
| Fail to reply to correspondence | 828 | 2.2% | 346 | 1.9% | 874 | 2.0% |
| Other | 854 | 3.5% | 565 | 3.1% | 1,419 | 3.3% |
| Customer request | 426 | 1.7% | 368 | 2.0% | 794 | 1.9% |
| Excess income | 339 | 1.4% | 396 | 2.2% | 735 | 1.7% |
| Precluded due to periodic compensation | 471 | 1.9% | 180 | 1.0% | 651 | 1.5% |
| Compensation preclusion period | 464 | 1.9% | 181 | 1.0% | 645 | 1.5% |
| Assets over limit | 291 | 1.2% | 182 | 1.0% | 473 | 1.1% |
| Not residentially qualified | 250 | 1.0% | 215 | 1.2% | 465 | 1.1% |
| Fail to attend interview | 220 | 0.9% | 128 | 0.7% | 348 | 0.8% |
| Not Coded | 188 | 0.8% | 164 | 0.9% | 352 | 0.8% |
| Failed agreement specific rules | 99 | 0.4% | 102 | 0.6% | 201 | 0.5% |
| Proof of identity not provided | 104 | 0.4% | 76 | 0.4% | 180 | 0.4% |
| Withdrawn/voluntary surrender | 100 | 0.4% | 69 | 0.4% | 169 | 0.4% |
| DSP excess income/assets - no medical exam | 61 | 0.2% | 44 | 0.2% | 105 | 0.2% |
| Total | 24,535 | 100.0% | 18,239 | 100.0% | 42,774 | 100.0% |
Source: Superstar Common Events Databases 11/07/03 to 11/06/04
5. Where DSP Customers are Coming From and Going To
5.1 Where DSP Customers Are Coming From
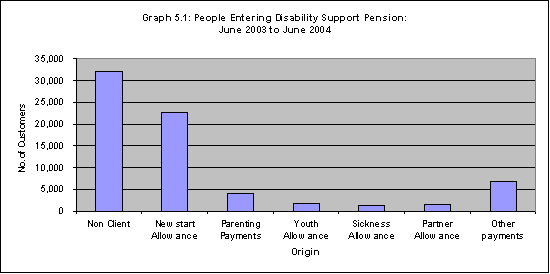
There were 70,506 people receiving DSP in June 2004 who were not receiving DSP in June 2003. These "new customers” represent 10.1% of the total DSP population as at June 2004.
The largest group of people entering DSP are those who were not previously receiving an income support payment. These comprise 45.4% of new customers on payment. The next largest source of DSP customers is transfers from Newstart Allowance with 32.3% of new customers, down from 32.9% in 2002/03 and 35.0% in 2001/02, followed by Parenting Payment (both Single and Partnered) with 5.7% of new DSP customers. A large group of customers (16.6%) have their origins from a range of other payments such as Youth Allowance, Carer Payment and Special Benefit although the numbers from each payment are small. These proportions have remained fairly static for at least the last few financial years.
It should be noted that figures for customer transfers do not exactly match those for new grants due to the different business rules used in extracting these data sets, for example, some new grants can be for the same customer or a customer may be granted DSP and then leave DSP within the same year.
Source: FaCS Data Map, Payment to Payment Reports
| Origin | Count | % |
|---|---|---|
| Non Income Support | 32,024 | 45.4% |
| Newstart Allowance | 22,739 | 32.3% |
| Parenting Payments | 4,045 | 5.7% |
| Youth Allowance | 1,806 | 2.6% |
| Sickness Allowance | 1,273 | 1.8% |
| Partner Allowance | 1,686 | 2.4% |
| Other payments | 6,933 | 9.8% |
| Total | 70,506 | 100.0% |
Source: FaCS Data Map, Payment to Payment Reports, 2004
5.2 Where DSP Customers Are Going To
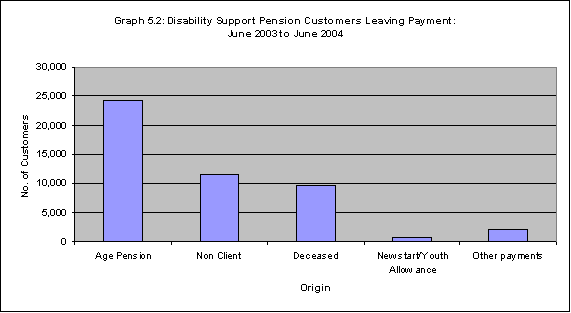
The majority of customers who were on DSP in June 2003 but were not on DSP in June 2004 moved on to Age Pension (50.1%). As customers reach Age Pension eligibility age the vast majority transfer across although a very small percentage of customers choose to remain on DSP.
Of the people who left DSP, 24.0% left payments entirely. A substantial proportion (19.9%) of exits from DSP was because of the death of the customer.
Source: FaCS Data Map, Payment to Payment Reports
| Destination | Count | % |
|---|---|---|
| Age Pension | 24,246 | 50.2% |
| Non Client | 11,635 | 24.1% |
| Deceased | 9,625 | 19.9% |
| Newstart/Youth Allowance | 783 | 1.6% |
| Other payments | 2,045 | 4.2% |
| Total | 48,334 | 100.0% |
Source: FaCS Data Map, Payment to Payment Reports, 2004
Last updated:
