Australian Government Disability Services Census Report 2008
The Disability Services Census Report 2008 provides detailed information on Australian Government funded specialist disability services and their consumers.
Table of contents
- List of Tables
- List of Figures
- Acknowledgements
- Chapter One: Executive Summary
- 1.1 Background
- 1.2 Outline of the Report
- 1.3 Main counts and definitions
- 1.4 Summary of main findings
- 1.5 Data summary of all disability service outlets, 2007-08
- 1.5a Data summary of disability employment services, 2007-08
- 1.5b Data summary of open employment services, 2007-08
- 1.5c Data summary of supported employment services, 2007-08
- 1.5d Data summary of advocacy services, 2007-08
- 1.5e Data summary of respite services, 2007-08
- 1.5f Data summary of print disability services, 2007-08
- 1.5g Data summary of information services, 2007-08
- Chapter Two: History of the Disability Services Census
- Chapter Three: Disability service outlet profile
- Chapter Four: National disability employment services consumer profile
- Chapter Five: Trend series—Disability employment service consumers
- Chapter Six: State and territory summary statistics
- Chapter Seven: Appendices
- Chapter Eight: Glossary of Terms
- References
List of Tables
- Table 3.1: State distribution of disability service outlets across Australia, 2007-08
- Table 3.2: Number of disability service outlet types in each state, 2007-08
- Table 3.3: Percentage of disability service outlet types in each state, 2007-08
- Table 3.4: Number of disability service outlet types, by geographic location, 2007-08
- Table 3.5: Disability service outlet type, by number of hours operating per day, 2007-08
- Table 3.6: Disability service outlets, by number of operating days per week, 2007-08
- Table 3.7: Disability service outlet type, by number of operating days per week, 2007-08
- Table 3.8: Disability service outlet type, by operating weeks in 2007-08
- Table 3.9: Disability service outlet type, by FTE direct and indirect support paid staff, 2007-08
- Table 3.10: Disability service outlet type, by FTE volunteers in a typical week, 2007-08
- Table 4.1: All disability employment service consumers, by main reason for leaving the disability employment service, 2007-08
- Table 4.2: All disability employment service consumers, by most common overseas country of birth, 2007-08
- Table 4.3: All disability employment service consumers, by accommodation setting, 2007-08
- Table 4.4: All disability employment service consumers, by level of support needed in each main life area, 2007-08
- Table 4.5: All disability employment service consumers, by level of support needed in each main life area, 2006-07 & 2007-08 comparison
- Table 4.6: All disability employment service consumers, by primary disability type and employment outcome, 2007-08
- Table 4.7: All open employment service consumers, by main reason for leaving the open employment service, 2007-08
- Table 4.8: All open employment service consumers, by most common overseas country of birth, 2007-08
- Table 4.9: All open employment service consumers, by geographic location of usual residence, 2007-08
- Table 4.10: All open employment service consumers, by accommodation setting, 2007-08
- Table 4.11: All open employment service consumers, by level of support needed in each main life area, 2007-08
- Table 4.12: All open employment service consumers, by primary disability type and employment outcome, 2007-08
- Table 4.13: All supported employment service consumers, by main reason for leaving the supported employment service, 2007-08
- Table 4.14: All supported employment service consumers, by location of birth category, 2007-08
- Table 4.15: All supported employment service consumers, by most common overseas country of birth, 2007-08
- Table 4.16: All supported employment service consumers, by geographic location of usual residence, 2007-08
- Table 4.17: All supported employment service consumers, by living arrangements, 2007-08
- Table 4.18: All supported employment service consumers, by accommodation setting, 2007-08
- Table 4.19: All supported employment service consumers, by level of support needed in each main life area, 2007-08
- Table 4.20: Supported employment service consumers ‘on the books’, by employment phase, 30 June 2008
- Table 4.21: Supported employment service consumers ‘on the books’, by basis of employment, 30 June 2008
- Table 4.22: Supported employment service consumers ‘on the books’, by full-time/part-time status and average hours worked per week and primary disability type, 30 June 2008
- Table 4.23: Supported employment service consumers ‘on the books’, by full-time/part-time status and average hours worked per week and state, 30 June 2008
- Table 4.24: Supported employment service consumers ‘on the books’, by gross weekly wage and primary disability type, 30 June 2008
- Table 4.25: Supported employment service consumers ‘on the books’, by gross hourly wage rate and primary disability type, 30 June 2008
- Table 4.26: Supported employment service consumers ‘on the books’, by method used to set pay, 30 June 2008
- Table 5.1: Change in disability employment services consumer population, by employment service type, 2000-01 to 2007-08
- Table 5.2: Change in the female disability employment services consumer population, by employment service type, 2000-01 to 2007-08
- Table 5.3: Change in the Indigenous disability employment services consumer population, by employment service type, 2000-01 to 2007-08
- Table 5.4: Change in the non-English speaking background disability employment services consumer population, by employment service type, 2000-01 to 2007-08
- Table 5.5: Change in the disability employment services consumer population, by primary disability type, 2000-01 to 2007-08
- Table 5.6: Change in the open employment services consumer population, by primary disability type, 2000-01 to 2007-08
- Table 5.7: Change in the supported employment services population, by primary disability type, 2000-01 to 2007-08
- Table 1A: Total staff hours in the reference week, by disability service outlet type and state, 2007-08
- Table 2A: All consumers: employment service type by age range, 2007-08
- Table 3A: All consumers: employment service type, by gender and state, 2007-08
- Table 4A: All consumers: Indigenous status, by state and employment service type, 2007-08
- Table 5A: All consumers: country of birth, by state and employment service type, 2007-08
- Table 6A: All supported employment consumers: main language spoken at home, by state, 2007-08
- Table 7A: All consumers: need for interpreter assistance, by state and employment service type, 2007-08
- Table 8A: All consumers: other significant disability, by primary disability and employment service type, 2007-08
- Table 9A: All consumers: need for assistance, by primary disability and main life area, 2007-08
- Table 10A: All consumers: need for assistance by employment service type and main life area, 2007-08
- Table 11A: All supported employment consumers: basis of employment by state, 30 June 2008
- Table 12A: Employed consumers: weekly wage, by employment service type and census year (2008, 2007, 2006, 2005, 2004, 2003)
List of Figures
- Figure 3.1: Disability service outlets, by service type, 2007-08
- Figure 3.2: State distribution of disability service outlet types across Australia, 2007-08
- Figure 3.3: Disability service outlets, by geographic location, 2007-08
- Figure 3.4: Percentage of disability service type outlet, by geographic location, 2007-08
- Figure 3.5: Disability service outlets, by number of hours operating per day, 2007-08
- Figure 3.6: Disability service outlet type, by operating days per week, 2007-08
- Figure 3.7: Disability service outlet type, by operating weeks in 2007-08
- Figure 3.8: Disability service outlet type, by FTE paid staff, 2007-08
- Figure 3.9: All consumers assisted, by disability service outlet type, 2007-08
- Figure 4.1: All disability employment service consumers, by age group, 2007-08
- Figure 4.2: All disability employment service consumers, by country of birth category, 2007-08
- Figure 4.3: All disability employment service consumers, by state or territory of usual residence, 2007-08
- Figure 4.4: All disability employment service consumers, by geographic location of usual residence, 2007-08
- Figure 4.5: All disability employment service consumers, by living arrangements, 2007-08
- Figure 4.6: All disability employment service consumers that are in supported accommodation, by supported accommodation setting, 2007-08
- Figure 4.7: All disability employment service consumers, by primary disability type, 2007-08
- Figure 4.8: All disability employment service consumers with another significant disability, by other significant disability type, 2007-08
- Figure 4.9: All disability employment service consumers, by severity of disability, 2007-08
- Figure 4.10: All disability employment service consumers with a profound or severe core activity limitation, by primary disability type, 2007-08
- Figure 4.11: All disability employment service consumers who always or sometimes needed support, by main life area, 2007-08
- Figure 4.12: All disability employment service consumers, by relationship of informal carer to consumer, 2007-08
- Figure 4.13: All disability employment service consumers, by main source of income, 2007-08
- Figure 4.14: All disability employment service consumers, by equity group and employment outcome, 2007-08
- Figure 4.15: All disability employment service consumers with an employment outcome, by age, 2007-08
- Figure 4.16: All open employment service consumers, by age group, 2007-08
- Figure 4.17: All open employment service consumers, by country of birth category, 2007-08
- Figure 4.18: All open employment service consumers, by state or territory of usual residence, 2007-08
- Figure 4.19: All open employment service consumers, by primary disability type, 2007-08
- Figure 4.20: All open employment service consumers with an other significant disability, by other significant disability type, 2007-08
- Figure 4.21: All open employment service consumers, by severity of disability, 2007-08
- Figure 4.22: All open employment service consumers with a profound or severe core activity limitation, by primary disability type, 2007-08
- Figure 4.23: All open employment service consumers who always or sometimes needed support, by main life area, 2007-08
- Figure 4.24: All open employment service consumers, by relationship of informal carer to consumer, 2007-08
- Figure 4.25: All open employment service consumers, by main source of income, 2007-08
- Figure 4.26: All open employment service consumers, by equity group and employment outcome, 2007-08
- Figure 4.27: All open employment service consumers, by age and employment outcome, 2007-08
- Figure 4.28: All supported employment service consumers, by age group, 2007-08
- Figure 4.29: All supported employment service consumers, by state or territory of usual residence, 2007-08
- Figure 4.30: All supported employment service consumers that are in supported accommodation, by supported accommodation setting, 2007-08
- Figure 4.31: All supported employment service consumers, by primary disability type, 2007-08
- Figure 4.32: All supported employment service consumers with another significant disability, by other significant disability type, 2007-08
- Figure 4.33: All supported employment service consumers, by severity of disability, 2007-08
- Figure 4.34: All supported employment service consumers with a profound or severe core activity limitation, by primary disability type, 2007-08
- Figure 4.35: All supported employment service consumers who always or sometimes needed support, by main life area, 2007-08
- Figure 4.36: All supported employment service consumers, by mode of transport used to get to their place of work, 2007-08
- Figure 4.37: All supported employment service consumers, by geographic location of usual residence and mode of transport used to get to their place of work, 2007-08
- Figure 4.38: All supported employment service consumers, by relationship of informal carer to consumer, 2007-08
- Figure 4.39: All supported employment service consumers, by age and employment outcome, 2007-08
- Figure 4.40: All supported employment service consumers, by primary disability type and employment outcome, 2007-08
- Figure 4.41: Supported employment service consumers ‘on the books’, by standard hours worked per week, 30 June 2008
- Figure 4.42: Supported employment service consumers ‘on the books’, by gross weekly wage category, 30 June 2008
- Figure 4.43: Supported employment service consumers ‘on the books’, by measure used to determine wage, 30 June 2008
- Figure 5.1: Consumers accessing disability employment services, 2000-01 to 2007-08
- Figure 5.2: Consumers accessing disability employment services, by employment service type, 2000-01 to 2007-08
- Figure 5.3: Female consumers accessing disability employment services, 2000-01 to 2007-08
- Figure 5.4: Female consumers accessing open employment services, 2000-01 to 2007-08
- Figure 5.5: Female consumers accessing supported employment services, 2000-01 to 2007-08
- Figure 5.6: Indigenous consumers accessing disability employment services, 2000-01 to 2007-08
- Figure 5.7: Indigenous consumers accessing open employment services, 2000-01 to 2007-08
- Figure 5.8: Indigenous consumers accessing supported employment services, 2000-01 to 2007-08
- Figure 5.9: Consumers from non-English speaking backgrounds accessing disability employment services, 2000-01 to 2007-08
- Figure 5.10: Consumers from non-English speaking backgrounds accessing open employment services, 2000-01 to 2007-08
- Figure 5.11: Consumers from non-English speaking backgrounds accessing supported employment services, 2000-01 to 2007-08
Acknowledgements
The Disability and Carers Payments Branch in the Department of Families, Housing, Community Services and Indigenous Affairs (FaHCSIA) had overall responsibility for the 2008 Disability Services Census. The collection of the disability services census data was shared between FaHCSIA and the Department of Education, Employment and Workplace Relations (DEEWR) in line with their management and funding responsibilities. FaHCSIA collected information on all disability service types except for open employment services and DEEWR collected open employment service outlet and consumer data.
FaHCSIA acknowledges that this report would not have been possible without the valued cooperation and effort of disability service providers.
Chapter One: Executive Summary
- 1.1 Background
- 1.2 Outline of the Report
- 1.3 Main counts and definitions
- 1.4 Summary of main findings
- 1.5 Data summary of all disability service outlets, 2007-08
- 1.5a Data summary of disability employment services, 2007-08
- 1.5b Data summary of open employment services, 2007-08
- 1.5c Data summary of supported employment services, 2007-08
- 1.5d Data summary of advocacy services, 2007-08
- 1.5e Data summary of respite services, 2007-08
- 1.5f Data summary of print disability services, 2007-08
- 1.5g Data summary of information services, 2007-08
1.1 Background
The 2008 Disability Services Census, which covers all CSTDA services funded by the Australian Government in 2007-08, was collected under the third and final Commonwealth State Territory Disability Agreement (CSTDA) to inform national reporting processes. Under the CSTDA the Australian Government was responsible for the planning, policy setting and management of specialist disability employment assistance. The Australian Government shared similar responsibilities with State and Territory Governments for advocacy, respite, print disability and information services. The Disability Services Act 1986 (Cth) provides the legislative framework for the funding and delivery of Australian Government funded disability services.
The new National Disability Agreement (NDA), effective from 1 January 2009, now provides the national framework and key areas of reform for the provision of government support and services for people with disability. The NDA between the Australian Government and State and Territory Governments will improve and increase services for people with disability, their families and carers.
The NDA is part of a broader National Disability Reform Agenda and will in future come under the National Disability Strategy, which is currently being developed. The reforms are directed at creating a disability services system that is effective, efficient and equitable and that has a focus on early intervention; timely, person-centred approaches; and lifelong planning.
The Parties have agreed to concentrate initial national efforts in several identified priority areas to underpin the policy directions and achieve reforms in the disability service system. They are:
- Better Measurement of Need – Under this priority: a national model to estimate demand will be developed by mid 2010; there will be improvements in the data collected through the Survey of Disability, Ageing and Carers (SDAC), providing a stronger basis for demand estimates; and improvements in the quality of data reported under the National Minimum Data Set and jurisdiction-level unmet demand data.
- Population Benchmarking for Disability Services – A National Population Benchmarking Framework will be developed and initial population benchmarking of disability services, based on information available, will be achieved by mid 2010 to improve the evidence base to assist in policy, service and planning decisions.
- Making Older Carers a Priority – The National Disability Priorities Framework will assist Governments to target services to more vulnerable population groups based on relative need (including older carers and Indigenous people with disability).
- Quality Improvement Systems based on Disability Standards – A National Disability Quality Framework with a National Quality Assurance system for disability services will be developed to introduce a national approach to quality assurance and the continuous improvement of disability services by mid 2010.
- Service Planning and Strategies to Simplify Access – The National Framework for Service Planning and Access will be developed, focusing on providing a person centered approach to service delivery and to simplify access to specialist disability services.
- Early Intervention and Prevention, Lifelong Planning and Increasing Independence and Social Participation Strategies – An Early Intervention and Prevention Framework will be developed to increase Governments’ effectiveness in early intervention and prevention strategies and to ensure that clients receive the most appropriate and timely support by mid 2011.
- Increased Workforce Capacity – A national workforce strategy will be developed to address qualifications, training and cross sector career mapping issues and establishing the disability sector as an ‘industry of choice’ by the end of 2010.
- Increased Access for Indigenous Australians – A National Indigenous Access Framework will ensure that the needs of Indigenous Australians with disability are addressed through appropriate service delivery arrangements.
- Access to Aids and Equipment – More consistent access to aids and equipment by the end of 2012.
- Improved Access to Disability Care – Systems that improve access to disability care and ensure people are referred to the most appropriate disability services and supports, including consideration of single access points and nationally consistent assessment processes in line with nationally agreed principles by end 2011.
Under the NDA all Governments have agreed to the provision of data, including a commitment to providing data for the National Minimum Data Set and a commitment to the improvement of data. This includes the continuation of the annual Disability Services Census. The Australian Government is responsible for disability employment services, delivered by both open and supported employment services, and assists State and Territory Governments with funding for the provision of specialist disability services.
[ Return to Top Return to Section ]
1.2 Outline of the Report
This report comprises eight chapters. Chapter One includes the executive summary, which outlines the purpose of the report and summarises the main findings from the 2008 Disability Services Census collection. Summary statistics are also provided at the end of the chapter. Chapter Two provides a history of the Disability Services Census. Chapter Three provides a profile of the operations of Australian Government funded CSTDA services. Chapter Four provides a profile of the characteristics of consumers accessing disability employment services. Separate commentary is also provided on the characteristics of consumers accessing open and supported employment services. Chapter Five provides trends series data and commentary on changes in the profile of disability employment service consumers over time. Chapter Six presents state and territory summary statistics on disability service outlets and disability employment service consumers. Chapter Seven contains the Appendices, which provide more detailed data tables. Chapter eight contains the glossary of terms.
[ Return to Top Return to Section ]
1.3 Main counts and definitions
The main counts in the 2008 Disability Services Census collection are disability service outlet, disability service type and consumer:
- A disability service outlet is an administrative business or unit of an organisation that is funded to provide a CSTDA service type at a particular site. The organisation may be a single disability service outlet or an aggregation of two or more disability service outlets of the same or different disability service type. The 2008 Disability Services Census collected data on each disability service outlet that operated during 2007-08.
- Disability service type is the type of service the disability service outlet has been funded to provide under the CSTDA. Under the CSTDA, the Australian Government funds disability service outlets to provide open employment, supported employment, advocacy, respite, print disability and information services.
- A consumer is a person who accesses an Australian Government funded CSTDA service outlet. The 2008 Disability Services Census collected data on the number of consumers assisted in all disability service types in 2007-08.
Separate data was collected for each consumer assisted by open and supported employment service outlets in 2007-08. This group is referred to as ‘All consumers’. Data was also collected for each consumer who was registered as receiving assistance from open and supported service outlets on Census Day, 30 June 2008. This group is referred to as ‘Consumers on the books’.
Where consumers of open and supported employment service outlets had more than one service episode or spell in 2007-08, the following scenarios and corresponding counts were applied:
- Where a consumer exited a service outlet and re-entered the same service outlet within the same financial year, the consumer was counted once. The records of these consumers were treated as duplicate records.
- Where a consumer exited a service outlet and entered another service outlet of the same service type, the consumer was counted each time a move occurred.
- Where a consumer exited a service outlet and entered another service outlet of a different service type, the consumer was counted each time a move occurred.
[ Return to Top Return to Section ]
1.4 Summary of main findings
1.4.1 Disability service outlet profile
In 2007-08, a total of 1201 disability service outlets received funding from the Australia Government under the CSTDA, a reduction of nine (0.8%) disability service outlets since 2006-07.
The vast majority (1,075 or 89.5%) of disability service outlets provided specialist disability employment assistance, with 662 (55.1%) providing open employment assistance and 413 (34.4%) supported employment assistance (including targeted employment). A further 68 (5.7%) disability service outlets provided advocacy services, 46 (3.8%) respite services, 10 (0.8%) print disability services and two (0.2%) information services.
Importantly, based on the major city/non-major city breakdown of the general Australian population, there was a good balance of disability service outlets located in regional and remote areas (43.1%). Disability service outlets providing open employment and supported employment operated in metropolitan, regional and remote locations.
Most disability service outlets operated 7-8 hours a day (76.3%), five days a week (80.2%), for 48 or more weeks in the year (92.4%), with 50.0% (601) operating the full 52 weeks in 2007-08.
A total of 287,864 paid staff hours in the reference week were spent on disability service outlet operations in 2007-08. Based on a 38-hour working week, a total of 7,575 FTE paid staff worked in disability service outlets across Australia in 2007-08. This equates to an average of 6.3 FTE paid staff in each disability service outlet. There were 1,443 (16.0%) less FTE paid staff working in disability service outlets in 2007-08 than were in 2006-07, down from 9,018. Almost half FTE paid staff worked in the open employment sector, some 3,436 (49.0%).
Disability service outlets also reported 8,225 hours of volunteer support in a typical week in 2007-08, or an equivalent of another 216 FTE staff. This represents 2.9% of paid staff hours. Print disability services were most likely to use the support of volunteers to supplement day-to-day service outlet operations, with volunteer support hours representing 34.5% of paid staff hours.
1.4.2 Number of consumers assisted
In 2007-08, a total of 165,340 consumers were assisted through Australian Government funded CSTDA services. Just over half (95,592 or 57.8%) of all consumers accessed specialist disability employment assistance, of whom 73,425 (44.4%) used open employment services and 22,167 (13.4%) used supported employment services. A further 34,100 (20.6%) consumers used information services, 29,836 (18.0%) used print disability services, 5,812 (3.5%) used respite services, while no data was collected on advocacy services.
1.4.3 Characteristics of disability employment service consumers
Among the 95,592 disability employment service consumers in 2007-08, the majority were male (61.8%). Their median age was 37 years. Disability employment services assisted a total of 3,418 (3.6%) Indigenous consumers, 10,060 (10.5%) consumers born in non-English speaking countries and 32,041 (33.5%) consumers living in regional and remote areas.
Consumers were most likely to have an intellectual disability (28.4%), followed by a psychiatric disability (27.0%) and physical disability (21.7%). Some 27.7% of consumers had a profound or severe core activity limitation. The main life areas in which consumers always or sometimes needed support were learning and applying knowledge (62.7%), interpersonal interactions and relationships (60.6%) and working (56.6%). Around one-sixth (16.6%) of consumers had an informal carer.
A government pension or allowance was the main source of income for over three-quarters (79.6%) of consumers, with the majority (52.0%) receiving a disability support pension. Paid employment was the main source of income for 3.3% of consumers.
There were significant differences in the characteristics of open and supported employment service consumers in 2007-08. For instance:
- Open employment service consumers were younger on average, with 47.1% under the age of 35 years, compared with 38.4% of supported employment service consumers.
- The representation of Indigenous consumers was higher in open than in supported employment services (4.0% compared with 2.3%).
- The representation of consumers from non-English speaking backgrounds was higher in open than in supported employment services (12.7% compared with 3.5%).
- A slightly higher percentage of open than supported employment service consumers were living in regional and remote areas (35.8% compared with 32.9%).
- Consumers with a psychiatric disability were the largest group using open employment services (31.7%), whereas consumers with an intellectual disability were the largest group using supported employment services (69.7%).
- A considerably higher percentage of open than supported employment service consumers had multiple or other significant disabilities (46.1% compared with 31.4%).
- The percentage of consumers with a profound or severe core activity limitation was much higher among supported than open employment service consumers (71.8% compared with 14.5%).
- Open employment service consumers were most likely to need support with community (civic) and economic life (61.8%), whereas supported employment service consumers were most likely to need support with working (92.6%).
- Supported employment service consumers were much more likely to have in place formal and informal care arrangements than open employment service consumers.
- Some 8.5% of supported employment service consumers were living in settings where supported accommodation or formal care is provided, compared with 0.8% of open employment service consumers.
- Supported employment service consumers were five times as likely as open employment service consumers to have an informal carer (45.0% compared with 8.0%).
- Supported employment service consumers were much more likely than open employment service consumers to receive a government pension or allowance as their main source of income (98.7% compared with 73.8%).
1.4.4 Employment outcomes
The provision of specialist disability employment assistance continues to provide invaluable assistance to people with disability who need assistance to enter and remain in the workforce. Throughout 2007-08, disability employment services delivered strong employment outcomes overall for consumers.
‘Employment outcomes’ refers to those consumers in disability employment services who were employed for some or all of the time during 2007-08. It differs from, and should not be confused with, the employment outcome measure applying to the case-based funding model for disability employment services, which uses an hours and duration in employment measure.
In 2007-08, employment outcomes data illustrated that 20,995 (94.7%) supported employment consumers and 36,857 (50.2%) open employment consumers obtained an employment outcome.
The highest employment outcome for supported and open employment were attained by those who had a deafblind disability (98.0%) and intellectual (72.8%) respectively.
Supported employment consumers with the following disabilities achieved a marginally higher employment outcome than the national average (94.7%): specific learning/Attention Deficit Disorder (ADD) (97.0%), vision (96.4%), hearing (96.3%), autism (96.2%), and intellectual disability (95.1%). The employment outcome attained by consumers with a neurological disability was in line with the national average. Open employment consumers with the following disabilities achieved employment outcomes above the national average: intellectual disability (72.8%), deafblind (65.6%), hearing (63.8%), speech (62.7%), specific learning/ADD (59.7%), autism (59.0%), acquired brain injury (58.6%), vision (56.0%), and neurological disability (50.9%). Many consumers from equity groups also faced challenges in obtaining employment. For instance:
- The employment outcomes for female consumers:
- supported employment (94.6%), was equal to that of male counterparts. Even though female consumers attained an equal employment outcome to males as a group they remain significantly under-represented in supported employment services, accounting for only 35.8% of all consumers, while,
- females in open employment services had a slightly lower outcome to that of their male counterparts, 47.3% and 52.1% respectively.
- Indigenous consumers represented 2.3% of supported employment and 4.0% of open employment consumers. Supported employment Indigenous consumers attained an employment outcome of 91.0%, which is 3.7 percentage points lower than the national average. Open employment Indigenous consumers attained an employment outcome of 38.5%, some 11.7 percentage points below the national average for open employment consumers.
- Consumers born in a non-English speaking country represented 3.5% of supported employment consumers and 12.7% of open employment consumers. Supported employment non-English speaking consumers attained an employment outcome of 95.1%, which is 2.6 percentage points lower than the national average, while open employment non-English speaking consumers attained an employment outcome of 31.7%, which is 18.5 percentage points below the national average for open employment consumers.
- Consumers living in regional and remote areas were well represented in supported employment services (31.4%) and open employment (23.5%). Supported employment consumers living in regional and remote areas attained a marginally lower employment outcome than their major city counterparts (93.5% compared with 95.3%), while open employment consumers living in regional and remote areas attained a slightly higher employment outcome to that of their major city counterparts (51.3% compared to 49.6%).
1.4.5 Reliability of data
Sampling error
Sampling errors are a measure of the variability that occurs by chance because a sample, rather than the entire population, is surveyed. As a full collection of data on Australian Government funded CSTDA service outlets was undertaken, sampling error does not apply to the 2008 Disability Services Census collection.
Non-sampling error
Non-sampling errors may occur in any statistical collection during data recording, processing and reporting. There are two major sources of non-sampling error relevant to the 2008 Disability Services Census:
- Response error on the part of the disability service outlet. These errors may arise through misunderstanding or misinterpretation of responses required, inability or unwillingness to provide accurate information and mistakes in answers to questions.
A number of processes were put in place to minimise the incidence of response errors. These included assistance to disability service outlets through a telephone help line, stringent checking and editing processes for all disability service outlet and consumer data and follow-up with disability service outlets of census return information. These measures have minimised the potential incidence of response errors.
- Errors arise through the data entry process on the part of the disability service outlet and FaHCSIA and DEEWR during the collation of Disability Services Census data.
Data entry errors have been minimised with the continued use of the electronic Disability Services Census collection and upload systems. Electronic disability service outlet returns were entered directly into the upload system (without keying) where quality control checking and editing were automatically performed.
[ Return to Top Return to Section ]
1.5 Data summary of all disability service outlets, 2007-08
No. of service outlets funded in the year
- 1,201 CSTDA service outlets were funded by the Australian Government in 2007-08
- nine less CSTDA disability service outlets operated in 2007-08 than in 2006-07
Service outlet type
- 1,075 (86.3%) disability employment services
- 662 (55.1%) open employment services
- 413 (34.4%) supported employment services
- 68 (5.7%) advocacy services
- 46 (3.8%) respite services
- 10 (0.8%) print disability services
- 2 (0.2%) information services
State distribution of service outlets
- 418 (34.8%) in New South Wales
- 280 (23.3%) in Victoria
- 199 (16.6%) in Queensland
- 124 (10.3%) in South Australia
- 98 (8.2%) in Western Australia
- 39 (3.2%) in Tasmania`
- 23 (1.9%) in the Australian Capital Territory
- 20 (1.7%) in the Northern Territory
Geographic location of service outlets
- 675 (56.9%) in major cities
- 477 (40.2%) in regional areas
- 35 (2.9%) in remote areas
Service outlet period of operation
- 916 (76.3%) operated 7-8 hours a day
- 963 (80.2%) operated 5 days a week
- 1,110 (92.4%) operated 48-52 weeks in the year
No. of FTE paid staff in the reference week (Based on a 38-hour working week)
- 7,575 FTE staff assisted in Australian Government funded CSTDA services
- 1,443 (16.0%) less FTE staff worked in 2007-08 than in 2006-07
No. of FTE paid staff in each service type (Based on a 38-hour working week)
- 7,148 (94.4%) FTE staff in disability employment services
- 3,712(49.0%) FTE staff in open employment services
- 3,413 (45.0%) FTE staff in supported employment services
- 152 (2.0%) FTE staff worked in advocacy services
- 180 (2.4%) FTE staff worked in respite services
- 94 (1.2%) FTE staff in print disability services
- 2 (0.0%) FTE staff in information services
No. of volunteers in a typical week
- 216 FTE volunteers in disability service outlet operations
No. of consumers assisted in the year
- 165,340 consumers were assisted by Australian Government funded CSTDA services
No. of consumers assisted in each service type in the year
- 95,592 (66.8%) used disability employment services
- 73,425 (51.3%) used open employment services
- 22,167 (15.5%) used supported employment services
- 34,100 (23.8%) used information services
- 29,836 (20.9%) used print disability services
- 5,812 (4.1%) used respite services
[ Return to Top Return to Section ]
1.5a Data summary of disability employment services, 2007-08
No. of service outlets funded in the year
- 1,075 disability employment service outlets
- 89.5% of all disability service outlets
- 3 (0.3%) more disability employment service outlets operated in 2007-08 than in 2006-07
State distribution of service outlets
- 385 (35.8%) in New South Wales
- 250 (23.2%) in Victoria
- 184 (17.1%) in Queensland
- 113 (10.5%) in South Australia
- 79 (7.3%) in Western Australia
- 32 (3.0%) in Tasmania
- 18 (1.7%) in the Australian Capital Territory
- 14 (1.3%) in the Northern Territory
Geographic location of service outlets
- 675 (56.9%) in major cities
- 477 (40.2%) in regional areas
- 35 (2.9%) in remote areas
Service outlet period of operation
- 852 (79.3%) operated 7-8 hours a day
- 963 (80.2%) operated 5 days a week
- 1,110 (92.4%) operated 48-52 weeks in the year
No. of FTE paid staff in the reference week (Based on a 38-hour working week)
- 7,148 FTE staff worked in disability employment service outlets
- 94.4% of all disability service outlet staff
- 6.6 FTE staff per disability employment service outlet (average)
- Each consumer received 2.8 total staff hours per week (average)
No. of volunteers in a typical week
- 136 FTE volunteers assisted in disability employment service outlet operations
- 62.9% of all disability service outlet volunteers
No. of consumers assisted in the year
- 95,592 used disability employment services
- 66.8% of all consumers assisted across all disability service outlets
Consumer characteristics
Equity group representation
- 36,524 (38.2%) female consumers
- 3,418 (3.6%) Indigenous consumers
- 10,060 (10.5%) NESB consumers
- 32,041 (33.5%) regional & remote consumers
Disability information
- 27,195 (28.4%) had an intellectual disability
- 25,828 (27.0%) had a psychiatric disability
- 20,785 (21.7%) had a physical disability
- 7,232 (7.6%) had a learning disability
- 3,128 (3.3%) had autism
- 3,030 (3.2%) had a neurological disability
- 2,838 (3.0%) had a hearing disability
- 2,685 (2.8%) had an acquired brain injury
- 26,542 (27.8%) had a profound or severe core activity limitation
- 2,450 (2.6%) lived in supported accommodation
- 15,861 (16.6%) had an informal carer
Main source of income and employment
- 76,067 (79.6%) received a government pension or allowance
- 49,686 (52.0%) received DSP
- 3,109 (3.3%) had paid employment as their main source of income
[ Return to Top Return to Section ]
1.5b Data summary of open employment services, 2007-08
No. of service outlets funded in the year
- 662 open employment service outlets
- 55.1% of all disability service outlets
- 5 (0.7%) more open employment service outlets operated in 2007-08 than in 2006-07
State distribution of service outlets
- 229 (34.6%) in New South Wales
- 149 (22.5%) in Victoria
- 134 (20.2%) in Queensland
- 70 (10.6%) in South Australia
- 45 (6.8%) in Western Australia
- 17 (2.6%) in Tasmania
- 9 (1.4%) in the Australian Capital Territory
- 9 (1.4%) in the Northern Territory
Geographic location of service outlets
- 363 (55.3%) in major cities
- 273 (40.2%) in regional areas
- 21 (3.2%) in remote areas
Service outlet period of operation
- 551 (83.2%) operated 7-8 hours a day
- 565 (85.3%) operated 5 days per week
- 610 (97.1%) operated 48-52 weeks in the year
No. of FTE paid staff in the reference week (Based on a 38-hour working week)
- 3,712 FTE staff assisted in open employment service outlets
- 49.0% of all disability service outlet staff
- 5.6 FTE staff per outlet (average)
- Each consumer received 1.9 total staff hours per week (average)
No. of volunteers in a typical week
- 35 FTE volunteers in open employment service outlet operations
- 16.2% of all disability service outlet volunteers
No. of consumers assisted in the year
- 73,425 used open employment services
- 44.4% of all consumers assisted across all disability service outlets
Consumer characteristics
Equity group representation
- 28,597 (38.9%) female consumers
- 2,906 (4.0%) Indigenous consumers
- 9,289 (12.7%) NESB consumers
- 26,280 (35.8%) regional & remote consumers
Disability information
- 23,243 (31.7%) had a psychiatric disability
- 19,334 (26.3%) had a physical disability
- 11,752 (16.0%) had an intellectual disability
- 6,904 (9.4%) had a learning disability
- 4,722 (6.4%) had a sensory disability
- 2,553 (3.5%) had autism
- 2,523 (3.4%) had a neurological disability
- 2,067 (2.8%) had an acquired brain injury
- 10,630 (14.5%) had a profound or severe core activity limitation
- 5,888 (8.0%) had an informal carer
Main source of income and employment
- 54,198 (73.8%) received a government pension or allowance
- 28,041 (38.2%) received DSP
- 3,020 (4.1%) had paid employment as their main source of income
[ Return to Top Return to Section ]
1.5c Data summary of supported employment services, 2007-08
No. of service outlets funded in the year
- 413 supported employment service outlets
- 34.4% of all disability service outlets
State distribution of service outlets
- 156 (37.8%) in New South Wales
- 101 (24.5%) in Victoria
- 50 (12.1%) in Queensland
- 43 (10.4%) in South Australia
- 34 (8.2%) in Western Australia
- 15 (3.6%) in Tasmania
- 9 (2.2%) in the Australian Capital Territory
- 5 (1.2%) in the Northern Territory
Geographic location of service outlets
- 232 (56.7%) in major cities
- 167 (40.8%) in regional areas
- 10 (2.4%) in remote areas
Service outlet period of operation
- 301 (72.9%) operated 7-8 hours a day
- 326 (78.9%) operated 5 days per week
- 360 (87.2%) operated 48-52 weeks in the year
Note: data was not provided in respect of two supported employment service outlets
No. of FTE paid staff in the reference week (Based on a 38-hour working week)
- 3,436 FTE staff worked in supported employment service outlets
- 45.4% of all disability service outlet staff
- Indirect/direct support staff ratio is 1:2
- 8.3 FTE staff per outlet (average)
- Each consumer received 6.1 total direct staff support hours per week (average)
No. of volunteers in a typical week
- 102 FTE volunteers assisted in supported employment service outlet operations
- 46.9% of all disability service outlet volunteers
No. of consumers assisted in the year
- 22,167 used supported employment services
- 13.4% of all consumers assisted across all disability service outlets
- 54 consumers per outlet (average)
Consumer characteristics
Equity group representation
- 7,927 (35.8%) female consumers
- 512 (2.3%) Indigenous consumers
- 771 (3.5%) NESB consumers
- 7,142 (32.2%) regional & remote consumers
Disability information
- 15,443 (69.7%) had an intellectual disability
- 2,585 (11.7%) had a psychiatric disability
- 1,451 (6.5%) had a physical disability
- 618 (2.8%) had an acquired brain injury
- 574 (2.6%) had a sensory disability
- 575 (2.6%) had autism
- 507 (2.3%) had a neurological disability
- 328 (1.5%) had a learning disability
- 15,912 (71.8%) had a profound or severe core activity limitation
- 9,973 (45.0%) had an informal carer
- 1,881 (8.5%) lived in supported accommodation
Main source of income and employment
- 21,645 (97.6%) received DSP
- 20,995 (94.7%) were employed in 2007-08
Employment characteristics
- 29.1% worked full-time hours
- 25.6 hours worked per week (average)
- 64.1% earned $100 or less a week
- $93.16 gross weekly wage (average)
- $3.74 gross hourly wage rate (average)
[ Return to Top Return to Section ]
1.5d Data summary of advocacy services, 2007-08
No. of service outlets funded in the year
- 68 advocacy service outlets
- 5.7% of all disability service outlets
State distribution of service outlets
- 16 (23.5%) in New South Wales
- 21 (30.9%) in Victoria
- 8 (11.8%) in Queensland
- 6 (8.8%) in South Australia
- 9 (13.2%) in Western Australia
- 3 (4.4%) in Tasmania
- 2 (2.9%) in the Australian Capital Territory
- 3 (4.4%) in the Northern Territory
Geographic location of service outlets
- 47 (70.1%) in major cities
- 18 (26.9%) in regional areas
- 2 (3.0%) in remote areas
Service outlet period of operation
- 46 (67.6%) operated 7-8 hours a day
- 47 (69.1%) operated 5 days per week
- 53 (77.9%) operated 48-52 weeks in the year
No. of FTE paid staff in the reference week (Based on a 38-hour working week)
- 152 FTE staff worked in advocacy service outlets
- 2.0% of all disability service outlet staff
- 2.2 FTE staff per outlet (average)
No. of volunteers in a typical week
- 46 FTE volunteers assisted in advocacy service outlet operations
- 21.2% of all disability service outlet volunteers
- Volunteers represented 30.3% of paid staff hours in advocacy services
- second highest across all disability service types
- 0.7 FTE volunteers per outlet (average)
Note: Advocacy consumer data was not collected for 2007-08.
[ Return to Top Return to Section ]
1.5e Data summary of respite services, 2007-08
No. of service outlets funded in the year
- 46 respite service outlets
- 3.8% of all disability service outlets
State distribution of service outlets
- 14 (30.4%) in New South Wales
- 7 (15.2%) in Victoria
- 6 (13.0%) in Queensland
- 4 (8.7%) in South Australia
- 8 (17.4%) in Western Australia
- 3 (6.5%) in Tasmania
- 1 (2.2%) in the Australian Capital Territory
- 3 (6.5%) in the Northern Territory
Geographic location of service outlets
- 22 (52.5%) in major cities
- 18 (42.9%) in regional areas
- 2 (4.8%) in remote areas
Service outlet period of operation
- 10 (21.7%) operated 7-8 hours a day
- 18 (39.1%) operated 24 hours a day
- 15 (32.6%) operated 5 days per week
- 18 (39.1%) operated 7 days a week
- 45 (97.8%) operated the full 52 weeks in the year
No. of FTE paid staff in the reference week (Based on a 38-hour working week)
- 180 FTE staff worked in respite services
- 2.4% of all disability service outlet staff
- 4.0 FTE staff per outlet (average)
- Each consumer received 1.2 total staff hours in the year (average)
No. of volunteers in a typical week
- 2 FTE volunteers assisted in respite service outlet operations
- 0.8% of all disability service outlet volunteers
No. of consumers assisted in the year
- 5,812 used respite services
- 3.5% of all consumers assisted across all disability service outlets
- 126 consumers per respite outlet (average)
[ Return to Top Return to Section ]
1.5f Data summary of print disability services, 2007-08
No. of service outlets funded in the year
- 10 print disability service outlets
- 0.8% of all disability service outlets
State distribution of service outlets
- 2 (20.0%) in New South Wales
- 2 (20.0%) in Victoria
- 1 (10.0%) in Queensland
- 1 (10.0%) in South Australia
- 2 (20.0%) in Western Australia
- 1 (10.0%) in Tasmania
- 1 (10.0%) in the Australian Capital Territory
- There are no print disability service outlets operating in the Northern Territory
Geographic location of service outlets
- 9 in major cities
- 1 in regional areas
- There were no print disability service outlets operating in remote areas
Service outlet period of operation
- 6 operated 7-8 hours a day
- 8 operated 5 days per week
- 7 operated 48-52 weeks in the year
No. of FTE paid staff in the reference week (Based on a 38-hour working week)
- 94 FTE staff worked in respite services
- 1.2% of all disability service outlet staff
- 9.4 FTE staff per outlet (average)
- Each consumer received 0.1 total staff hours in the year (average)
No. of volunteers in a typical week
- 32 FTE volunteers assisted in print disability service outlet operations
- 14.8% of all disability service outlet volunteers
- Represents 1.2% of paid staff hours in disability services
- 3.2 FTE volunteers per outlet (average)
- the highest across all disability service types
No. of consumers assisted in the year
- 29,836 used print disability services
- 18.0% of all consumers assisted across all disability service outlets
- 2,984 consumers per outlet (average)
[ Return to Top Return to Section ]
1.5g Data summary of information services, 2007-08
No. of service outlets funded in the year
- 2 information service outlets
- 0.2% of all disability service outlets
State distribution of service outlets
- 1 in New South Wales
- 1 in the Australian Capital Territory
Geographic location of service outlets
- Both are located in major cities
Service outlet period of operation
- Both operated 7-8 hours a day
- Both operated 5 days a week
- Both operated the full 52 weeks in the year
No. of FTE paid staff in the reference week (Based on a 38-hour working week)
- 2 FTE paid staff worked in information services
- 0.03% of all disability service outlets
- 1.1 FTE staff per outlet (average)
No. of volunteers in a typical week
- 0.2 FTE volunteers supported information service outlet operations
No. of consumers assisted in the year
- 34,100 used information services
- 20.6% of all consumers assisted across all disability service outlets.
Chapter Two: History of the Disability Services Census
2.1 Overview of key developments
The Australian Government Disability Services Census was developed to provide comprehensive information on Australian Government funded specialist disability services, to assist in the planning, development and management of these services.
The first Disability Services Census was held in 1986. Prior to the introduction of the Disability Services Act 1986 (Cth) (DSA) on 5 June 1987, the legislative basis of disability services was the Handicapped Persons Assistance Act 1974 (Cth) (HPAA). On 4 September 1986 a census of all disability services funded under the HPAA was undertaken in preparation for the transition of these services to meet the requirements of the new legislation. Prior to the Census, the Department of Community Services and Health’s (DCSH) understanding of its disability services and consumers was limited for planning and administrative purposes. The Census of Disability Services report released in September 1988 presents a comprehensive statistical compendium on disability service operations, including staffing and financial matters, and consumer characteristics for each disability service type funded under the HPAA (DCSH 1988).
The next Disability Services Census was conducted some five years later in 1991. The resultant report provided summary statistics and commentary on all disability services funded under sections 10 and 13 of the DSA. The report’s coverage of disability service operations and consumer characteristics for each disability service type was consistent with the data presented in respect of the 1986 Census (Department of Health, Housing and Community Services, 1991).
Between 1991 and 1997, the Disability Services Census was conducted on a biennial basis. From 1998, the Census has been conducted on an annual basis. Between 1991 and 1999, Census information was collected on a ‘snapshot day’ or the day in the year the Census was conducted. From 2000, full financial year data has been collected.
A decision at the April 1993 meeting of the Working Party to the Review of Funding Arrangements for the Disability Services Program instigated a review of the 1991 Disability Services Census. As a result of this review, pilot testing was conducted in July 1993 to improve the Census collection. The resultant report was more comprehensive than its predecessor (Department of Human Services and Health 1994).
The 1995 Disability Services Census held on 18 October 1995 signified the first year in which the Census collection formed part of the first Commonwealth State Disability Agreement Minimum Dataset (CSDA MDS) conducted under the auspices of the heads of Australian, state and territory government disability services and coordinated by the Australian Institute of Health and Welfare (AIHW). The CSTDA National Minimum Dataset (CSTDA NMDS) refers to the redeveloped ongoing collection, which was fully implemented nationally in October 2002. The change in the collection’s name stems from the negotiations of the third CSTDA (AIHW 2003).
The CSTDA NMDS is both a set of nationally significant data items that are collected in all jurisdictions for national reporting on CSTDA service provision and an agreed method of collection and transmission (AIHW 2003). The purpose of the CSTDA NMDS is to enable the annual collation of nationally comparable data on CSTDA funded services and to obtain reliable and consistent data on the type and location of these services, and an understanding of the people who use those services (FaCS 1999).
In 1996, outlet based funding and administration was introduced, where disability services were split according to activity and location and reclassified as separate entities known as outlets (FaCS 1998).
While the 1997 Census report remained relatively unchanged compared with the 1995 Census report, it signified the first year in which the Department of Family and Community Services (FaCS) became responsible for the Disability Services Census. The Census was held on 24 September 1997 (FaCS 1998). Since then, the Department has continued to have overall responsibility for the Disability Services Census.
A new feature of the 1998 Disability Services Census was the Accessibility Remoteness Index of Australia (ARIA) to classify accessibility/remoteness. The ARIA classification includes Highly Accessible, Accessible, Moderately Accessible, Remote and Very Remote. The ARIA classification replaced the Rural and Remote Area (RARA) Index (FaCS 1999). In 2005, the Australian Standard Geographical Classification (ASGC) Remoteness Areas classification replaced the ARIA classification to align with AIHW’s reporting on CSTDA service provision. The ASGC Remoteness Areas classification includes Major Cities, Inner Regional Areas; Outer Regional Areas, Remote Areas and Very Remote Areas. This index offers a greater level of precision in its measurement of accessibility/ remoteness than the ARIA methodology, particularly in the more remote areas (AIHW 2004).
The 2000 Census report included two major data additions. Full financial year data on consumers accessing specialist disability employment assistance was collected for the first time, as was information on respite services (FaCS 2002). These data have been reported in subsequent Census reports.
The Machinery of Government (MoG) changes of December 2004 resulted in changes to the management of specialist disability employment assistance and subsequently to the way information on these services was presented in the 2005 census report. The MoG changes resulted in the transfer of responsibility for open employment services to the Department of Employment and Workplace Relations (DEWR) and the cessation of dual employment services as a separate disability employment service type, which provided both streams of specialist disability employment assistance. Responsibility for supported employment services stayed with FaCS. The 2005 Census report subsequently provided information on open and supported employment services only (FaCS 2006).
The 2006 Disability Services Census process reflected a significant departure from previous years with DEWR taking responsibility for the collection of open employment services data in line with the 2004 MoG changes (Department of Families, Community Services and Indigenous Affairs 2007).1 Two data sources were used for the 2006 Census collection. In addition to collecting information directly from disability service providers, FaHCSIA and DEWR also used administrative data to reduce the workload on service providers at census time.
The separate collection of open and supported employment services data continued for the 2007 Disability Services Census. To further streamline the data collection, the data provided by DEEWR2 included all data items in the CSTDA NMDS, but did not include the more detailed information on the employment characteristics of open employment service consumers collected in previous Censuses, that being the consumer’s phase and basis of employment, hours of employment, wages and industrial relations arrangements.
The structure of the 2007 Census report reflects the divergence in the Disability Services Census collection by FaHCSIA3 and DEEWR. The 2007 Census report includes information on consumers of disability employment services not provided in previous census reports. This report includes for the first time information on ‘severity of disability’, the ‘transport needs of supported employment service consumers’ and a special chapter describing changes in the profile of disability employment service consumers over time. Greater attention has also been given to the employment outcomes of equity groups and primary disability consumer groups.
The 2008 Census report mirrored the structure of the 2007 Census report – there were no changes.
- Following MoG changes in January 2006, FaCS was renamed the Department of Families, Community Services and Indigenous Affairs (FaCSIA) to reflect the merger with the Office of Indigenous Policy Coordination (OIPC).
- Following MoG changes in December 2007, DEWR was renamed the Department of Education, Employment and Workplace Relations (DEEWR) to reflect some changes in functions.
- Following MoG changes in December 2007, FaCSIA was renamed the Department of Families, Housing, Community Services and Indigenous Affairs (FaHCSIA) to reflect some changes in functions.
Chapter Three: Disability service outlet profile
- 3.1 Introduction
- 3.2 Description of disability service types
- 3.3 Number of disability service outlets
- 3.4 State distribution of disability service outlets
- 3.5 Geographic location of disability service outlets
- 3.6 Period of operation
- 3.7 National staff profile
- 3.8 Number of consumers assisted
3.1 Introduction
This chapter provides a profile of the operations of Australian Government funded CSTDA services in 2007-08. The information presented relates to the number of disability service outlets, service type provided, location of the service outlet, number of hours worked by staff, number of paid staff and volunteers, times of operation and the number of consumers assisted.
[ Return to Top Return to Section ]
3.2 Description of disability service types
Below is a description of the types of specialist disability services funded by the Australian Government under the CSTDA:
- Advocacy services assist people with disability to overcome barriers that impact on their daily life and their ability to participate in the community. Service provision focuses on six different models of advocacy: individual, citizen, family, legal, systemic, self-advocacy. The adoption of a range of models enables advocacy services to deliver flexible and responsive services to meet the needs of people with a disability.
- Disability employment services provide specialist employment assistance to people with a disability to assist them to obtain and retain employment. There are two types of disability employment services, open and supported. Open employment services assist job seekers with disability to obtain and retain employment in the open labour market. Supported employment services provide ongoing on-the-job employment support within a commercial enterprise.
- Information services facilitate access to information for people with a disability, their families, carers and professionals, and includes services to provide the information necessary to enable people with a disability to live full lives within their communities. This includes captioning of all elements of media entertainment (e.g. television, DVDs, cinema) for the deaf and/or hearing impaired.
- Print disability services produce alternative formats of communication for those who, by reason of their disability, are unable to read, hold or manipulate printed material. These alternative formats include braille, large print, audio recordings, computer discs and electronic text. These materials are delivered mainly through the Postal Concessions for the Blind program, a program funded outside the CSTDA.
- Respite services provide short term and time limited breaks for families and informal carers to assist in supporting and maintaining the primary care giving relationship, while providing a positive experience for the person with the disability.
[ Return to Top Return to Section ]
3.3 Number of disability service outlets
In 2007-08, the Australian Government funded a total of 1,201 disability service outlets nationally. Disability employment services accounted for the vast majority of disability service outlets, some 89.5% (1,075). Of these, 662 (55.1%) were open employment service outlets and 413 (34.4%) supported employment service outlets. Of the remaining 126 disability service outlets, 68 (5.7%) provided advocacy services, 46 (3.8%) respite services, 10 (0.8%) print disability services and two (0.2%) information services. Figure 3.1 shows the breakdown of disability service outlets by service type.
Figure 3.1: Disability service outlets, by service type, 2007-08
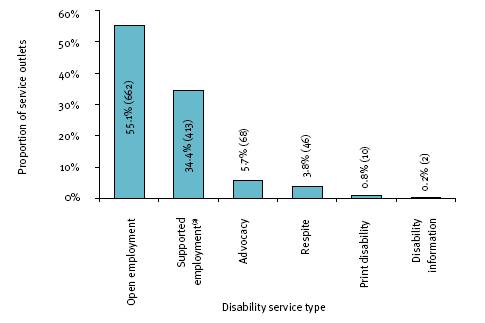
(a) Includes Targeted employment
Overall, there were nine less disability service outlets operating in 2007-08 than there were in 2006-07, down from 1,210.
[ Return to Top Return to Section ]
3.4 State distribution of disability service outlets
3.4.1 State distribution of disability service outlets across Australia
The state distribution of disability service outlets across Australia in 2007-08 is shown in Table 3.1. Importantly, the pattern is broadly consistent with the state breakdown of the general Australian population (ABS 2007a).
3.4.2 State distribution of disability service outlet types across Australia
Figure 3.2 shows the state distribution of disability service outlet types across Australia in 2007-08. Disability service outlets providing open employment, supported employment, advocacy and respite services operated in all states.
Based on the state distribution of all disability service outlets across Australia:
- the distribution of disability employment service outlets is broadly consistent with the national profile. The highest proportion of supported and open employment service outlets were located in New South Wales (37.8% and 34.6%, respectively), followed by Victoria (24.5% and 22.5%), Queensland (12.1% and 20.2%) and South Australia (10.4% and 10.6%).
- higher percentages of disability service outlets providing advocacy services were located in the following states: Victoria (30.9%), New South Wales (23.5%), Western Australia (13.2%), and Queensland (11.8%);
- higher percentages of disability service outlets providing respite services were located in the following states: New South Wales (30.4%), Western Australia (17.4%), Victoria (15.2%), Queensland (13.0%); and
- disability service outlets providing print disability services were located in each state except the Northern Territory.
Figure 3.2: State distribution of disability service outlet types across Australia, 2007-08
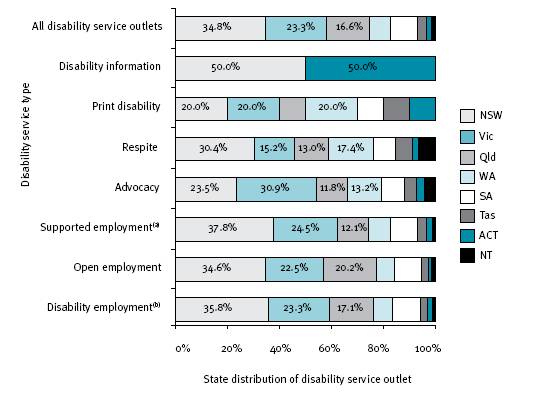
(a) Includes Targeted employment
(b) Includes Open & Supported employment
3.4.3 Disability service outlet type within each state
As shown in Table 3.2, disability employment service outlets were the most common disability service outlet type in all states in 2007-08. Overall, New South Wales had the most disability employment service outlets (385), as well as the most respite service outlets (14) and print disability service outlets (2). Victoria had the highest number of advocacy service outlets (21). The two information service outlets which provided a nationwide service were located in New South Wales and the Australian Capital Territory.
As shown in Table 3.3, Queensland and New South Wales had the highest percentage of disability employment service outlets in 2007-08, with 92.5% and 92.1% respectively. The lower representation of these services in the Australian Capital Territory (78.3%) and the Northern Territory (70.0%) is influenced by the presence of other disability service types in those states.
For instance:
- the Northern Territory had the highest percentage of disability service outlets providing advocacy services (15.0%) and respite services (15.0%), compared with the national average of 5.7% and 3.8% respectively; and
- the Australian Capital Territory had a higher than average percentage of advocacy service outlets (8.7%) and one of the two information service outlets, which together accounted for 13.0% of all its disability service outlets.
Queensland had the highest percentage of open employment service outlets (67.3%), compared with the national average of 55.1%. The Australian Capital Territory and Tasmania had the highest percentage of supported employment service outlets (39.1% and 38.5% respectively), compared with the national average of 34.4%.
[ Return to Top Return to Section ]
3.5 Geographic location of disability service outlets
3.5.1 Geographic distribution of disability service outlets
Of the 1,201 disability service outlets that operated across Australia in 2007-08, the majority were located in major cities, some 56.9% (675). Based on the major city/non-major city breakdown of the general Australian population, there was a good balance of disability service outlets located in regional and remote areas. A total of 477 (40.2%) disability service outlets were located in regional areas, with 26.2% (311) in inner regional areas and 14.0% (166) in outer regional areas. Remote and very remote areas accounted for 2.9% (35) of all disability service outlets.
Note: Locational information is derived from postcode based data. As a result of 14 disability service outlets not providing their postcode they have been excluded from being mapped in the following relevant figures and tables.
Figure 3.3 shows the distribution of disability service outlets by geographic location.
Figure 3.3: Disability service outlets, by geographic location, 2007-08
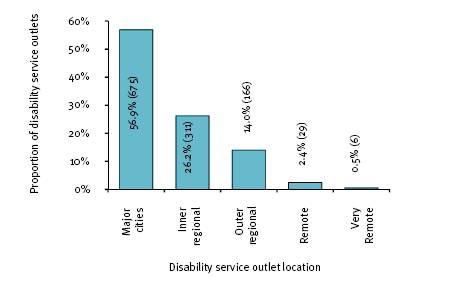
Note: Excludes 14 unmapped disability service
3.5.2 Geographic distribution of disability service outlet types
The number of disability service outlets by disability service outlet type and geographic location in 2007-08 is shown in Table 3.4. Disability service outlets providing open employment, supported employment, advocacy and respite services operated in all geographic locations. Notably, disability employment services were the most common disability service type across all geographic locations.
As shown in Figure 3.4, a high proportion of disability service types were concentrated in major cities. That said, based on the major city/non-major city breakdown of the general Australian population, there was a good balance of disability employment service outlets located in and outside major cities. A similar pattern was seen for both open and supported employment service outlets. Importantly, 44.2% (471) of disability employment service outlets were located outside major cities, with 44.7% (294) open employment service outlets and 43.3% (177) of supported employment service outlets.
Figure 3.4: Percentage of disability service type outlet, by geographic location, 2007-08
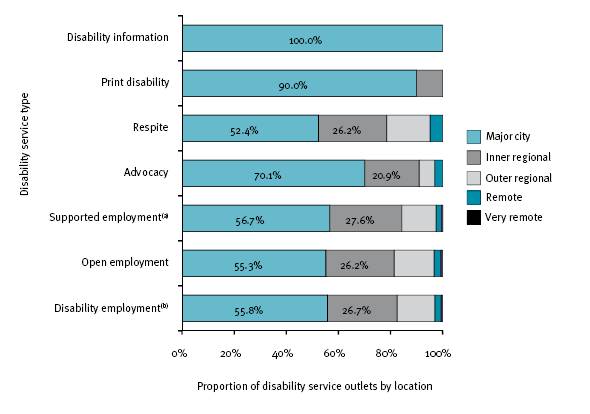
(a) Includes Targeted employment
(b) Includes Open & Supported employment
Note: Excludes 14 disability service outlets which are not mapped
Advocacy services, however, were not as well represented outside major cities, accounting for 29.9% (20) of all such service outlets. Respite services had the highest representation of disability service outlets located outside major cities, 47.6% (20).
Finally, the geographic location of print disability and information services, which are located in major cities, is not critical to their overall effectiveness in delivering a quality service to people with a disability. The service delivery method adopted by these services – telecommunications and postage – means that the needs of their target groups can be easily met on a state or nationwide basis.
[ Return to Top Return to Section ]
3.6 Period of operation
Of the 1,201 disability service outlets that operated across Australia in 2007-08, the vast majority operated 7-8 hours a day (76.3%), five days a week (80.2%), for 48 or more weeks in the year (92.4%), with 50.0% (601) operating the full 52 weeks.
3.6.1 Hours per day
As shown in Figure 3.5, the vast majority of disability service outlets operated 7-8 hours a day in 2007-08, some 76.3% (916). A further 43 (3.6%) disability service outlets operated fewer than seven hours a day and 124 (10.3%) operated between eight and 23 hours a day, with 19 (1.6%) operating 24 hours a day. A small number (29) of disability service outlets overall had no regular pattern of daily operation. In addition, 69 (5.7%) disability service outlets did not provide hours of daily operation data.
Figure 3.5: Disability service outlets, by number of hours operating per day, 2007-08
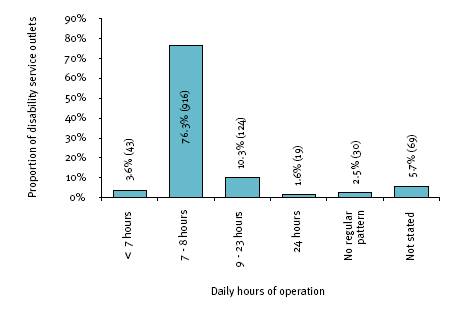
Table 3.5 shows the breakdown of the number of hours operating per day for each disability service outlet type in 2007-08. The most common number of operating hours for all disability service outlet types was 7-8 hours a day. Of the 19 disability service outlets operating for 24 hours a day 18 were respite services and the other was open employment. Of the 30 outlets with no regular pattern of operating hours per day 28 were open employment services and 2 were respite services. Some of these open employment service outlets provided an outreach service and others provided an irregular on-call service outside of their usual operating hours.
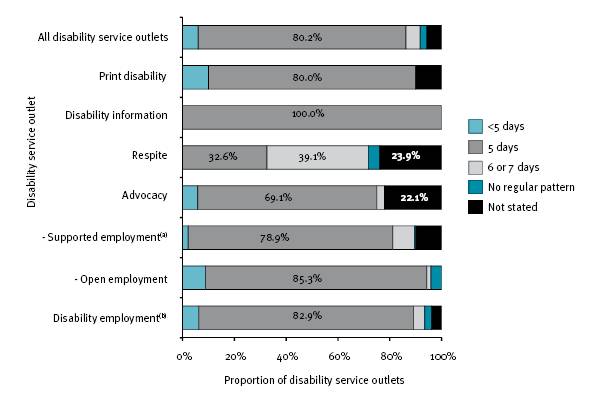
3.6.2 Days per week
As shown in Table 3.6, the vast majority, some 80.2% (963) of disability service outlets operated five days a week in 2007-08. A further 73 (6.1%) disability service outlets operated less than five days a week and 66 (5.5%) operated six or seven days a week, with most of these (46) operating seven days a week. Overall a small number (31) of disability service outlets overall had no regular pattern of weekly operation. There were an additional 68 disability service outlets which did not provide weeks of operation data.
Table 3.7 shows the breakdown of the number of operating days per week for each disability service outlet type in 2007-08. Respite services were more likely than any other disability services type to operate seven days a week, accounting for 39.1% (18) of all disability service outlets to have operated these days. Twenty seven of the 31 disability service outlets with no regular pattern of operating days per week were providing open employment services.
Figure 3.6 shows the breakdown of the operating days per week for each disability service outlet type in 2007-08.
Figure 3.6: Disability service outlet type, by operating days per week, 2007-08
(a) Includes Targeted employment
(b) Includes Open & Supported employment
3.6.3 Weeks per year
As shown in Table 3.8, 92.4% (1,110) of disability service outlets operated 48 or more weeks in 2007-08, with 50.0% (601) operated the full 52 weeks, and 42.4% (509) operated 48-51 weeks in the year. A small number of disability service outlets (44) operated for fewer than 48 weeks in the year. Only 11 disability service outlets had no regular pattern of weeks of operation in the year, while 36 disability service outlets did not provide weeks of operation data.
Figure 3.7 shows the breakdown of the operating weeks for each disability service outlet type in 2007-08.
Figure 3.7: Disability service outlet type, by operating weeks in 2007-08
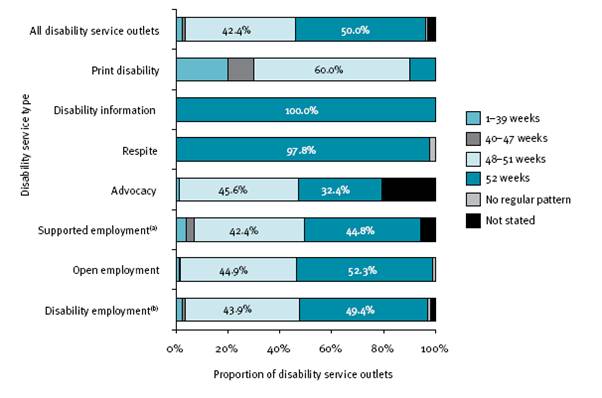
(a) Includes Targeted employment
(b) Includes Open & Supported employment
Of those disability service outlets that operated for 52 weeks per year, the highest proportion by disability service type were disability information (100%), and respite services - 45 (97.8%) of the 46 outlets.
Sixty per cent of print disability outlets reported operating 48-51 weeks in the year, with 42.4% supported employment, 44.9% open employment and 45.6% advocacy services reported operating for the same period of time.
[ Return to Top Return to Section ]
3.7 National staff profile
3.7.1 Hours worked by paid staff
In 2007-08, a total of 287,864 paid staff hours in the reference week were spent on disability service outlet operations. There were 54,824 (16.0%) less paid staff hours in the reference week spent on disability service outlet operations in 2007-08 than there were in 2006-07, down from 342,688.
Full-time equivalent (FTE) paid staff
Based on a 38-hour working week, a total of 7,575 FTE paid staff worked in disability service outlets across Australia in 2007-08. This equates to an average of 6.31 FTE paid staff in each disability service outlet. There were 1,443 (16.0%) less FTE paid staff working in disability service outlets in 2007-08 than there were in 2006- 07, down from 9,018.
Figure 3.8 shows the breakdown of FTE paid staff for each disability service outlet type in 2007-08.
Figure 3.8: Disability service outlet type, by FTE paid staff, 2007-08
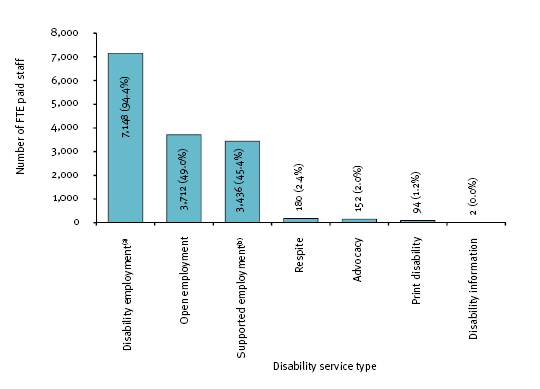
(a) Includes Open & Supported employment
(b) Includes Targeted employment
Note: FTE paid staff have been rounded to the nearest whole number
Most FTE paid staff (3,712) worked in open employment services and (3,436) supported employment services (49.0% and 45.4% respectively). A further 180 (2.4%) FTE paid staff worked in respite services, 152 (2.0%) in advocacy services, 94 (1.2%) in print disability services, and 2 (0.0%) in information services.
3.7.2 Role of paid staff – direct and indirect support staff
The role of paid staff in disability service outlets is measured in terms of the provision of direct and indirect staff support:
- Direct support staff – staff that have direct contact with consumers in a support role. This includes coordinators, case workers and other staff who spend a major portion of their time in direct consumer contact.
- Indirect support staff – staff who have no, or only minimal, direct contact with consumers e.g. management staff, administrative staff, training personnel, etc.
A national breakdown of staff working in direct and indirect staff support roles in 2007-08 is not possible as this information was not collected in respect of open employment services. Of the data that is available, the ratio of direct to indirect support staff in disability service outlets was 2.1:1.
Table 3.9 shows the breakdown of staff working in direct and indirect staff support roles by disability service outlet type in 2007-08. Some caution, however, should be exercised in drawing conclusions from data on FTE direct support paid staff, since this will be strongly influenced by the type of service being provided. Respite services had the highest percentage of paid staff working in direct support roles, with 78.1% of all FTE paid staff engaged in service delivery. Disability information services had the highest percentage of paid staff working in indirect support roles, with 51.1% of all FTE paid staff involved in management or other administrative duties.
3.7.3 Volunteers
In 2007-08, a total of 8,225 hours of volunteer support in a typical week were spent on disability service outlet operations. This represents 2.9% of paid staff hours, or an equivalent of another 216 FTE staff based on a 38-hour working week.
Table 3.10 shows the breakdown of the use of volunteer support by disability service outlet type in a typical week in 2007-08. The supported employment sector had the largest volunteer workforce, accounting for 46.9% (136 FTE volunteers). Nationally, the number of volunteers per disability outlet represented 0.2 persons. Overall, print disability was most likely to use the support of volunteers to supplement day-to-day service outlet operations, with volunteer support hours representing 34.5% of paid staff hours.
[ Return to Top Return to Section ]
3.8 Number of consumers assisted
In 2007-08, a total of 165,340* consumers of disability services were assisted through Australian Government funded CSTDA services.
Across the disability service outlet types, as shown in Figure 3.9, just over half (95,592 or 57.8%) of all consumers accessed specialist disability employment assistance, with 73,425 (44.4%) using open employment services and 22,167 (13.4%) using supported employment services. A further 34,100 (20.6%) used information services, 29,836 (18.0%) consumers used print disability services, 5,812 (3.5%) used respite services. No data was collected on the number of advocacy service consumers.
Note:
* Data represents a count of service types used, and may not represent a count of consumers. Double counting may occur where a consumer utilises more than one service type, or the same service type across multiple service outlets.
Figure 3.9: All consumers assisted, by disability service outlet type, 2007-08
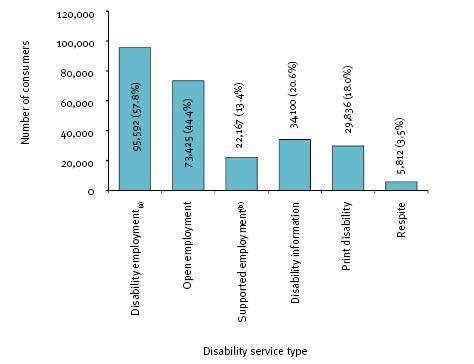
(a) Includes Open & Supported employment.
(b) Includes Targeted employment.
Notes:
Data represents a count of service types used, and may not represent a count of consumers.
Double counting may occur where a consumer utilises more than one service type, or the same service type across multiple service outlets.
Advocacy consumer data not available.
Chapter Four: National disability employment services consumer profile
- 4.1 Introduction
- 4.2 Disability employment services population
- 4.3 Open employment services population
- 4.4 Supported employment services population
- 4.5 Comparison between open and supported employment service consumers
4.1 Introduction
The Australian Government has a longstanding, growing and ongoing commitment to encouraging and assisting people with disability into paid employment, in recognition of the substantial barriers they can face in entering and remaining in the workforce. To help overcome these barriers, the Australian Government provides specialist disability employment assistance and related services.
Under the National Disability Agreement, the Australian Government is responsible for the planning, policy setting and management of specialist disability employment assistance. The provision of this assistance is designed to increase levels of employment among people with disability by assisting those who need assistance to enter and remain in the workforce.
Specialist disability employment assistance is delivered through disability employment services in both open and supported employment services. Open employment services assist job seekers with disability to obtain and retain employment in the open labour market. Supported employment services, on the other hand, provide ongoing on-the-job employment support within a commercial enterprise.
This chapter presents a national profile on the disability employment services population in 2007-08, and provides important information to assist in the monitoring of the usage of specialist disability employment assistance and the employment outcomes attained by consumers.
The chapter provides information on the number of consumers assisted by disability employment services, and includes information on their demographic characteristics, disability characteristics, informal carer arrangements, income, employment outcomes, employment characteristics and industrial arrangements. Separate commentary is also provided on open and supported employment service consumers and the key differences between these two consumer groups. The commentary provided on open employment service consumers is different to that in previous census reports to reflect changes in the reporting requirements for open employment service providers. The main change is that employment characteristics data is no longer collected. The commentary also draws on other research and general Australian population data to enhance the overall analysis.
The data on disability employment service consumers in this chapter are reported in two ways. The first provides data on ‘all consumers’ who received assistance from disability employment services during 2007-08. The second provides data on a ‘snapshot’ or ‘on the books’ basis. Consumers ‘on the books’ are registered as receiving assistance from disability employment services on Census Day, 30 June 2008. This chapter provides commentary mostly on ‘all consumers’. The commentary provided on consumers ‘on the books’ relates only to the employment characteristics of supported employment service consumers as full financial year data was not collected for this information.
[ Return to Top Return to Section ]
4.2 Disability employment services population
4.2.1 Number of consumers assisted
All consumers
In 2007-08, a total of 95,592 consumers were assisted by disability employment services nationally. This is an increase of 12,825 (15.5%) disability employment service consumers since 2006-07, up from 82,767. Much of this growth can be attributed to the expansion of the open employment sector with the introduction of initiatives related to Welfare to Work reforms from July 2006.
Consumers ‘on the books’
On Census Day at 30 June 2008, there were 70,233 consumers ‘on the books’ in disability employment services. This is an increase of 8,170 (13.2%) disability employment service consumers on 2007-08, up from 62,063.
New starters and leavers
During 2007-08, some 38,988 consumers commenced assistance in disability employment services, accounting for 40.8% of all consumers.
A total of 23,911 consumers left their disability employment service in the same year, accounting for 25.0% of all consumers. Table 4.1 shows the main reason consumers left their disability employment service in 2007-08.
The main reason for leaving was ‘consumer no longer needs assistance’. This accounted for 54.9% (13,117) of all consumers who left their disability employment service. The two other main reasons for leaving were ‘consumer terminated service’ (17.4% or 4,157) and ‘consumer needs have increased’ (7.8% or 1,869). Together, these three main reasons for leaving accounted for 80% (19,143) of all consumers who left their disability employment service in 2007-08. The main reason for leaving was identified as ‘other’ for 18.4% (4,393) of consumers.
4.2.2 Demographics
The demographic characteristics of consumers accessing specialist disability employment assistance in 2007-08 include information on their gender, age, Indigenous status, country of birth, the state and geographical location of their area of usual residence, living arrangements and accommodation setting.
Gender
Consistent with previous years, males were much more likely than females to access disability employment services in 2007-08, 61.8% (59,068) compared with 38.2% (36,524). This compares with 54.8% of males and 45.2% females in the general Australian labour force population aged 15 years and older (ABS 2008).
Age
The age categories presented in this report are different to those in previous census reports prior to 2006-07, to better align with AIHW’s reporting on CSTDA service provision and ABS publications. To ensure comparisons can still be made over time, data on the age categories used in previous census reports is provided in the Appendices at Table 2A.
Figure 4.1 shows the age distribution of the disability employment services population in 2007-08.
Figure 4.1: All disability employment service consumers, by age group, 2007-08
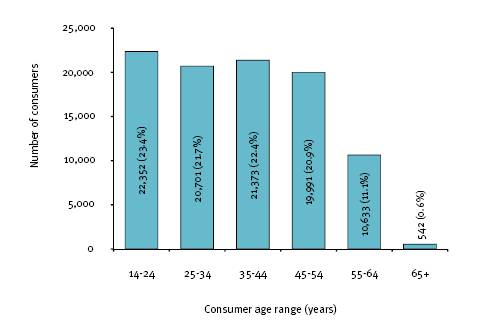
The number of consumers accessing disability employment services declined with age. Some 23.4% (22,352) of consumers were aged 14-24 years, while 20.9% (19,991) were aged 45-54 years. Approximately 11.7% (11,175) of consumers were aged 55 years and older, with 11.1% (10,633) aged 55-64 years. The median age of the disability employment services population was 37 years.
The disability employment services population has a younger age profile compared with the general Australian labour force population aged 15 years and older. Some 67.4% of disability employment service consumers were under the age of 45 years, compared with 62.8% of the general Australian labour force population aged 15 years and older (ABS 2007b). The lower representation of older consumers in disability employment services may reflect the increased effects of disability on a person’s ability to participate in the labour force (ABS 2005).
Indigenous status
In 2007-08, a total of 3,418 Indigenous consumers were assisted by disability employment services. The Indigenous status of consumers was unknown for 206 consumers. The representation of Indigenous consumers in disability employment services was 3.6%. This compares with 1.8% in the general Australian population aged 15 years and older (ABS 2007a).
Country of birth
In 2007-08, 83.2% (79,514) of consumers accessing disability employment services were born in Australia. A total of 15,184 (15.9%) consumers were born overseas, of whom 10.5% (10,060) were born in non-English speaking countries and 5.4% (5,124) in English speaking countries. Country of birth data was not stated for 0.9% (894) of consumers. Figure 4.2 shows the disability employment services population by country of birth category.
Figure 4.2: All disability employment service consumers, by country of birth category, 2007-08
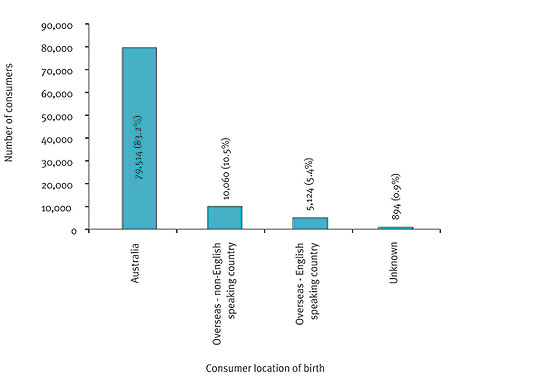
The most common overseas countries of birth among disability employment service consumers are shown in Table 4.2.
Among the 10,060 disability employment service consumers born in non-English speaking countries, some 211 consumers needed interpreter assistance. As a group, they accounted for 2.1% of all non-English speaking born consumers and 0.2% of all consumers.
Notably, the general Australian population is somewhat more likely than the disability employment services population to have been born overseas (22.2% compared with 15.9%) (ABS 2007). The lower representation of people born overseas in disability employment services is largely related to the health requirements governing permanent entry to Australia set down in migration legislation. This means for example that a person with disability is unlikely to be granted permanent residency in circumstances where they need access to health or community services (Migration Regulations 1994 (Cth), Item 4005). Importantly, a waiver of the need to meet the health requirements is available for people moving to Australia on humanitarian grounds (Department of Immigration and Citizenship 2007). Due to the health requirements governing permanent entry to Australia, many overseas-born disability employment service consumers would have acquired their disability while living in Australia.
State or territory of usual residence
Consistent with the general Australian population, the states with the largest disability employment services populations in 2007-08 were New South Wales (32.5% or 31,084), Victoria (26.0% or 24,890) and Queensland (19.1% or 18,212). Together, they accounted for 77.6% (74,186) of all consumers. Those living in South Australia and Western Australia accounted for 9.1% (8,733) and 8.7% (8,319) respectively of all consumers. Of the balance, 2.5% (2,385) of consumers were living in Tasmania, 1.3% (1,221) in the Australian Capital Territory and 0.7% (636) in the Northern Territory. There were an additional 112 consumers where the state of residence was unknown. Figure 4.3 shows the state and territory distribution of the disability employment services population.
Figure 4.3: All disability employment service consumers, by state or territory of usual residence, 2007-08
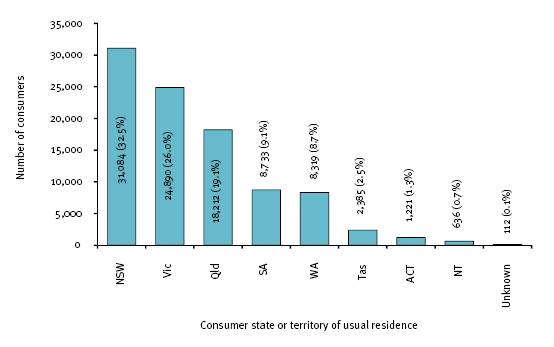
Geographic location of usual residence
Consistent with the general Australian population, major cities were home to the largest percentage of consumers accessing disability employment services in 2007-08, accounting for 64.7% (61,815) of all consumers. Those living in regional areas accounted for 33.5% (32,041) of all consumers, with 23.3% (22,263) in inner regional areas and 10.2% (9,778) in outer regional areas. The remaining 1.8% (1,736) of consumers were living in remote, very remote areas, and unknown areas. Figure 4.4 shows the distribution of the disability employment services population by geographic location of usual residence.
Figure 4.4: All disability employment service consumers, by geographic location of usual residence, 2007-08
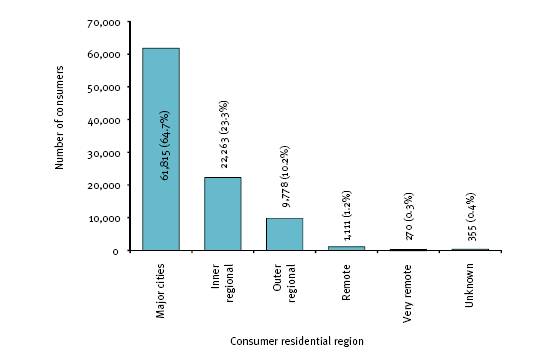
Living arrangements and accommodation setting
In 2007-08, disability employment service consumers were most likely to be living with family, accounting for 47.2% (45,116) of all consumers. A further 18.0% (17,193) of consumers were living with others and 20.9% (20,014) living alone. Living arrangements data was not stated for 13.9% (13,269) of consumers. Figure 4.5 shows the living arrangements of disability employment service consumers.
Figure 4.5: All disability employment service consumers, by living arrangements, 2007-08
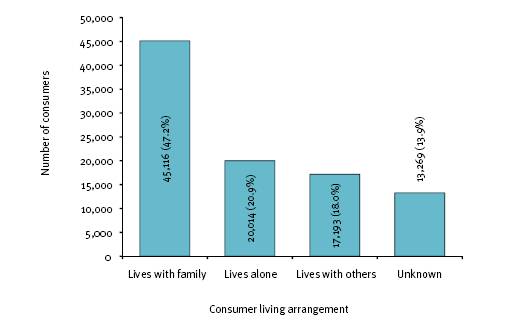
Further, disability employment service consumers were more likely to be living in a private residence than in any other setting in 2007-08, some 87.6% (83,756). Further 2.6% (2,450) consumers were living in supported accommodation, while 172 consumers were residing in boarding houses or private hotels and 204 had other accommodation settings. Accommodation setting data was not stated for 9.4% (9,010) of consumers. Table 4.3 shows the accommodation setting of disability employment service consumers, and Figure 4.6 shows the split of supported accommodation types.
Figure 4.6: All disability employment service consumers that are in supported accommodation, by supported accommodation setting, 2007-08
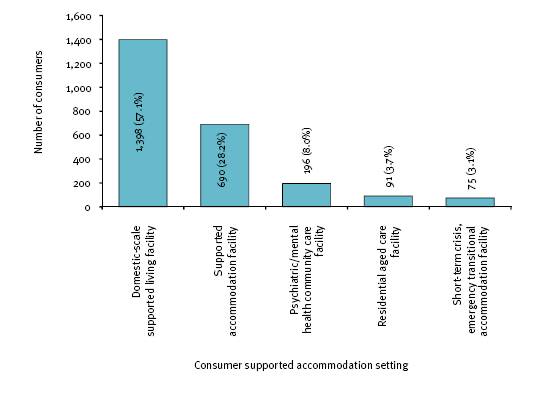
4.2.3 Disability profile
The disability profile of consumers accessing specialist disability employment assistance in 2007-08 includes information on their primary disability, the presence of any other significant disability, severity of disability and need for assistance in nine main life areas.
Primary disability
‘Primary disability’ refers to the disability causing the most difficulty to the person in daily life, compared with any other disability the person may have.
As shown in Figure 4.7, the primary disability profile of the disability employment services population is diverse. In 2007-08, consumers with an intellectual disability were the largest group accessing disability employment services, some 28.4% (27,195). Consumers with a psychiatric and physical disability were the second and third largest groups, accounting for 27.0% (25,828) and 21.7% (20,785) respectively. Together, consumers with an intellectual, psychiatric and physical disability accounted for 77.2% (73,808) of all disability employment service consumers.
A further 7.6% (7,232) of consumers had a specific learning disability/ADD. Autism 3.3% (3,128), neurological disability 3.2% (3,030), hearing disability 3.0% (2,838), acquired brain injury 2.8% (2,685), and vision 2.5% (2,376) were similarly represented. Of the balance, 0.4% of consumers had a speech (356) and deafblind (82) disability. Primary disability data was not stated for 0.1% (57) of consumers.
Figure 4.7: All disability employment service consumers, by primary disability type, 2007-08
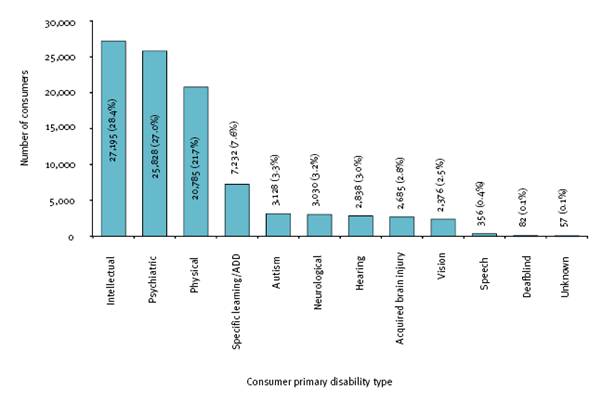
Other significant disability
Figure 4.8 provides information on the disability employment service consumers with other significant disabilities. In 2007-08, some 40,839 (42.7%) consumers had multiple or other significant disabilities. Among this group, they were more likely to have a physical disability than any other significant disability type, some 25.0% (10,199). The second most common other significant disability type was psychiatric disability, accounting for 23.8% (9,707) of all disability employment service consumers with other significant disabilities. The third and fourth most common other significant disabilities were specific learning disability/ADD and intellectual disability, accounting for 15.0% (6,134) and 9.3% (3,801) of all disability employment service consumers with other significant disabilities.
Figure 4.8: All disability employment service consumers with another significant disability, by other significant disability type, 2007-08
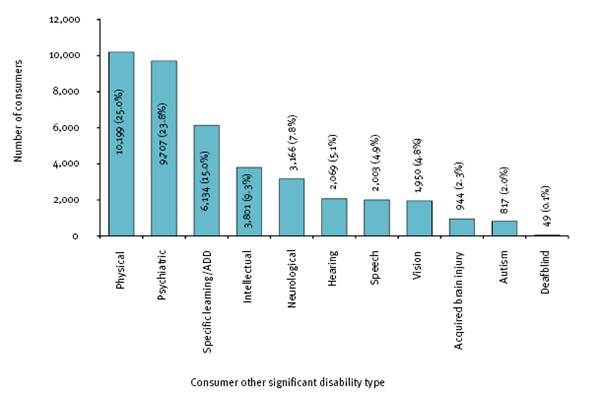
Severity of disability
The severity of a person’s disability relates to the level of help or support they needed. The extent to which a person’s disability affects everyday life is indicated by the presence of a core activity limitation. A core activity limitation refers to whether a person needs help, has difficulty, or uses aids or equipment with the core activities of self-care, mobility or communication (ABS 2004). These core activities are commonly referred to as activities of daily living and are strongly associated with autonomy and the performance of other life roles.
A person’s overall level of core activity limitation is determined by the highest level of help or support needed in any of the core activities. For the purposes of this report, three levels of core activity limitation (or severity of disability) are used. These are profound, severe and moderate to none. A person with a profound core activity limitation is unable to do, or always needs help with, a core activity. A person with a severe core activity limitation sometimes needs help with a core activity, or has difficulty understanding or being understood by family or friends, or communicates more easily using sign language or other forms of non-spoken communication. A person with a moderate to no core activity limitation needs no help but has difficulty with a core activity or needs no help but uses aids and equipment (ABS 2004).
Figure 4.9 shows the severity of disability of disability employment service consumers. In 2007-08, 6.5% (6,230) consumers had a profound core activity limitation and 21.2% (20,312) a severe core activity limitation. Together, 27.8% (26,542) of consumers had a profound or severe core activity limitation. A further 66.5% (63,559) of consumers had a moderate to no core activity limitation. Severity of disability data was unknown for 5.7% (5,491) of consumers.
Figure 4.9: All disability employment service consumers, by severity of disability, 2007-08
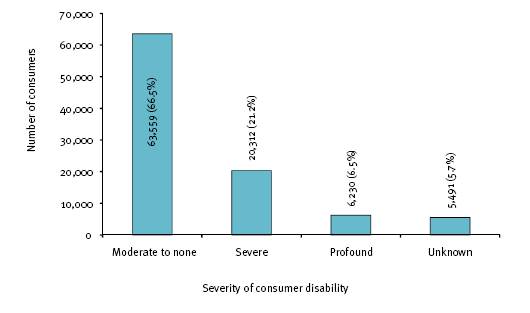
There were also clear and significant differences in the severity of disability of disability employment service consumers by primary disability type in 2007-08.
For instance, in Figure 4.10:
- Disability employment service consumers who are deafblind required the highest level of support with a core activity. Of those consumers 85.4% had a profound or severe core activity limitation, which is well above the national average of 27.8%.
- The next highest groups of disability employment service consumers who required the highest level of support were, intellectual (53.7%) and autism (34.4%). There were 61.4% with an ‘unknown’ primary disability type.
- Disability employment service consumers whose primary disability is neurological, vision, speech, psychiatric, physical or specific learning/ADD had a profound or severe core activity limitation somewhat lower than the national average, ranging from 10.0% to 27.4%.
Figure 4.10: All disability employment service consumers with a profound or severe core activity limitation, by primary disability type, 2007-08
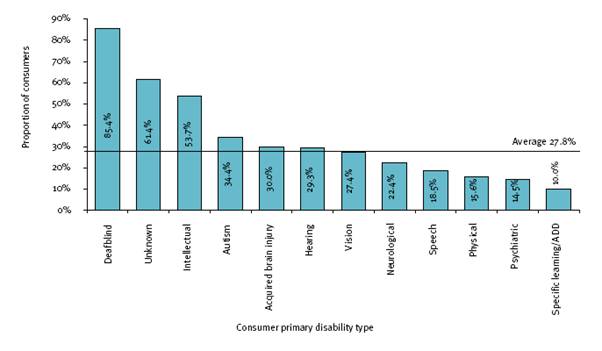
Need for assistance
The support needs of consumers accessing disability employment services relate to nine main life areas in which a person may participate or undertake activities. These main life areas are self-care, communication, mobility, interpersonal interactions and relationships, learning and applying knowledge, domestic life, education, community (civic) and economic life, and working. These nine main life areas conform to a common framework that is consistent with the International Classification of Functioning, Disability and Health (ICF) (AIHW 2007). This framework enables us to compile a coherent summary of the support needs of this consumer group.
As a group, disability employment service consumers needed substantial support across the majority of the main life areas in 2007-08. Figure 4.11 shows the percentage of disability employment service consumers who always or sometimes needed support in each main life area, and Table 4.4 shows all levels of support needed by these consumers in each main life area.
The main life areas in which disability employment service consumers were most likely to need support are learning and applying knowledge, and interpersonal interactions and relationships. The corresponding percentage and number of consumers who always or sometimes needed support in these life areas are 62.7% (59,928) and 60.6% (57,930).
Excluding the ‘unknown’ category from the overall count, the percentage of disability employment service consumers who always or sometimes needed support in these life areas is 67.6% for community (civic) and economic life, 66.2% for learning, and 64.8% for interpersonal interactions and relationships.
Some 59.3% (56,635) of disability employment service consumers always or sometimes needed support in the main life area of community (civic) and economic life – which is strongly related to the need for support in the main life areas of learning and applying knowledge, interpersonal interactions and relationships and communication. This percentage rises to 67.6% when the ‘not stated’ category is excluded from the overall count.
These limitations together mean that disability employment service consumers needed substantial support with social engagement in the community, as well as with understanding new ideas, coping with feelings or emotions, making sound decisions, remembering and undertaking daily tasks. These limitations, in turn, impact upon their ability to undertake actions and behaviours needed to obtain and retain employment. Some 56.6% (54,143) of consumers always or sometimes needed support in the main life area of working. This percentage rises to 59.5% when the ‘not stated’ category is excluded from the overall count.
Disability employment service consumers, on the other hand, were least likely to need support in the home environment, including attending to their self-care needs and walking and moving about. Moreover, the majority of consumers needed no support with the main life areas of self-care, mobility and domestic life, 77.2% (73,853), 76.2% (72,784) and 64.2% (61,341) respectively. These percentages rise to 85.7%, 82.5% and 74.8% respectively when the ‘not stated’ category is excluded from the overall count.
Figure 4.11: All disability employment service consumers who always or sometimes needed support, by main life area, 2007-08
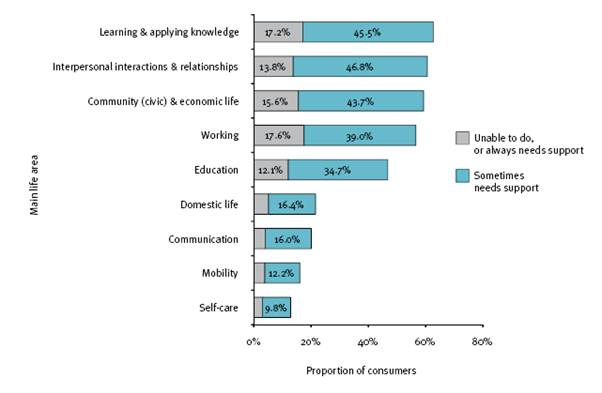
Worthy of mention is that the percentage of disability employment service consumers who always or sometimes needed support in 2007-08 was higher in five of the nine main life areas compared with 2006-07. The exceptions were the main life areas of education, communication, mobility and self-care. These differences are shown in Table 4.5. The significant change in the support profile of consumers over the past year is partly due to a change in the way open employment service consumer support needs were derived for the CSTDA NMDS. The introduction of the open employment services uncapped stream from 1 July 2006 has also contributed to the net reduction in the percentage of disability employment service consumers needing support. The open employment service uncapped stream is designed for people with disability assessed as having significant capacity for paid work in the open labour market. This consumer group will generally have lower support needs than consumers in the open employment service capped stream.
4.2.4 Informal carer arrangements
An informal carer is ‘a person, such as a family member, friend or neighbour, who provides regular and sustained care and assistance to the person requiring support’ (AIHW 2009, p. 32). In 2007-08, some 15,861 disability employment service consumers had an informal carer, accounting for 16.6% of all consumers.
Figure 4.12: All disability employment service consumers, by relationship of informal carer to consumer, 2007-08
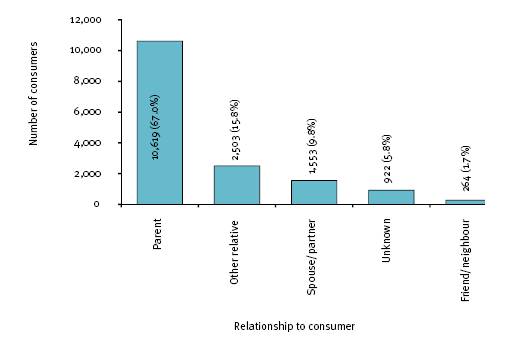
The relationship of the informal carer to the disability employment service consumer for whom they care is shown in Figure 4.12. Of the 15,861 consumers with an informal carer, the vast majority were being cared for by a parent, some 67.0% (10,619). For 9.8% (1,553) of consumers, a spouse/partner was providing the care. A further 15.8% (2,503) of consumers were being assisted by other relatives and 1.7% (264) by a friend or neighbour. Relationship of informal carer to consumer data was ‘unknown’ for 5.8% (922) of consumers.
4.2.5 Income
The main source of income is known for 84.8% (81,042) of consumers accessing disability employment services in 2007-08. A government pension or allowance was the main source of income for over three-quarters (76,076) of consumers, with the majority (52.0% or 49,686) receiving a disability support pension and around a quarter (27.6% or 26,390) some other pension or allowance. Paid employment was the main source of income for 3.3% (3,109) of consumers. A further 1.9 % (1,610) of consumers were receiving income from other sources such as compensation and superannuation. Less than 0.1% (23) of consumers had no income. Figure 4.13 shows the main source of income for disability employment service consumers in 2007-08.
Figure 4.13: All disability employment service consumers, by main source of income, 2007-08
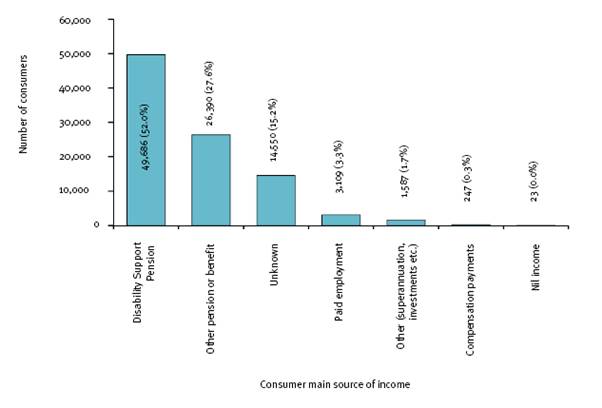
4.2.6 Employment outcomes
The provision of specialist disability employment assistance continues to provide invaluable assistance to people with disability who need assistance to enter and remain in the workforce. Throughout 2007-08, disability employment services delivered strong employment outcomes overall for consumers.
‘Employment outcomes’ refers to those consumers in disability employment services who were employed for some or all of the time during 2007-08. It differs from, and should not be confused with, the employment outcome measure applying to the case-based funding model for disability employment services, which uses an hours and duration in employment measure.
In 2007-08, employment outcomes were achieved for 57,852 people with a disability. This equates to a national employment outcome rate of 60.5%. Of these consumers, 63.7% (36,857) were open employment service consumers and 36.3% (20,995) were supported employment service consumers
Equity groups
In the broader Australian labour force, disadvantage remains a significant feature of the employment experience of people from equity groups – women, Aboriginal and Torres Strait Islander people, people from non-English speaking backgrounds, people with disability and people living in regional and remote areas. Multiple or cumulative disadvantage may exist where people have two or more equity group characteristics. People from equity groups continue to have lower levels of employment than other Australians. For this reason, it is important to identify the extent to which disability employment service consumers from equity groups attained employment outcomes compared with other disability employment service consumers.
Figure 4.14 shows the employment outcomes for disability employment service consumers by equity group in 2007-08. The data point to clear and significant differences in the employment outcomes of disability employment service consumers from equity groups. For instance:
- Even though female consumers attained a marginally lower employment outcome than their male counterparts (57.5% compared with 62.4%), as a group they remain significantly under-represented in disability employment services, accounting for only 38.2% of all disability employment service consumers.
- Indigenous consumers who represented 3.6% of all consumers faced significant challenges in obtaining employment. As a group, 46.4% attained an employment outcome, which is considerably lower than the national average of 60.5%.
- Consumers born in non-English speaking countries representing 10.5% of all consumers, faced significant challenges in obtaining employment. As a group, 36.6% attained an employment outcome, some 23.9 percentage points lower than the national average.
- Consumers living in regional and remote areas are well represented in disability employment services (35.0%) and attained a marginally lower employment outcome than their major city counterparts (60.6% compared with 60.4%).
Figure 4.14: All disability employment service consumers, by equity group and employment outcome, 2007-08
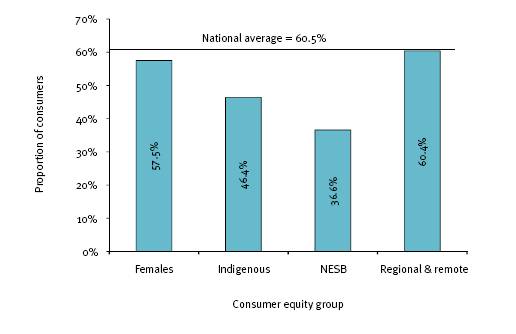
Age
It is generally understood that workforce participation declines with age. This pattern is more pronounced among people with disability, reflecting the increased effects of disability on a person’s ability to work as they age (ABS 2005).
Figure 4.15 shows the employment outcomes for disability employment service consumers by age in 2007-08.
Figure 4.15: All disability employment service consumers with an employment outcome, by age, 2007-08
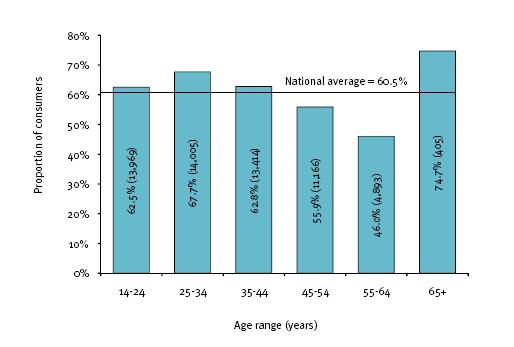
Primary disability type
The nature of the person’s disability can have an effect on their ability to obtain employment (ABS 2005). As shown in Table 4.6, the employment outcomes of disability employment service consumers varied significantly by primary disability type in 2007-08. The highest employment outcome was attained by consumers with an intellectual disability, and deafblind disability (85.4% for both). This is well above the national average of 60.5%.
Further, the employment outcomes for disability employment service consumers with an acquired brain injury, hearing, autism, speech, specific learning/ADD, and vision disability were marginally higher than the national average (66.7%, 66.3%, 65.9%, 65.7%, 61.4% and 61.2% respectively).
Notably, disability employment service consumers with a neurological, psychiatric, and physical disability faced the greatest challenges in obtaining an employment outcome (58.3%, 48.9%, and 39.7% respectively).
The lower employment outcome among disability employment service consumers with a physical disability is related to their older age profile and the discernible lower employment outcomes among older consumers generally. The median age of this group was 47 years, some 10 years older than the median age for all disability employment service consumers (37 years).
The lower employment outcome among disability employment service consumers with a psychiatric disability, on the other hand, is related to the episodic nature of this disability, which limits employment options; can affect work behaviour; and can lead to employer reluctance to hire a person with this disability.
Severity of disability
In the general Australian disability population, employment participation decreases as severity of disability increases (ABS 2005). Surprisingly, in the disability employment services population in 2007-08, consumers with a profound core activity limitation attained the highest employment outcome (92.5%). Notably, this figure is highly influenced by the 97.9% of supported employment service consumers with a profound core activity limitation who attained an employment outcome.
[ Return to Top Return to Section ]
4.3 Open employment services population
4.3.1 What are open employment services?
Open employment services provide assistance to job seekers with disability to help them obtain and retain employment in the open labour market. The assistance includes employment preparation, job search, job placement, and post placement or ongoing support.
Open employment services provide two streams of assistance, ‘Capped’ stream and ‘Uncapped’ stream:
To be eligible for assistance under the disability employment network (DEN) capped stream, a job seeker must:
- have an assessed future capacity to work 8 or more hours per week; and/or
- require ongoing support after being placed into employment and/or are unable to work at full wages.
Job seekers do not need to be in receipt of income support payment to be eligible for DEN Capped.
Job seekers who are working at least 8 hours per week are ineligible for referral to DEN Capped.
To be eligible under the DEN uncapped stream, a job seeker must:
- have an assessed future capacity to work of 15 or more hours per week; and
- be receiving or likely to receive Newstart Allowance, Youth Allowance or Parenting Payment; and
- have or likely to have, part time participation requirements; and
- be able to work independently at full wages in the open labour market with up to 24 months of employment assistance; and
- require more than 6 months (but less than 24 months) of support after being placed in employment.
Job seekers working for at least 15 hours per week are ineligible for referral to DEN Uncapped.
4.3.2 Number of consumers assisted
All consumers
In 2007-08, a total of 73,425 consumers were assisted by open employment services nationally. This is an increase of 12,651 (20.8%) open employment service consumers on 2006-07, up from 60,774.
Consumers ‘on the books’
On Census Day at 30 June 2008, there were 50,711 consumers ‘on the books’ in open employment services.
New starters and leavers
During 2007-08, 35,231 consumers commenced assistance in open employment services, either for the first time or having exited assistance in the previous financial years. As a group, they accounted for 48.0% of all open employment service consumers.
A total of 21,266 consumers left their open employment service in the same year, accounting for 29.0% of all open employment service consumers. The main reason these consumers left their service is shown in Table 4.7. The main reason for leaving was ‘consumer no longer needs assistance’. They accounted for 59.0% (12,551) of all consumers who left their open employment service, and includes job seekers who exited to employment. Of these, 52.9% (6,641) ‘moved to a mainstream service’ of some sort, and 47.1% (5,910) were not referred to further assistance. The two other main reasons for leaving included ‘consumer terminated service’ (15.9% or 3,373) and ‘consumer needs have increased’ (7.7% or 1,630). Together, these three main reasons for leaving accounted for 82.6% (17,554) of all consumers who left their open employment service in 2007-08. The main reason for leaving for 16.9% (3,601) of consumers was the ‘other’.
4.3.3 Demographics
The demographic characteristics of consumers accessing open employment services in 2007-08 include information on their gender, age, Indigenous status, country of birth, the state and geographical location of their area of usual residence, living arrangements and accommodation setting.
Gender
Consistent with previous years, males were much more likely than females to access open employment services in 2007-08, 61.1% (44,828) compared with 38.9% (28,597).
Age
Figure 4.16 shows the age distribution of the open employment services population. In 2007-08, younger consumers were most likely to access open employment services. Just over half (47.0% or 34,533) of all consumers were aged under 35 years, of whom 25.7% (18,846) were aged 14-24 years and 21.4% (15,687) aged 25-34 years. Service usage then declined steadily among consumers aged 35-54 years, with 20.8% (15,287) aged 35-44 years and 20.3% (14,893) aged 45-54 years. Consumers aged 55 years and older were considerably less likely than their younger counterparts to access open employment services, with 11.5% (8,467) aged 55-64 years and 0.3% (245) aged 65 years and older. The median age of the open employment services population was 36 years.
Figure 4.16: All open employment service consumers, by age group, 2007-08
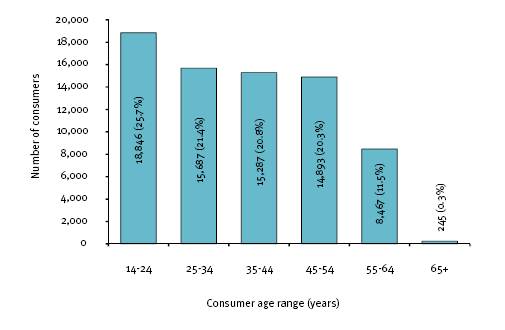
Indigenous status
In 2007-08, open employment services assisted a total of 2,906 Indigenous consumers. Notably, the representation of Indigenous consumers in the open employment services population was 4.0%.
Country of birth
Figure 4.17 shows the open employment services population by country of birth category.
Figure 4.17: All open employment service consumers, by country of birth category, 2007-08
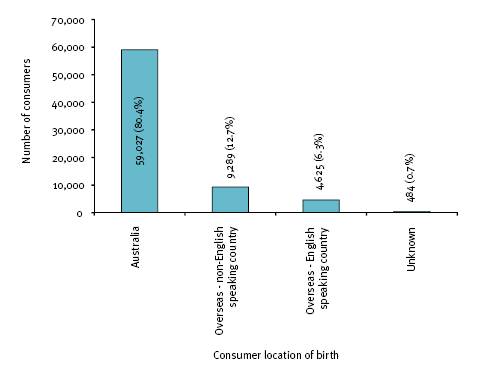
In 2007-08, 80.4% (59,027) of open employment service consumers were born in Australia. A total of 13,914 (18.9%) open employment consumers were born overseas, of whom 12.7% (9,289) were born in non-English speaking countries and 6.3% (4,625) in English speaking countries. Country of birth data was ‘unknown’ for 0.7% (484) of consumers.
Among the 9,289 open employment service consumers born in non-English speaking countries, 78 consumers needed interpreter assistance. As a group, they accounted for 0.8% of all non-English speaking born open employment service consumers and 0.1% of all open employment service consumers.
Table 4.8 shows the most common overseas countries of birth in the open employment services population. Of the 13,914 open employment service consumers born overseas, the most common countries of birth were England, New Zealand, Vietnam, Lebanon and China (excluding the Special Administrative Region’s and Taiwan).
State or territory of usual residence
Consistent with the general Australian population, the states with the largest open employment service populations in 2007-08 were New South Wales (30.8% or 22,645), Victoria (27.2% or 19,972) and Queensland (21.5% or 15,772) (ABS 2007b). Together, they accounted for 79.5% (58,389) of all open employment service consumers. A further 8.1% (5,979) of consumers were living in Western Australia and 7.8% (5,732) in South Australia. Of the balance, 2.4% (1,773) of consumers were living in Tasmania, 1.3% (960) in the Australian Capital Territory and 0.7% (508) in the Northern Territory. Figure 4.18 shows the state and territory distribution of the open employment services population.
Figure 4.18: All open employment service consumers, by state or territory of usual residence, 2007-08
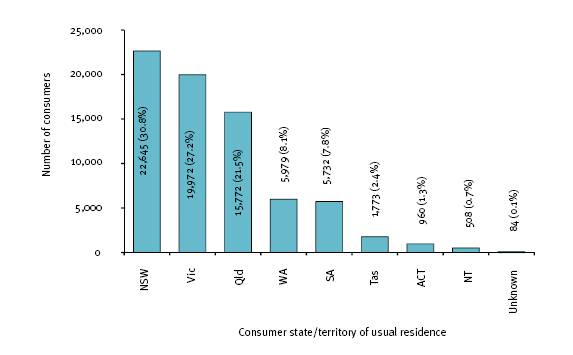
Geographic location of usual residence
Major cities were home to the largest percentage of open employment service consumers in 2007-08, accounting for 63.9% (46,937) of all consumers. A further 34.2% (25,077) of consumers were living in regional areas, with 23.4% (17,208) in inner regional areas and 10.7% (7,869) in outer regional areas. Consumers living in remote and very remote areas accounted for 1.6% (1,203) of all consumers. Table 4.9 shows the distribution of the open employment services population by geographic location of usual residence.
Living arrangements and accommodation setting
In 2007-08, open employment service consumers were most likely to be living in a residence with multiple people (60.3% or 44,289) as opposed to living alone (22.3% or 16,402). Of those living with other people, 44.5% (32,707) were living with family, while 15.8% (11,582) were living with other people. Living arrangements data was not stated for 17.3% (12,734) of consumers.
The accommodation setting of open employment service consumers is shown in Table 4.10. In 2007-08, open employment service consumers were more likely to be living in a private residence than in any other setting, accounting for 95.0% (69,753) of all consumers. A further 4.1% (3,015), accommodation setting was unknown. A very small number of consumers were living in other types of accommodation, (0.9% or 657) e.g. supported, boarding house/private hotel and other accommodation.
4.3.4 Disability profile
The disability profile of consumers accessing open employment services in 2007-08 includes information on their primary disability, the presence of any other significant disability, severity of disability, and need for assistance in nine main life areas.
Primary disability
The primary disability profile of open employment service consumers is diverse as shown in Figure 4.19. In 2007- 08, consumers with a psychiatric disability were the largest group accessing open employment services, some 31.7% (23,243).
Consumers with a physical and intellectual disability were the second and third largest groups, accounting for 26.3% (19,334) and 16.0% (11,752) respectively of all open employment service consumers. Together, consumers with a psychiatric, physical and intellectual disability accounted for 74.0% (54,329) of all open employment service consumers.
Of the remaining 19,096 (26.0%) open employment service consumers:
- 9.4% (6,904) had a specific learning disability/ADD;
- 3.6% (2,620) had a hearing disability, 2.8% (2,070) a vision disability and 32 were deafblind;
- neurological disability (3.4%), autism (3.5%) or an acquired brain injury (2.8%) each accounted for around 2,000 consumers;
- only 322 (0.4%) had a speech disability; and
- the primary disability was unknown for five consumers.
Figure 4.19: All open employment service consumers, by primary disability type, 2007-08
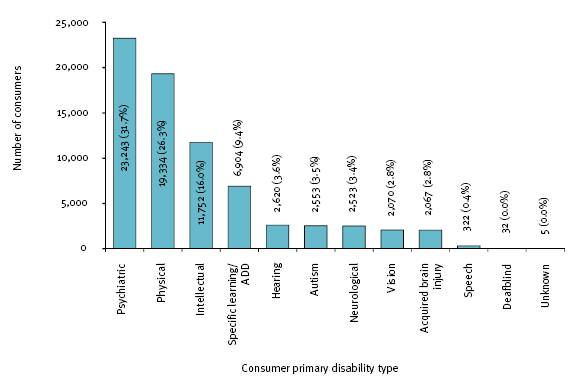
Other significant disability
In 2007-08, a total of 33,883 (46.1%) open employment service consumers had multiple or other significant disabilities. Among this group, they were more likely to have a psychiatric or physical disability than any other significant disability type, accounting for 26.3% (8,901) and 26.2% (8,879) respectively of all open employment service consumers with other significant disabilities. The third most common other significant disability type was specific learning disability/ADD, accounting for 15.3% (5,177) of all open employment service consumers with other significant disabilities. Figure 4.20 provides information on open employment service consumers with other significant disabilities.
Figure 4.20: All open employment service consumers with an other significant disability, by other significant disability type, 2007-08
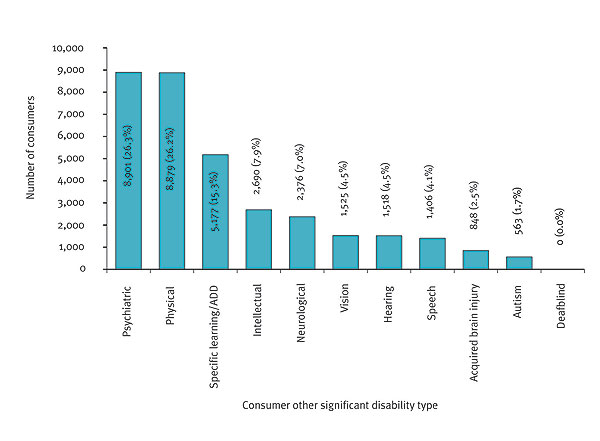
Severity of disability
As shown in Figure 4.21, the majority of consumers accessing open employment services in 2007-08 had a moderate to no core activity limitation, some 80.9% (59,403). In total, 14.5% (10,630) of consumers had a profound or severe core activity limitation, of whom 1.2% (908) had a profound core activity limitation and 13.2% (9,722) had a severe core activity limitation. Severity of disability data was not stated for 4.6% (3,392) of consumers.
Figure 4.21: All open employment service consumers, by severity of disability, 2007-08
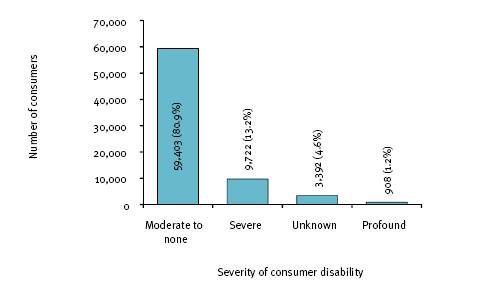
There were also clear and significant differences in the severity of disability of open employment service consumers by primary disability type in 2007-08. This is shown in Figure 4.22. For instance:
- Open employment service consumers with a deafblind disability required the highest level of support with a core activity (32 or 78.1%). This is well above the national average of 14.5%.
- Other open employment service consumers whose profound/severe primary disability is above the national average include: intellectual disability (25.9%), hearing disability (25.5%), autism (24.8%), vision (19.1%), and acquired brain injury (18.1%),
- Open employment service consumers whose primary disability is neurological, physical, speech, psychiatric, or specific learning, and who had a profound or severe core activity limitation lower than the national average, accounted for shares of 8% to 14% of the total.
Figure 4.22: All open employment service consumers with a profound or severe core activity limitation, by primary disability type, 2007-08
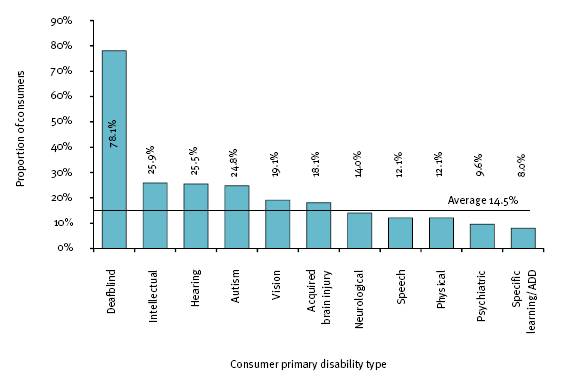
Need for assistance
As a group, open employment service consumers needed substantial support across the majority of the main life areas in 2007-08. Table 4.11 provides information on the levels of support needed in each main life area, and Figure 4.23 shows the percentage of these consumers who always or sometimes needed support in each main life area.
The main life areas in which open employment service consumers were most likely to need support are community (civic) and economic life, interpersonal interactions and relationships, and learning and applying knowledge. The corresponding percentage and number of consumers who always or sometimes needed support in these life areas are 61.8% (45,393), 55.5% (40,780) and 55.0% (40,378).
Importantly, when the ‘unknown’ category in these main life areas is excluded from the overall count, the percentage of open employment service consumers who always or sometimes needed support in these life areas is 64.8% for community (civic) and economic life, 58.2% for interpersonal interactions and relationships, 57.7% for learning and applying knowledge, and 48.0% for working.
For the main life area of community (civic) and economic life (which is strongly related to the need for support in the main life areas of learning and applying knowledge, interpersonal interactions and relationships, and communication) 61.8% or 45,393 consumers always or sometimes needed support. This percentage rises to 64.8% when the ‘unknown’ category is excluded from the overall count.
These limitations together mean that open employment service consumers needed substantial support with social engagement in the community, as well as with understanding new ideas, coping with feelings or emotions, making sound decisions, remembering and undertaking daily tasks. These limitations, in turn, impact upon their ability to undertake actions and behaviours needed to obtain and retain employment. Some 55.5% (40,780) of consumers always or sometimes needed support in the main life area of interpersonal interactions and relationships. This percentage rises to 58.2% when the ‘unknown’ category is excluded from the overall count.
Figure 4.23: All open employment service consumers who always or sometimes needed support, by main life area, 2007-08
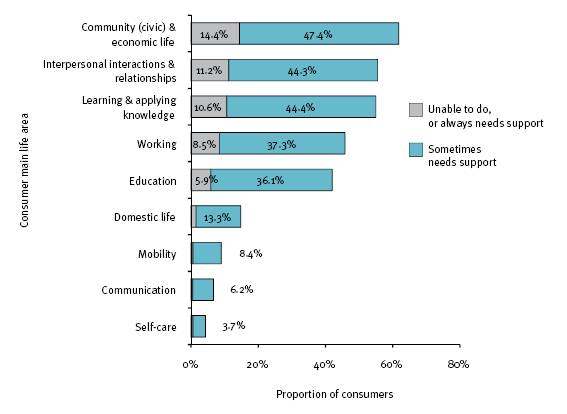
Open employment service consumers, on the other hand, were least likely to need support in the home environment, including attending to their self-care needs and walking and moving about. Moreover, the vast majority of consumers needed no support with the main life areas of self-care, mobility, and domestic life, with 91.0% (66,811), 86.4% (63,414) and 80.5% (59,110) respectively. These percentages rise to 95.4%, 90.6% and 84.5% respectively when the ‘not stated’ category is excluded from the overall count.
4.3.5 Informal carer arrangements
In 2007-08, a total of 5,888 open employment service consumers had an informal carer. As a group, they accounted for 8.0% of all open employment service consumers. The relationship of the informal carer to the open employment service consumer for whom they care is shown in Figure 4.24. Of the 5,888 open employment service consumers with an informal carer, the majority were being cared for by a parent, some 59.9% (3,524). A further 22.9% (1,350) were being assisted by other relatives, while 17.2% (1,014) of consumers had a spouse/ partner caring for them.
Figure 4.24: All open employment service consumers, by relationship of informal carer to consumer, 2007-08
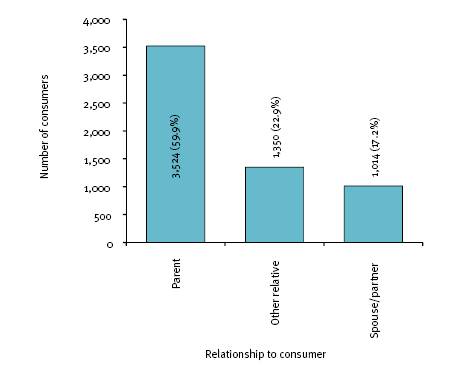
4.3.6 Income
The main source of income is known for 80.4% (59,038) of consumers accessing open employment services in 2007-08. A government pension or allowance was the main source of income for just under three quarters (73.8% or 54,198) of consumers, with 38.2% (28,041) receiving a disability support pension and 35.6% (26,157) some other pension or allowance. Paid employment was the main source of income for 4.1% (3,020) of consumers. A further 2.1% (1,577) of consumers were receiving income from other sources such as compensation and superannuation. Less than 1.0% (22) of consumers had no income. Figure 4.25 shows the breakdown of the main source of income for open employment service consumers.
Figure 4.25: All open employment service consumers, by main source of income, 2007-08
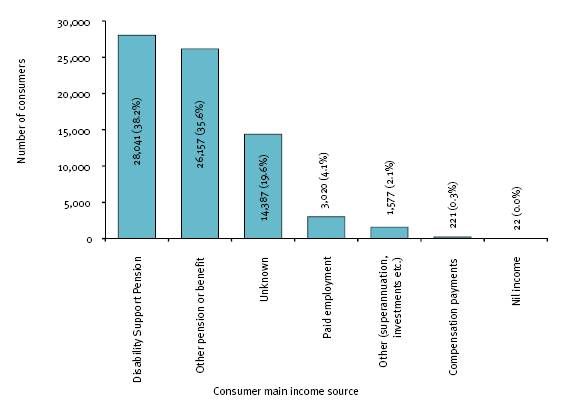
4.3.7 Employment outcomes
‘Employment outcomes’ refers to those consumers in open employment services who were employed for some or all of the time during 2007-08. Of the 73,425 consumers who accessed open employment services in 2007-08, a total of 36,857 consumers attained an employment outcome. As a group, they accounted for 50.2% of all open employment service consumers.
Equity groups
In 2007-08, the employment outcomes of consumers accessing open employment services varied by equity group, as shown in Figure 4.26. For instance:
- Female consumers represented 38.9% of all open employment consumers, and attained a marginally lower employment outcome than their male counterparts (47.3% compared with 52.1%). Women, however, remain significantly under-represented in open employment services
- Indigenous consumers represented 4.0% of all open employment consumers, and faced significant challenges in obtaining employment. As a group, 38.5% attained an employment outcome, which is considerably lower than the national average of 50.2% for all disability open employment consumers.
- Consumers born in non-English speaking countries faced significant challenges in obtaining employment. Non-English speaking consumers represented 12.7% of all open employment consumers. As a group, 31.7% attained an employment outcome, some 28.8 percentage points below the national average for all disability employment services consumers.
- Consumers living in regional and remote areas represented 23.5% of all open employment consumers, and attained an employment outcome similar to their counterparts in major cities, 51.3% and 49.6% respectively.
Figure 4.26: All open employment service consumers, by equity group and employment outcome, 2007-08
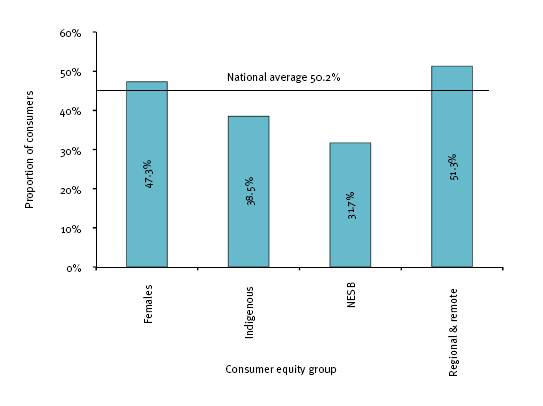
Age
Figure 4.27 shows the employment outcomes for open employment service consumers by age in 2007-08.
Figure 4.27: All open employment service consumers, by age and employment outcome, 2007-08
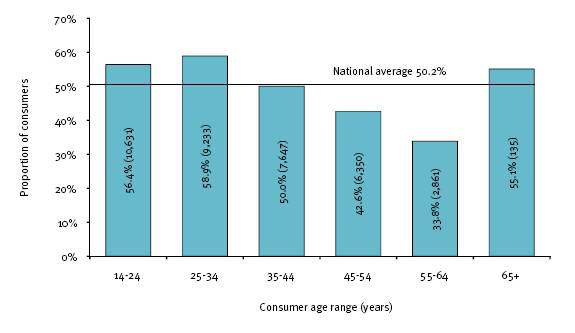
With the exception of open employment services consumers aged 65 years and older, employment outcomes declined with age following the 25-34 year old group. This decline is particularly discernible among consumers aged 55-64 years.
Primary disability type
In the open employment services population, the employment outcomes of consumers in 2007-08 varied significantly by primary disability type as shown in Table 4.12.
Notably, open employment service consumers with an intellectual disability attained the highest employment outcomes at 72.8%. This is well above the national average of 50.2%. Consumers with a deafblind disability attained the second highest employment outcome, with 65.6% in employment. Consumers with a hearing, speech, specific learning disability/ADD, autism, acquired brain injury, vision, and neurological disability had higher employment outcomes than the national average.
By contrast, open employment service consumers with a physical disability and those with a psychiatric disability faced the greatest challenges in obtaining employment. The employment outcome attained by consumers with a physical disability was 35.6%, some 14.6 percentage points lower than the national average. The employment outcome attained by consumers with a psychiatric disability was slightly higher at 44.0%.
The lower employment outcome among open employment service consumers with a physical disability is related to their older age profile and the discernible lower levels of employment among older consumers generally.
While these figures reflect overall performance for the different disability groupings, each category covers a broad group of participants with varied support needs.
Severity of disability
In 2007-08, the highest employment outcome was attained by open employment service consumers with a profound activity limitation at 60.6%. As a group, they were more likely to be employed than consumers with a moderate to none activity limitation, with a gap of almost 7.3 percentage points, and 14.7 percentage points for those consumers who had a severe activity limitation.
[ Return to Top Return to Section ]
4.4 Supported employment services population
4.4.1 What are supported employment services
Supported employment services have a unique and dual role as both employers and providers of government funded employment support. The core business of supported employment services is helping people with disability to take part in quality, appropriately paid employment, develop their capabilities and promote their participation in community life.
The target group for supported employment services is people with disability who are unlikely to be able to work in the open labour market at or above the Australian Fair Pay Commission minimum wage, and who need ongoing support for a substantial period to obtain and retain paid employment.
Supported employment services are commercial enterprises enabling people with disability to engage in a wide variety of work tasks such as packaging, assembly, production, recycling, garden maintenance and landscaping, plant nursery, laundry services, cleaning services, catering services and screen printing. People working in supported employment services enjoy working conditions comparable to those in the general Australian workforce. This includes the payment of pro rata wages in accordance with their productive capacity.
4.4.2 Number of consumers assisted
All consumers
In 2007-08, a total of 22,167 consumers were assisted by supported employment services nationally. This is an increase of 174 (0.8%) supported employment service consumers on 2006-07, up from 21,993.
Consumers ‘on the books’
On Census Day at 30 June 2008, there were 19,522 consumers ‘on the books’ in supported employment services. This is an increase of 1009 (5.5%) supported employment service consumers on 2006-07, up from 18,513.
New starters and leavers
During 2007-08, 3,757 consumers commenced in supported employment services and 2,645 (11.9%) consumers transferred to another supported employment service outlet or left the supported employment sector altogether. Table 4.13 shows the main reason consumers left their supported employment service.
The main reasons for leaving supported employment services were ‘consumer terminated service’ (29.6% or 784), and ‘consumer no longer needs assistance’ (21.4% or 566). The other main reasons for leaving included ‘consumer needs have increased’ (9.0% or 239) and ‘consumer moved out of area’ (7.5% or 198). Together, these four main reasons accounted for 67.6% (1,787) of all reasons consumers left their supported employment service. The main reason for leaving was inconclusive for 29.9% (792) of consumers as the service provider recorded ‘other’ as the main reason.
4.4.3 Demographics
The demographic characteristics of consumers accessing supported employment services in 2007-08 include information on their gender, age, Indigenous status, country of birth, the state and geographical location of their usual residence, living arrangements and accommodation setting.
Gender
Consistent with previous years, more males than females accessed supported employment assistance in 2007- 08, 64.2% (14,240) compared with 35.8% (7,927).
Age
Figure 4.28 shows the age distribution of the supported employment services population in 2007-08.
Figure 4.28: All supported employment service consumers, by age group, 2007-08
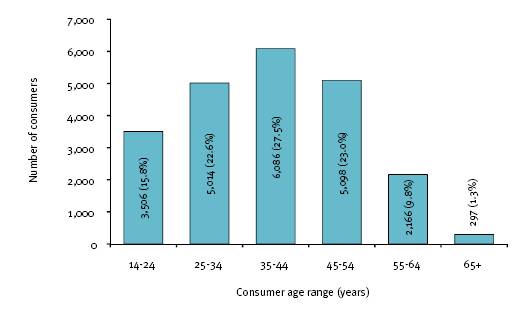
Supported employment service consumers were most likely to be aged 35-44 years, some 27.5% (6,086). A further 38.4% (8,520) of consumers were younger than this and around a third (7,561) older.
For those supported employment service consumers under the age of 35 years, 22.6% (5,014) of all consumers were aged 25-34 years and 15.8% (3,506) aged 14-24 years.
Of the supported employment service consumers aged 45 years and older, 23.0% (5,098) of all consumers were aged 45-54, 9.8% (2,166) aged 55-64 and 1.3% (297) aged 65 years and older. The median age of the supported employment services population was 39 years.
Indigenous status
In 2007-08, a total of 512 Indigenous consumers were assisted by supported employment services. The Indigenous status of consumers was unknown for 0.8% (169) of consumers. The representation of Indigenous consumers in the supported employment services population was 2.3%.
Country of birth
In 2007-08, the overwhelming majority of supported employment service consumers were born in Australia, some 20,487 (92.4%). A total of 1,270 (5.7%) consumers were born overseas, of whom 771 (3.5%) were born in non-English speaking countries and 499 (2.3%) in English speaking countries. Country of birth data was not stated for 1.8% (410) of consumers.
Table 4.14 illustrates the number of consumers by location of birth (Australia/overseas), while Table 4.14 illustrates the country of birth of overseas consumers.
Among the 771 supported employment service consumers born in non-English speaking countries, 133 consumers needed interpreter assistance. As a group, they accounted for 17.3% of all non-English speaking born supported employment service consumers and 0.6% of all supported employment service consumers.
Of the 1,270 supported employment service consumers born overseas, the most common countries of birth were England, New Zealand, Vietnam, Italy, and then Philippines. They accounted for 241 (19.0%), 173 (13.6%), 78 (6.1%), 72 (5.7%) and 58 (4.6%) respectively of all supported employment service consumers born overseas.
State or territory of usual residence
The state and territory distribution of the supported employment services population in 2007-08 is shown in Figure 4.29. The state with the largest supported employment services population was New South Wales, accounting for 38.1% (8,439) of all consumers. A further 22.2% (4,918) of consumers were living in Victoria, 13.5% (3,001) in South Australia, 11.0% (2,440) in Queensland, and 10.6% (2,340) in Western Australia. Of the balance, 2.8% (612) of consumers were living in Tasmania, 1.2% (261) in the Australian Capital Territory and 0.6% (128) in the Northern Territory. In addition, the residential state of 28 consumers was unknown.
Figure 4.29: All supported employment service consumers, by state or territory of usual residence, 2007-08
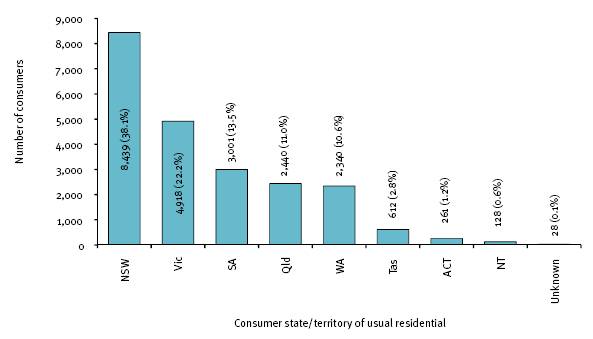
Geographic location of usual residence
Major cities were home to the largest percentage of supported employment service consumers in 2007-08, accounting for 67.1% (14,878) of all consumers. A further 31.4% (6,964) of consumers were living in regional areas, with 22.8% (5,055) in inner regional areas and 8.6% (1,909) in outer regional areas. Of the remaining 325 (1.5%) consumers, 178 (0.8%) were living in remote and very remote areas, while the usual residential region for 147 (0.7%) open employment consumers was ‘unknown’. The distribution of the supported employment services population by geographic location of usual residence is shown in Table 4.16.
Living arrangements and accommodation setting
The living arrangements of supported employment service consumers in 2007-08 are shown in Table 4.17.
The majority of supported employment service consumers were living with family, some 56.0% (12,409). A further 25.3% (5,611) of consumers were living with others and 16.3% (3,612) living alone. Living arrangements data was not stated for 2.4% (535) of consumers.
Further, supported employment service consumers were more likely to be living in a private residence than any other setting in 2007-08, accounting for 63.2% (14,003) of all consumers. The living arrangements for 27.0% (5,955) of consumers is unknown. Table 4.18 shows the accommodation setting of supported employment service consumers, and Figure 4.30 shows the supported accommodation type for this consumer group.
Figure 4.30: All supported employment service consumers that are in supported accommodation, by supported accommodation setting, 2007-08
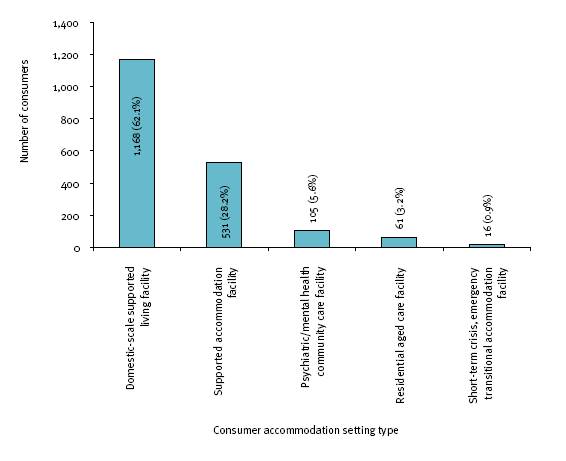
4.4.4 Disability profile
The disability profile of consumers accessing supported employment services in 2007-08 includes information on their primary disability, the presence of any other significant disability, severity of disability, method of communication, need for assistance in nine main life areas and transport needs.
Primary disability
Figure 4.31 shows the primary disability of supported employment service consumers in 2007-08.
Figure 4.31: All supported employment service consumers, by primary disability type, 2007-08
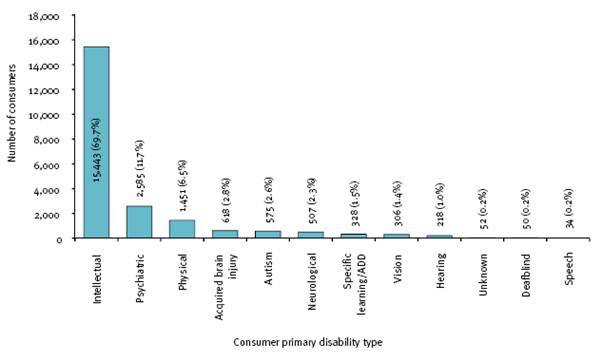
Consumers with an intellectual disability were the largest group accessing supported employment services, some 69.7% (15,443). Supported employment service consumers with a psychiatric and physical disability were the second and third largest groups, accounting for 11.7% (2,585) and 6.5% (1,451) respectively. Together, consumers with an intellectual, psychiatric or physical disability accounted for 87.9% (19,479) of all supported employment consumers.
Of the remaining 2,688 (12.1%) supported employment service consumers:
- 2.8% (618) had an acquired brain injury;
- 2.6% (574) had a sensory disability, of whom 306 had a vision disability, 218 a hearing disability and 50 were deafblind;
- 2.6% (575) had autism;
- 2.3% (507) had a neurological disability;
- 1.5% (328) had a specific learning disability/ADD;
- 0.2% (34) had a speech disability; and
- 0.2% (52) had an unknown primary disability.
Other significant disability
Figure 4.32 provides information on the supported employment service consumers with other significant disabilities.
Figure 4.32: All supported employment service consumers with another significant disability, by other significant disability type, 2007-08
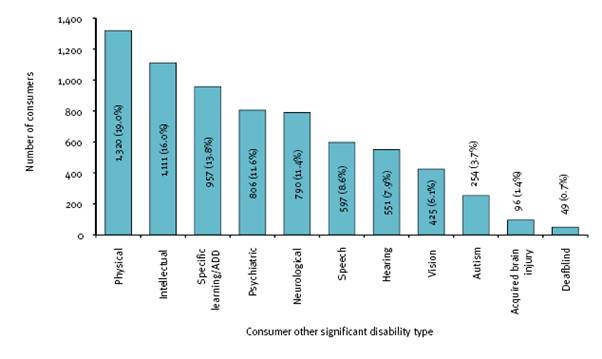
In 2007-08, consumers accessing supported employment services had on average 1.3 disabilities. In other words, some 6,956 (31.4%) supported employment service consumers had multiple or other significant disabilities. Among this group, consumers were much more likely to have a physical disability than any other significant disability type, some 19.0% (1,320). The next most common other significant disability type was intellectual disability, accounting for 16.0% (1,111) of all consumers with other significant disabilities. The third and fourth most common other significant disability types were specific learning disability/ADD and psychiatric disability. They accounted for 13.8% (957) and 11.6% (806) respectively of all consumers with other significant disabilities.
When ‘primary’ and ‘other’ disability types are combined intellectual disability accounted for 56.8% (16,554) of all disabilities. This was almost five times higher than the next disability type, psychiatric (11.6% or 3,391).
The five combined most common disability types accounted for 86.9% (25,298) of all disabilities - intellectual, psychiatric, physical, neurological and specific learning/ADD.
Severity of disability
The severity of disability among supported employment service consumers is shown in Figure 4.33. In 2007- 08, some 24.0% (5,322) of consumers had a profound core activity limitation. Those with a severe core activity limitation accounted for some 47.8% (10,590) of all consumers. Together, 71.8% (15,912) of consumers had a profound or severe core activity limitation. A further 18.7% (4,156) of consumers had a moderate to no core activity limitation. Severity of disability data was unknown for 9.5% (2,099) of consumers.
Figure 4.33: All supported employment service consumers, by severity of disability, 2007-08
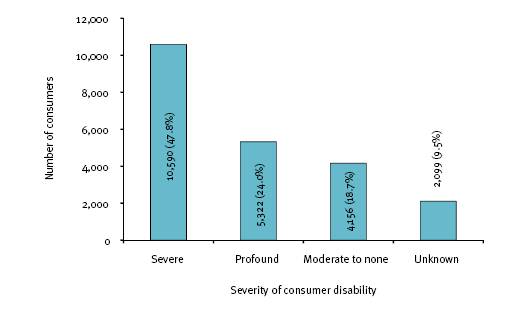
There are also clear and significant differences in the severity of disability of supported employment service consumers by primary disability type. These differences are shown in Figure 4.34.
Figure 4.34: All supported employment service consumers with a profound or severe core activity limitation, by primary disability type, 2007-08
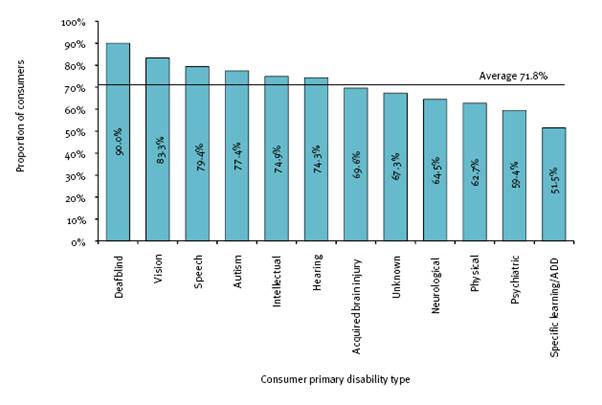
Figure 4.34 shows that:
- Supported employment service consumers with a deafblind disability needed the highest level of support with a core activity. Some 90.0% of these consumers had a profound or severe core activity limitation, which is considerably higher than the national average of 71.8`%.
- Supported employment service consumers with a vision disability, speech disability, autism, intellectual disability and hearing disability were somewhat more likely than the national average to have a profound or severe core activity limitation – their respective disability rates were 83.3%, 79.4%, 77.4%, 74.9% and 74.3%.
While over half (51.5%) of the supported employment service consumers with a specific learning/ADD disability had a profound or severe core activity limitation, the level of support they needed was the lowest across the primary disability consumer groups.
Method of communication
In 2007-08, the overwhelming majority of supported employment service consumers had effective spoken communication, some 71.3% (15,798). A further 1.9% (411) of consumers were able to communicate effectively using non-spoken communication methods such as sign language. Notably, nearly 6.7% (1,486) of consumers had no effective way of communicating with others. Method of communication data was not stated for 20.2% (4,472) of consumers.
Need for assistance
As a group, supported employment service consumers needed considerable support across all main life areas in 2007-08. Table 4.19 provides information on all levels of support needed by supported employment service consumers in each main life area, and Figure 4.35 shows the percentage of supported employment service consumers who always or sometimes needed support in each main life area.
Figure 4.35: All supported employment service consumers who always or sometimes needed support, by main life area, 2007-08
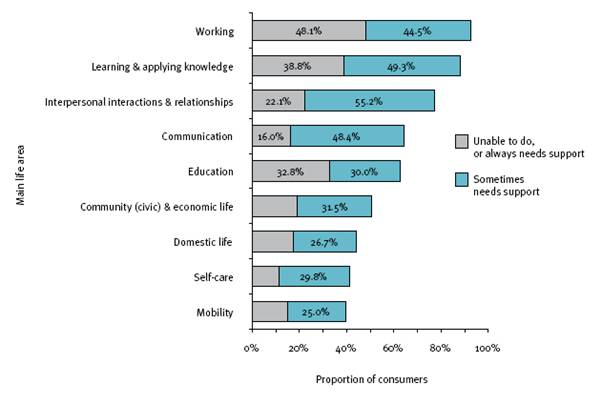
With the main life area of working, nearly all supported employment service consumers always or sometimes needed support with undertaking actions and behaviours needed to obtain and retain employment, some 92.6% (20,523). Support required for life area of working was unknown for 5.3% (1,184) of consumers.
A high percentage of supported employment service consumers always or sometimes needed support with learning and applying knowledge, some 88.1% (19,550). Learning and applying knowledge data was unknown for 7.3% (1,626) of consumers. Similarly, even though interpersonal interactions and relationships data was not stated for 12.7% (2,823) of consumers, some 77.3% (17,150) always or sometimes needed support in this area.
Over three in every five (14,292) supported employment service consumers always or sometimes needed support with communication, that is with understanding or being understood. Some 16.0% (3,553) of consumers always needed support in this area. Communication data was unknown for 11.3% (2,500) of consumers. Further, 62.8% (13,914) of supported employment service consumers sometimes or always required assistance with education, however, 30.7% (6,806) of education data was unknown.
The percentage of supported employment service consumers always or sometimes needed support to participate in community (civic) and economic life, and domestic life is considerably understated due to the high percentage in the ‘unknown’ category – the estimated percentages were 37.9% and 45.7% respectively. When the ‘unknown’ category is excluded from the overall count, 81.6% of consumers always or sometimes needed support to participate in community (civic) and economic life and 81.5% always or sometimes needed support undertaking domestic activities in the home.
While most (31.8% or 7,042) supported employment service consumers who needed no support with self-care, there were 41.1% (9,095) who always or sometimes needed support in this area. Self-care data was unknown for 27.2% (6,030) of consumers.
While the majority (42.3% or 9,370) of supported employment service consumers needed no support with walking and moving about, there were 39.8% (8,811) who always or sometimes needed support in this area. Notably, 14.8% (3,280) of consumers always needed support in this area. Mobility data was unknown for 18.0% (3,986) of consumers.
Transport needs
In 2007-08, supported employment service consumers used a range of transport options to get to their place of work. The most common means of transportation involved a motor vehicle (40.8%), with 25.1% (5,554) travelling by private car and 15.7% (3,473) using outlet organised transport.
The next most common source of transport involved public transport with 35.9% (7,956) supported employment service consumers. The percentage of consumers walking, cycling or using a wheelchair to their place of work was 8.8% (1,944). Some 7.0% (1,548) relied on taxis. Mode of transport data was not stated for 7.6% (1,692) of consumers. The mode of transport used by supported employment service consumers to get to their place of work is shown in Figure 4.36.
Figure 4.36: All supported employment service consumers, by mode of transport used to get to their place of work, 2007-08
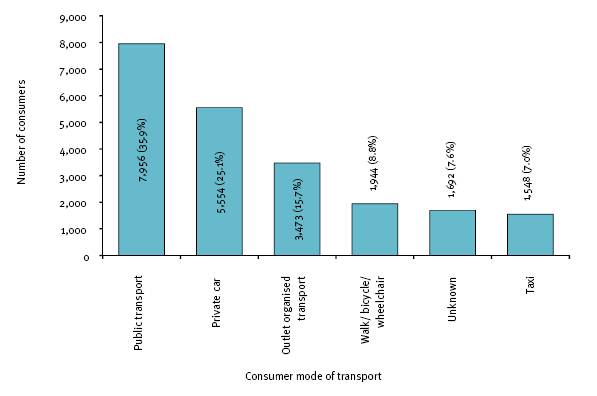
As shown in Figure 4.37, the mode of transport used by supported employment service consumers to get to their place of work varied between different geographic locations in 2007-08. For instance:
- Supported employment service consumers in major cities were much more likely than their counterparts outside major cities to use public transport to travel to work. Moreover, nearly half of the consumers in major cities used public transport, compared with 15.8% in inner regional areas, 11.0% in outer regional areas and 4.5% in remote areas. The data point to a clear gradation of decreasing use of public transport from major cities to rural areas.
- Supported employment service consumers in regional areas were the highest users of outlet organised transport to get to work, around 52.0%. Notably, they were almost five times as likely as their counterparts in major cities to rely on this form of transport.
- Supported employment service consumers in remote areas were considerably more likely than their counterparts in major cities to travel to work in a private car and were much more likely than their counterparts in major cities and regional areas to walk, cycle or use a wheelchair to their place of work. Some 53.4% of remote consumers relied on private car, walking, bicycle or wheelchair. This compares with 28.4% of consumers in major cities, 43.9% in inner regional areas and 47.4% in outer regional areas.
Figure 4.37: All supported employment service consumers, by geographic location of usual residence and mode of transport used to get to their place of work, 2007-08
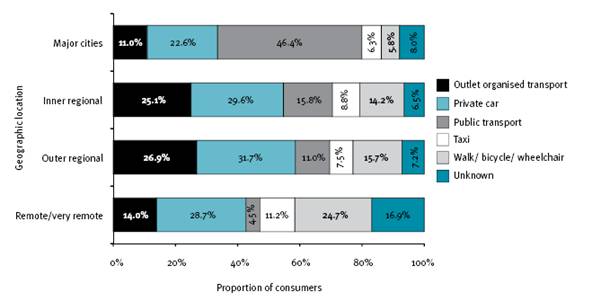
Note: The above chart excludes 824 consumers with a missing value.
4.4.5 Informal carer arrangements
In supported employment services, the presence of an informal carer is known for 17,832 (80.4%) of the 22,167 consumers assisted in 2007-08. Notably, supported employment service consumers were more likely to have an informal carer than not, 9,973 (45.0%) compared with 7,859 (35.5%).
Of the 9,973 supported employment service consumers with an informal carer, the vast majority were being cared for by a parent, some 71.1% (7,095). For a small percentage (5.4%) of consumers, the spouse/partner was providing the care. A further 11.6% (1,153) of consumers were being assisted by other relatives and 2.6% (264) by a friend or neighbour. Relationship of informal carer to consumer data was not stated for 9.2% (922) of consumers. The relationship of the informal carer to the supported employment service consumer for whom they care is shown in Figure 4.38.
Figure 4.38: All supported employment service consumers, by relationship of informal carer to consumer, 2007-08
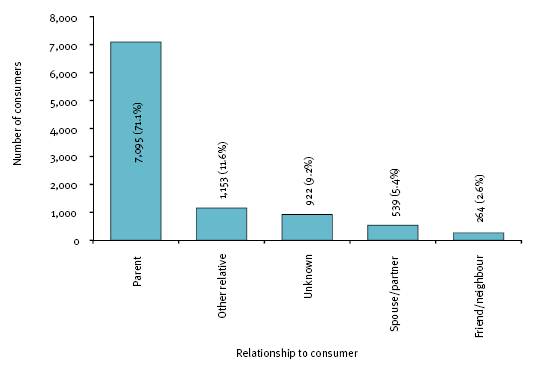
4.4.6 Income
The main source of income is known for 99.3% (22,004) of supported employment service consumers in 2007- 08. A disability support pension was the main source of income for the overwhelming majority of consumers, some 97.6% (21,645). Less than 1.1% (233) of consumers were receiving other pensions or allowances. Paid employment was the main source of income for 0.4% (89) of consumers. The remaining consumers were receiving compensation (26) and other income (10), while one consumer had no income.
4.4.7 Employment outcomes
‘Employment outcomes’ refers to those consumers in supported employment services who were employed for some or all of the time during 2007-08. Of the 22,167 consumers who accessed supported employment services in 2007-08, a total of 20,995 attained an employment outcome. As a group, they accounted for 94.7% of all supported employment service consumers.
Of the remaining supported employment consumers, 495 (2.2%) were not employed, while the employment status of 677 (3.1%) was unknown.
Equity groups
In 2007-08, the employment outcomes of supported employment service consumers varied by equity group. For instance:
- Female consumers represented 35.8% of all consumers, and attained an employment outcome equal to their male counterparts, around 94.6%.
- Indigenous consumers represented 2.3% of all supported employment consumers, and attained an employment outcome slightly lower than the national average (91.0% compared with 94.7%).
- Consumers from non-English speaking backgrounds represented 3.5% of all consumers, and attained a marginally higher employment outcome than the national average (95.1% compared with 94.7%).
- Consumers living in regional and remote areas who represented approximately one third of all consumers attained an employment outcome marginally lower than their major city counterparts (93.5% compared with 95.3%).
Age
The employment outcomes of supported employment service consumers by age is shown in Figure 4.39.
Figure 4.39: All supported employment service consumers, by age and employment outcome, 2007-08
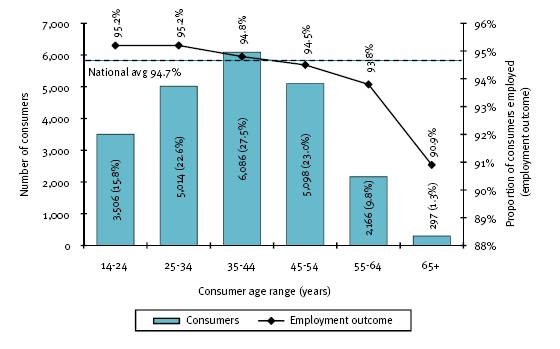
The differences in the employment outcomes across the age groups were minimal with a difference of only 4.3 percentage points overall. The highest employment outcome was attained by younger consumers aged 14-24 and 25-34 (95.2%), while the lowest by consumers aged 65+ years (90.9%).
Primary disability type
The employment outcomes of supported employment service consumers by primary disability type in 2007-08 are shown in Figure 4.40. Notably, consumers who were deafblind attained the highest employment outcome (98.0%) and the lowest was attained by consumers with a psychiatric disability (92.1%).
Figure 4.40: All supported employment service consumers, by primary disability type and employment outcome, 2007-08
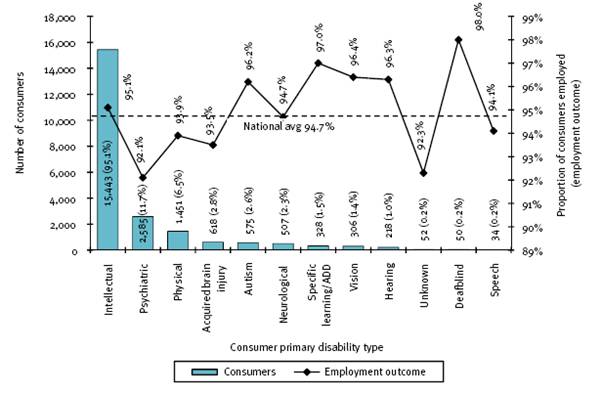
Severity of disability
In 2007-08, the lowest employment outcome was attained by supported employment service consumers with a moderate to no activity limitation (97.0%). Their employment outcome was slightly lower than the national average of 94.7%. There was barely any difference in the employment outcomes between consumers with a severe core activity limitation (98.2%) and consumers with a profound core activity limitation (97.9%).
4.4.8 Employment characteristics
Data on the employment characteristics of supported employment service consumers is collected on a ‘snapshot’ or ‘on the books’ basis. This information is based on the 19,522 consumers ‘on the books’ at 30 June 2008 who have a status of ‘worker’ or ‘independent worker’. The employment characteristics’ information includes the consumer’s employment phase, basis of employment, hours of employment and wages.
Employment phase
The employment phase or status of supported employment service consumers is based on the following classification:
- Worker – a consumer who has been offered a contract of employment and has accepted that contract with a supported employment service;
- Work experience – a consumer who is undertaking paid or unpaid work experience or work trial in a supported employment service;
- Job seeker – a consumer who receives support from a supported employment service to prepare them for employment and/or to help place them in employment;
- Independent worker – a consumer whom the supported employment service assisted to obtain employment during 2006-07, who then continues to work but received no employment assistance from the supported employment service during 2007-08; and
- Other – a consumer who is engaging in non-vocational activities in a supported employment service (FaCS 2005).
Table 4.20 shows the employment phase of consumers accessing supported employment services at 30 June 2009. Nearly all supported employment service consumers were workers, some 18,555 (95.0%). The remaining 664 consumers were engaged in activities such as job search (16), work experience (34) and other activities (614) (e.g. non-vocational activities). Employment phase data was unknown for 1.6% (303) of consumers.
Basis of employment
The basis on which supported employment service consumers are employed indicates the permanency of the position held. The basis of employment is based on the following classification:
- Full-time employment – Full-time employees work the agreed or award hours for a full-time employee in their occupation. If agreed or award hours do not apply, employees are regarded as full-time if they ordinarily work 35 hours or more per week;
- Part-time employment – Part-time employees work fewer hours than full-time employees, and are employed on a permanent or continuing basis. They accrue paid holidays, sick leave and long service leave entitlements on a pro rata basis. Employment of less than 35 hours per week is considered to be part-time;
- Casual employment – Casual employees are not usually entitled to paid holiday or sick leave. They will generally have a higher hourly rate or loading to compensate for the lack of leave and other entitlements. They may be either permanent or temporary employees and have either fixed or irregular hours of work;
- Seasonal employment – Seasonal work is work in a position or industry that experiences a dramatic employment increase or build up for a defined period of time each year, after which the employment ceases or is greatly reduced until the following season;
- Permanent employment – Permanent employees are employed on a continuing basis, and are entitled to paid holiday leave, sick leave and long service leave. There is a qualifying period; and
- Temporary employment – Temporary employees are employed for a short or fixed term and are entitled to paid holiday and sick leave. There is usually a qualifying period (FaCS 2005).
Table 4.21 shows the basis on which supported employment service consumers were employed at 30 June 2008.
Of the 18,555 employed supported employment service consumers, nearly all (99.1% or 18,381) had permanent work, of whom 28.3% (5,251) were working full-time, 67.1% (12,451) part-time and 3.6% (677) on a casual or seasonal basis. Among the 90 consumers who were employed on a temporary basis, 45 were working casually, 21 were working full-time and 22 part-time. Basis of employment data was unknown for 84 consumers.
Hours of employment
The standard hours worked per week by supported employment service consumers refers to the normal working pattern over 2007-08, including overtime if that has been a regular part of work over that period. The standard hours worked is based on five hour range categories: less than 8 hours per week; 8-15 hours per week; 16-30 hours per week; 31-40 hours per week; and over 40 hours per week.
The standard hours worked by supported employment service consumers at 30 June 2008 is shown in Figure 4.37. As a group, they were most likely to work 31-40 hours per week, some 39.3% (7,300). No consumers worked longer than 40 hours per week. Of the 60.7% (11,255) of consumers who worked 30 or fewer hours per week, 38.4% (7,126) worked 16-30 hours and 21.5% (3,983) 8-15 hours, while only 0.8% (146) worked less than eight hours.
Figure 4.41 illustrates supported employment service consumers ‘on the books’ by the standard hours worked in a week, 30 June 2008.
Figure 4.41: Supported employment service consumers ‘on the books’, by standard hours worked per week, 30 June 2008
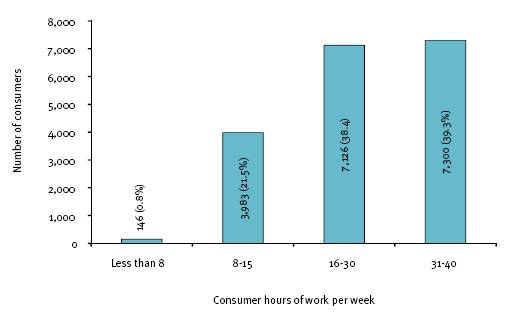
Further, the full-time and part-time status of supported employment service consumers is defined in terms of hours worked. The ABS (2007b) defines full-time workers as persons who usually work 35 or more hours per week and part-time workers as those who usually work less than 35 hours per week. Importantly, the full-time/ part-time classification differs from, and should not be confused with, the basis of employment classification. The full-time/part-time classification is based on hours worked and the basis of employment is based on the permanency of the position held, including leave entitlements.
In the supported employment sector, 29.1% (5,393) of consumers worked full-time hours and 70.9% (13,162) part-time hours as at 30 June 2008. The median hours worked per week by supported employment service consumers was 27 hours, while the mean (average) hours worked per week was 25.6. The mean (average) hours worked per week is lower than the median hours worked per week because it is highly influenced by those consumers who worked fewer than eight hours per week. For this reason, the median provides a more meaningful analysis as it is not affected by extreme data values.
The data indicate that the nature of the disability can have an effect on the number of hours worked. The full-time/ part-time status and average hours worked per week by supported employment service consumers at 30 June 2008 varied by primary disability type, as shown in Table 4.22. For instance:
- Consumers with a speech disability were most likely to work full-time (35.7%), followed by consumers with a hearing disability (35.6%). Conversely, psychiatric consumers are the most likely to work part-time (88.5%), followed by consumers with a deafblind disability (82.2%).
- The median hours worked per week ranged from 18 hours per week by consumers with a psychiatric disability to 30 hours per week by consumers with an intellectual or hearing disability.
- The mean (average) worked per week ranged from 19.7 hours per week by consumers with a psychiatric disability to 27.6 hours per week by consumers with a hearing disability.
Also impacting upon the average weekly hours worked by supported employment service consumers were variations in state and territory supported employment service outlet operations. Table 4.23 points to clear and significant differences in the average weekly hours worked by supported employment service consumers by state at 30 June 2008. Notably, consumers in Queensland, Tasmania and South Australia worked the longest hours on average each week (30), with the same states having the highest proportion of full-time employment (40.2%, 35.9% and 35.4% respectively). By contrast, consumers in the Australian Capital Territory worked the least number of hours on average each week (16), with only 9.8% working full-time.
Wages
The measure of income used in this report relates to weekly gross income from wages earned by consumers in the supported employment sector.
At 30 June 2008, the vast majority of supported employment service consumers were earning $100 or less a week, some 64.1% (11,891). A further 21.7% (4,034) of consumers were earning $101-$200 a week and 6.3% (1,172) were earning over $200 a week. Income was not stated for 1,458 consumers (7.9%).
Across the gross weekly wage categories, supported employment service consumers were most likely to earn $61-$80 (18.7% or 3,472), followed by $41-$60 (17.5% or 3,254), $21-$40 a week (17.1% or 3,171) and $101-$150 (15.1% or 2,807).
Further, the median gross weekly earnings of supported employment service consumers was $70.50 and the mean gross weekly earnings was $93.16 at 30 June 2008. While the median gross weekly earnings is somewhat lower than the mean (average) gross weekly earnings, this difference reflects the typically uneven distribution of wage levels where a small number of supported employment service consumers have relatively high wages and a large number of consumers have lower wages.
The earnings distribution of the supported employment services population is shown in Figure 4.42.
Figure 4.42: Supported employment service consumers ‘on the books’, by gross weekly wage category, 30 June 2008
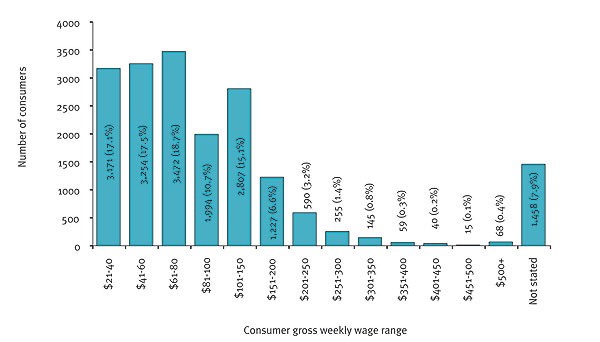
The nature of the disability can have an effect on wage outcomes. Table 4.24 shows that there were clear and significant differences in the gross weekly wages of supported employment service consumers at 30 June 2008 by primary disability type. For instance:
- With the exception of consumers with a vision disability, the majority of all other primary disability consumer groups were earning $100 or less a week. The percentage earning $100 or less a week ranged from 50.6% of consumers with a hearing disability to 67.7% of consumers with autism.
- Consumers with a sensory disability had the highest percentage earning $101-$300 a week, with 40.0% with a hearing disability and 34.2% with a vision disability. This is considerably higher than the national average of 26.3%.
- Additionally, consumers with a vision disability were more than two and a half times as likely as any other primary disability consumer group to earn $300 or more a week (19.3% compared with 7.4% or less).
- The highest median gross weekly wage was earned by consumers with a vision disability ($125.50), followed by those with a hearing and physical disability ($90.50). Consumers with a deafblind disability also had median gross weekly earnings higher than the national average ($80.50, compared with $70.50).
- The lowest median gross weekly wage was earned by consumers with autism, intellectual disability, psychiatric disability, neurological disability, acquired brain injury, speech disability, and specific learning/ ADD ($70.50) - this was equivalent to the national average.
These differences in wage outcomes reflect both the average productivity and number of hours worked by supported employment service consumers with particular disabilities. Accordingly, while consumers with an intellectual disability worked the most hours per week (median of 30), their median gross weekly earnings were equal lowest ($70.50). Similarly, while consumers with a psychiatric disability worked the least median hours per week (median of 18), their median gross weekly earnings in line with the national average ($70.50).
The productivity of supported employment service consumers is measured by their gross hourly rate of pay. The median gross hourly rate of pay of supported employment service consumers was $2.94 and the mean gross weekly earnings was $3.74 at 30 June 2008.
The gross hourly rates of pay of supported employment service consumers by primary disability type at 30 June 2008 are shown in Table 4.25. The data point to consumers with a vision disability having the highest productivity, earning $6.96 on average per hour. The next highest gross hourly rate of pay was attained by consumers with a psychiatric disability. As a group, they earned $5.41 on average per hour.
By contrast, supported employment service consumers with an intellectual disability had the lowest productivity, earning $3.26 on average per hour. Consumers with autism closely followed, with average hourly earnings of $3.48.
4.4.9 Industrial relations arrangements
The industrial relations arrangements in the supported employment sector operate within existing Federal and State industrial relations regulatory frameworks. Amendments to the Disability Services Act 1986 (Cth) in 2002 resulted in a requirement that supported employment services pay award based wages and use a transparent tool to determine pro rata wages (Australian Fair Pay Commission).
The industrial relations arrangements information includes the method used to set the pay of consumers in the supported employment sector and the wage assessment tool used to determine their pro rata wages. This information is based on the 18,555 consumers ‘on the books’ in employment at 30 June 2008.
Method used to set pay for employees
The methods used to set consumers’ pay in 2007-08 in the supported employment sector were: respondent to an award; pay in reference to an award; ratified enterprise/certified agreement; Australian Workplace Agreement; the Supported Wage System; and other.
The method used to set the pay of consumers in the supported employment sector at 30 June 2008 is shown in Table 4.26. Supported employment service consumers were most likely to have their pay set by a ratified enterprise/certified agreement with their employer (5,861). Nearly a third of consumers (5,177) had a respondent to an award. A further 18.4% (3,410) of consumers had their pay set in reference to an award. The Supported Wages System was used to set the pay for 12.0% (2,227) of consumers and 8.1% (1,512) of consumers had an Australian Workplace Agreement with their employer. Less than 1.3% (247) had their pay set by some other method.
Wage tool used to determine wage
A wage assessment tool is a wage-setting mechanism which provides a method to determine pro rata minimum wages. Wage assessment tools measure the productive capacity of each individual supported employment service consumer in employment and determine a corresponding pro rata wage for each individual Australian Fair Pay Commission (AFPC).
At 30 June 2008, the wages of supported employment service consumers were determined using a range of wage assessment tools based on the consumer’s productivity, competency or both productivity and competency. Productivity-based wage assessment tools measure the output of consumers against an established benchmark, i.e. the co-worker without a disability. Competency-based wage assessment tools measure the work performance of consumers against set criteria (such as knowledge, understanding and skills) to a defined standard or benchmark. Hybrid wage assessment tools measure both productivity and competency (FaCS 2004).
Figure 4.43 shows the method used to determine the wages of consumers in the supported employment sector. Notably, the vast majority of supported employment service consumers had their wages determined using hybrid wage assessment tools, some 43.5% (8,065). The most common of these hybrid tools is the Endeavour Industries, which was used to determine the wages of 20.1% (3,731).
The next most common supported employment wage assessment tool used is the competency based tools. The most common of these type of tools was the Yumaro, which was used to assess the wages of 6,920 (37.3%) supported employment consumers.
A further 9.1% (1,690) of supported employment service consumers had their wages determined using productivity-based wage assessment tools. The most common of these tools is the PHT assessment tool, which was used to determine the wages of 8.1% (1,508) of all consumers. This tool is also used by employers in the open labour market. The remaining consumers (6.9% or 1,277) had their wages determined using other wage assessment tools.
Figure 4.43: Supported employment service consumers ‘on the books’, by measure used to determine wage, 30 June 2008
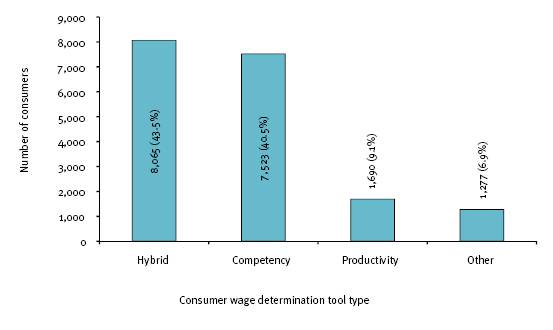
[ Return to Top Return to Section ]
4.5 Comparison between open and supported employment service consumers
There were significant differences in the characteristics of open and supported employment service consumers in 2007-08. For instance:
- The open employment services population had a younger age profile than the supported employment services population. The median age of open employment service consumers was 36 years, compared with a median age of 39 years for supported employment service consumers. Moreover, more open employment service consumers fell into younger age groups. Just under half (47.1%) of all consumers in open employment services were under the age of 35 years, compared with 38.4% of consumers in supported employment services.
- The representation of Indigenous Australians was higher in open than in supported employment services (4.0% compared with 2.3%).
- While open employment services were more than three times as likely as supported employment services to assist consumers born in non-English speaking countries (12.7% compared with 3.5%), non-English speaking born consumers in supported employment service were more than twenty-one times as likely to need interpreter assistance (17.3% compared with 0.8% of non-English speaking born consumers in open employment services).
- A slightly higher percentage of open than supported employment service consumers were living in regional and remote areas (35.8% compared with 32.2%).
- Consumers with a psychiatric disability were the largest group in open employment services (31.7%), whereas consumers with an intellectual disability were the largest group in supported employment services (69.7%).
- A considerably higher percentage of open than supported employment service consumers had multiple or other significant disabilities (46.1% compared with 31.4%).
- The percentage of consumers with a profound or severe core activity limitation was much higher among supported than open employment service consumers (71.8% compared with 17.8%).
- Open employment service consumers were most likely to need support with community (civic) and economic life (61.8%), whereas supported employment service consumers were most likely to need support with working (50.7%).
- Supported employment service consumers were much more likely than open employment service consumers to have in place formal and informal care arrangements.
- Some 8.5% of supported employment service consumers were living in settings where supported accommodation or formal care is provided, compared with 0.8% of open employment service consumers.
- Supported employment service consumers were more than five times as likely as open employment service consumers to have an informal carer (45.0% compared with 8.0%).
- Supported employment service consumers were much more likely than open employment service consumers to receive a government pension or allowance as their main source of income (98.7% compared with 73.8%).
- Deafblind primary disability consumers using supported employment services attained the highest employment outcome at 98.0%. No data was available for open employment.
Chapter Five: Trend series—Disability employment service consumers
- 5.1 Trend series—All disability employment service consumers assisted
- 5.2 Trend series—Equity groups
- 5.3 Trend series—Primary disability profile
5.1 Trend series—All disability employment service consumers assisted
In 2007-08, disability employment services assisted a total of 95,592 consumers nationally. Of these, 73,425 (76.8%) accessed open employment services and 22,167 (23.2%) accessed supported employment services.
As shown in Figure 5.1, there has been strong growth in the number of consumers assisted by disability employment services between 2000-01 and 2007-08, particularly over the last three financial years. Over this period, the number of consumers assisted has grown by 39.8% (27,222). This equates to an average annual growth rate of 11.8% or 9,074 more disability employment service consumers.
Figure 5.1: Consumers accessing disability employment services, 2000-01 to 2007-08
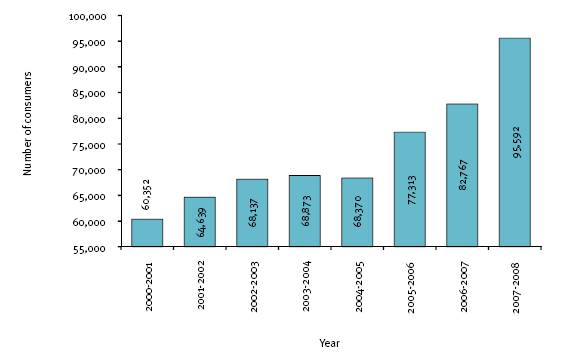
Much of this growth can be attributed to the expansion of the open employment sector with the full implementation of the case based funding model from July 2005 and the introduction of initiatives related to Welfare to Work reforms from July 2006. The number of consumers assisted by open employment services has grown by 95.5% (35,866) between 2000-01 and 2007-08. This equates to an average annual growth rate of 10.1% or 5,124 more open employment service consumers. Notably, the growth for the last three financial years accounted for 76.5% (27,422) of the growth in the open employment services population over the period 2000-01 to 2007-08.
The number of consumers assisted by supported employment services, on the other hand, has grown 28.9% (4,976) between 2000-01 and 2007-08. This equates to an average annual growth rate of 3.7%. Major sources of growth have occurred through the allocation of new employment places to help meet the demand for supported employment assistance and the increase in the take-up of this type of assistance.
The Machinery of Government changes in 2004-05 saw the cessation of dual employment services as a separate employment service type. In the lead up to these changes, these services were increasingly opting to specialise in either open or supported employment assistance rather than both streams of assistance. This resulted in a net decrease of 43.3% (2,428) consumers in dual employment services over the period 2000-01 to 2004-05. The 2,480 remaining consumers of dual employment services at 30 June 2005 were transferred to either an open or supported employment service on the basis of the stream of assistance they were accessing at that time. Figure 5.2 shows the change in the disability employment services population, by employment service type between 2000-01 and 2007-08.
Figure 5.2: Consumers accessing disability employment services, by employment service type, 2000-01 to 2007-08
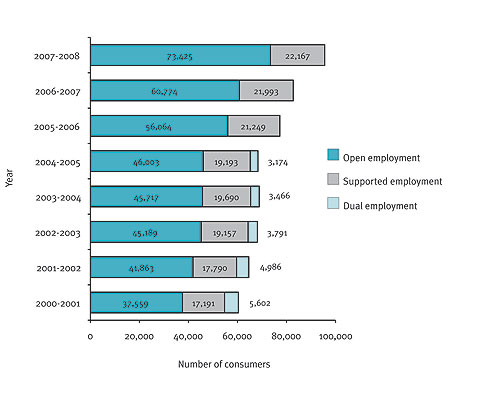
Table 5.1 provides a time series view of the number of consumers by disability employment service type, and the relevant proportions.
[ Return to Top Return to Section ]
5.2 Trend series—Equity groups
5.2.1 Female consumers
Female consumers accessing disability employment services
In 2007-08, disability employment services assisted a total of 36,524 female consumers nationally. As a group, they represented 38.2% of all disability employment service consumers. This compares with 45.2% of females in the general Australian labour force population aged 15 years and older (ABS 2008).
As shown in Figure 5.3, there has been strong growth in the number of female consumers assisted by disability employment services over the period 2000-01 to 2007-08, some 59.0% (14,975). This equates to an average annual growth rate of 7.8%. Importantly, the net growth in the number of female consumers assisted has increased at a slightly faster rate than the total disability employment service population (69.5% compared with 58.4%). This growth has translated into a marginal increase in the representation of female consumers in the disability employment services population, from 35.7% to 38.2%.
Figure 5.3: Female consumers accessing specialist disability employment services, 2000-01 to 2007-08
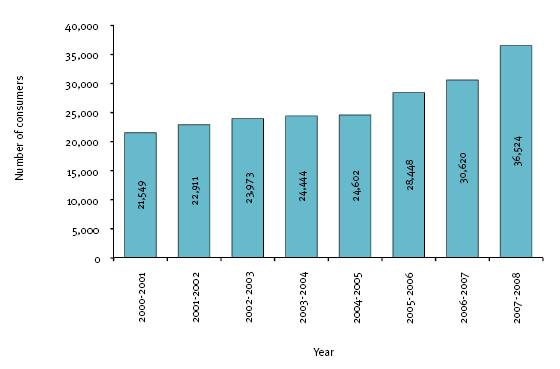
Female consumers accessing open employment services
In 2007-08, a total of 28,597 female consumers were assisted by open employment services nationally, accounting for 38.9% of all open employment service consumers. Between 2000-01 and 2007-08, there was strong growth some, 113.3% (15,193) in the number of female consumers accessing open employment assistance, as shown in Figure 5.4. This equates to an average annual growth rate of 11.4%. Importantly, the net growth in the female consumer group has increased at a faster rate than the open employment services population as a whole (113.3% compared with 95.5%). This growth has translated into a marginal increase in the representation of female consumers in the open employment services population, from 35.7% to 38.9%.
Figure 5.4: Female consumers accessing open employment services, 2000-01 to 2007-08
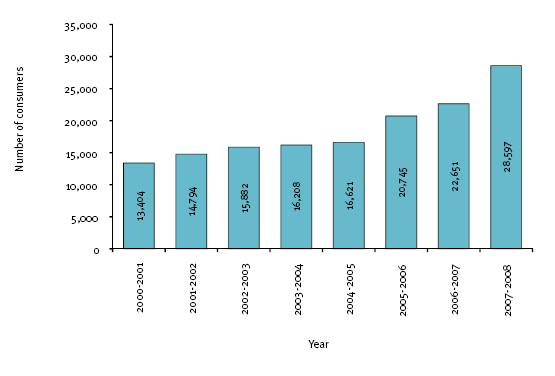
Female consumers accessing supported employment services
In 2007-08, a total of 7,927 female consumers were assisted by supported employment services nationally, accounting for 35.8% of all supported employment service consumers. Between 2000-01 and 2007-08, there has been reasonable growth in the number of female consumers accessing supported employment assistance as shown in Figure 5.5, some 28.1% (1,739). This equates to an average annual growth rate of 3.6%. Growth in the female consumer group was marginally lower than the supported employment services population as a whole (28.1% compared with 28.9%). This growth has resulted in a slight decrease in the representation of female consumers in the supported employment services population, from 36.0% to 35.8%.
Figure 5.5: Female consumers accessing supported employment services, 2000-01 to 2007-08
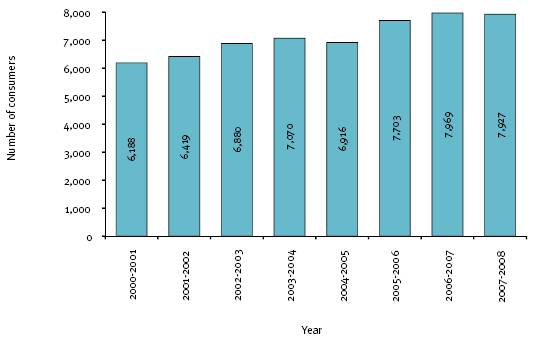
Table 5.2 provides a time series view of the number of female consumers by disability employment service type, and the relevant proportions.
5.2.2 Indigenous consumers
Indigenous consumers accessing disability employment services
In 2007-08, a total of 3,418 Indigenous consumers were assisted by disability employment services nationally. As a group, they represented 3.6% of all disability employment service consumers. This compares with 1.8% in the general Australian population aged 15 years and older (ABS 2007a).
Over the period 2000-01 to 2007-08, there has been strong growth in both the number and representation of Indigenous consumers accessing disability employment services, as shown in Figure 5.6:
- The number of Indigenous consumers assisted has grown 194.7% (2,258), from 1,160 to 3,418. This equates to an average annual growth rate of 16.7%. Importantly, growth in the Indigenous consumer group has exceeded the growth rate of the disability employment services population as a whole (194.7% compared with 58.4%).
- The representation of Indigenous consumers in the disability employment services population has increased from 1.9% to 3.6%.
Figure 5.6: Indigenous consumers accessing disability employment services, 2000-01 to 2007-08
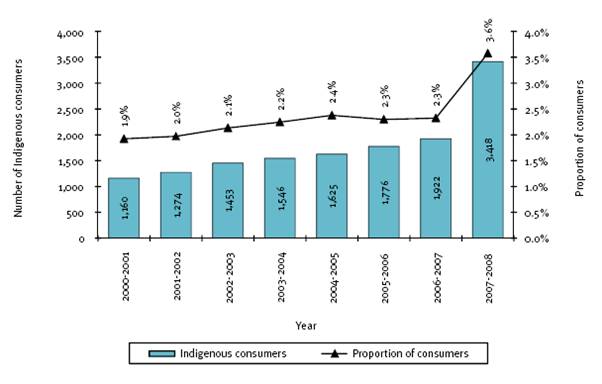
Indigenous consumers accessing open employment services
In 2007-08, a total of 2,906 Indigenous consumers were assisted by open employment services nationally. As a group, they represented 4.0% of all open employment service consumers.
Over the period 2000-01 to 2007-08, there has been strong growth in both the number and representation of Indigenous consumers accessing open employment assistance, as shown in Figure 5.7:
- The number of Indigenous consumers has grown by 266.5%, from 793 to 2,906. This equates to an average annual growth rate of 20.4%. Importantly, the growth rate in the Indigenous consumer group has exceeded that of the open employment services population as a whole (266.5% compared with 95.5%).
- The representation of Indigenous consumers in the open employment services population has increased from 2.1% to 4.0%.
The significant increase in the number of Indigenous participants in the Disability Employment Network (DEN) program is a consequence of several factors, particularly the introduction of the uncapped stream in mid 2006 leading to a significant overall increase in DEN participants. By the end of 2007-08, nearly 800 job seekers in the DEN uncapped stream were people from an Aboriginal or Torres Strait Islander background.
Figure 5.7: Indigenous consumers accessing open employment services, 2000-01 to 2007-08
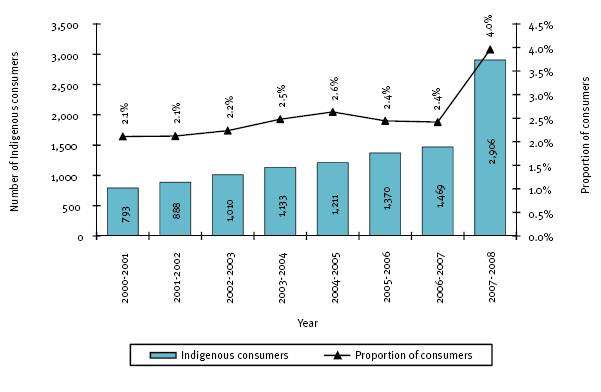
Indigenous consumers accessing supported employment services
In 2007-08, a total of 512 Indigenous consumers were assisted by supported employment services nationally. As a group, they represented 2.3% of all supported employment service consumers.
Over the period 2000-01 to 2007-08, there has been strong growth in both the number and representation of Indigenous consumers accessing supported employment assistance as shown in Figure 5.8:
- The number of Indigenous consumers assisted has grown by 95.4%, from 262 to 512. This equates to an average annual growth rate of 10.0%. Importantly, the growth in the Indigenous consumer group has exceeded that of the supported employment services population as a whole (95.4% compared with 28.9%).
- The representation of Indigenous consumers in the supported employment services population has increased from 1.5% to 2.3%.
Figure 5.8: Indigenous consumers accessing supported employment services, 2000-01 to 2007-08
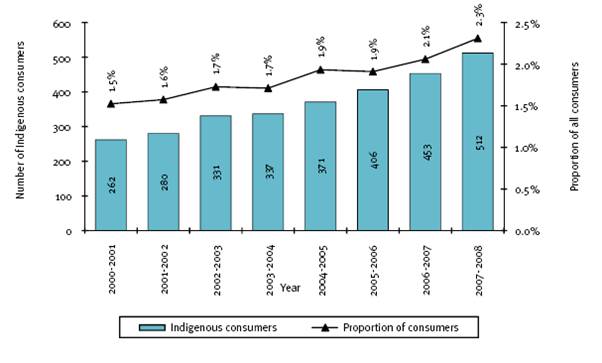
Table 5.3 provides a time series view of the number of Indigenous consumers by disability employment service type, and the relevant proportions.
5.2.3 Consumers from non-English speaking backgrounds
Consumers from non-English speaking backgrounds accessing disability employment services
In 2007-08, disability employment services assisted a total of 10,060 consumers from non-English speaking backgrounds (NESB) nationally. As a group, they accounted for 10.5% of all disability employment service consumers.
Over the period 2000-01 to 2007-08, there has been strong growth on balance in both the number and representation of NESB consumers accessing disability employment services, as shown in Figure 5.9:
- The number of NESB consumers assisted has fluctuated over time, peaking at 10,060 in 2007-08. Despite fluctuations between years, the overall number of NESB consumers assisted by disability employment services has grown by 170.4% (6,340), from 3,720 to 10,060. This equates to an average annual growth rate of 15.3%. Importantly, the growth in the NESB consumer group has exceeded that of the disability employment services population as a whole (170.4% compared with 58.4%).
- The representation of NESB consumers in the disability employment services population has increased from 6.2% to 10.5%.
Figure 5.9: Consumers from non-English speaking backgrounds accessing disability employment services, 2000-01 to 2007-08
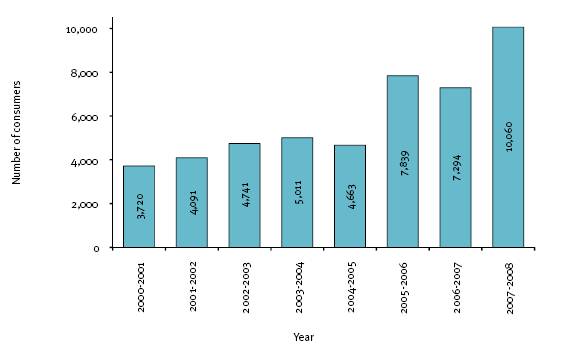
Consumers from non-English speaking backgrounds accessing open employment services
In 2007-08, open employment services assisted a total of 9,289 consumers from non-English speaking backgrounds (NESB) nationally. As a group, they accounted for 12.7% of all open employment service consumers.
Over the period 2000-01 to 2007-08, there has been strong growth overall in both the number and representation of NESB consumers accessing open employment services as shown in Figure 5.10:
- The number of NESB consumers assisted has fluctuated, peaking at 9,289 in 2007-08. Despite fluctuations between years, the overall number of NESB consumers assisted by open employment services has grown by 243.8% (6,587), from 2,702 to 9,289. This equates to an average annual growth rate of 19.3%. Growth in the NESB consumer group has been greater than that of the open employment services population as a whole (243.8% compared with 95.5%).
- The representation of NESB consumers in the open employment services population has increased from 7.2% to 12.7%.
Figure 5.10: Consumers from non-English speaking backgrounds accessing open employment services, 2000-01 to 2007-08
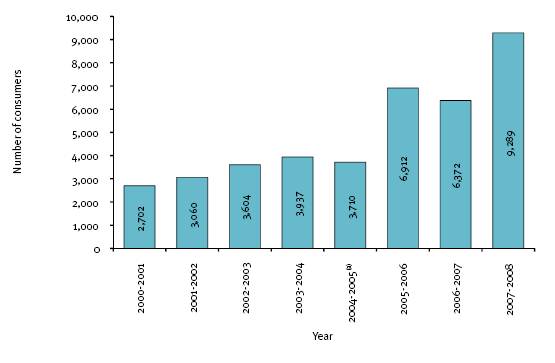
Consumers from non-English speaking backgrounds accessing supported employment services
In 2007-08, supported employment services assisted a total of 771 consumers from non-English speaking backgrounds (NESB) nationally. As a group, they accounted for 3.5% of all supported employment service consumers.
As shown in Figure 5.11, the number of NESB consumers accessing supported employment services has fluctuated over the period 2000-01 to 2007-08, peaking at 927 in 2005-06. Despite fluctuations between years, the overall number of NESB consumers assisted by supported employment services has grown by 6.9%, from 721 to 771. This equates to an average annual growth rate of 1.0%. The growth rate in the NESB consumer group has been equal to that of the supported employment services population as a whole. The representation of NESB consumers in the supported employment services population is 3.5%.
Figure 5.11: Consumers from non-English speaking backgrounds accessing supported employment services, 2000-01 to 2007-08
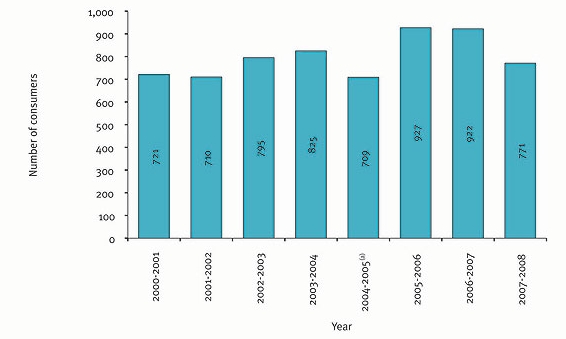
(a) The 2004-05 data has been amended to rectify an anomaly in the 2005 Disability Services Census report.
Table 5.4 provides a time series view of the number of non-English speaking consumers by disability employment service type, and the relevant proportions.
[ Return to Top Return to Section ]
5.3 Trend series—Primary disability profile
‘Primary disability’ refers to the disability that most clearly expresses the experience of disability by a person. It can also be considered as the disability causing the most difficulty to the person in daily life, compared with any other disability they may also have (FaCS 2005).
A factor impacting on the primary disability profile of the disability employment services population in recent years has been changes and improvements to diagnostic medical and psychosocial assessments. There is evidence to suggest that young consumers are increasingly being diagnosed with autism or specific learning disability/ADD as opposed to a less specific diagnosis of intellectual disability.
5.3.1 Consumers accessing disability employment services
The primary disability profile of the disability employment services population is diverse and has changed over time. In 2007-08, consumers with an intellectual disability (as a primary disability) continue to be the largest group accessing disability employment services, some 27,195 (28.4%). Consumers with a psychiatric disability (25,828) were the next largest group and grew from 19.1% in 2000-01 to 27.0% in 2007-08.
Table 5.5 shows the change in the disability employment services population by primary disability type between 2000-01 and 2007-08.
Between 2000-01 and 2007-08, the number of consumers accessing disability employment services increased for all primary disability types except for the deafblind group. The increases were greatest among consumers with a psychiatric disability (14,321), and physical disability (11,174).
The highest growth rates between 2000-01 and 2007-08 was recorded for consumers with autism and specific learning disability/ADD. As a group, consumers with autism grew by 327.9% and consumers with a specific learning disability/ADD by 130.8%. This is well above the national average of 58.4%. Despite these gains, the overall growth rate recorded for consumers with an intellectual disability (0.4%) was considerably lower than the national average.
Strong growth rates were also recorded for consumers with a psychiatric disability (124.5%), physical disability (116.3%), speech disability (104.6%), and neurological disability (75.1%). Overall growth rates for consumers with a hearing, acquired brain injury, and vision disabilities were also below the national average, with 34.6%, 33.9%, and 15.2% respectively.
5.3.2 Consumers accessing open employment services
The primary disability profile of the open employment services consumer population is diverse and has changed over time. In 2007-08, consumers with a psychiatric disability were the largest group accessing open employment services, some 23,243 (31.7%). Consumers with a physical disability were the next largest group with 19,334 (26.3%).
Table 5.6 shows the change in the open employment services population by primary disability type between 2000-01 and 2007-08. It shows that the number of consumers accessing open employment services increased for all primary disability types except for the deafblind group. These increases were greatest among consumers with a psychiatric disability (14,292), physical disability (12,000) and specific learning/ADD (4,186). This equates to an average annual growth of 2,042, 1,714 and 598 consumers respectively. Notably, consumers with a psychiatric disability accounted for 31.7% of the total net growth in the open employment services population over this period, while consumers with a physical and intellectual disability accounted for 26.3% and 16.0% respectively.
The greatest growth was recorded for consumers with autism and physical disability. Consumers with autism grew by 497.9% and consumers with a physical disability by 163.6%. This is well above the national average of 95.5%, despite these gains, the overall growth rate recorded for consumers with an intellectual disability (1.1%) was considerably lower than the national average.
Strong growth rates were also recorded for consumers with a speech disability (135.0%) However, in addition to consumers with an intellectual disability, overall growth rates for consumers with neurological disability (99.9%), an acquired brain injury (48.2%) and a hearing disability (43.2%) were below the national average (95.5%).
5.3.3 Consumers accessing supported employment services
The primary disability profile of the supported employment services population has changed little over time. In 2007-08, consumers with an intellectual disability continued to be the predominant group accessing supported employment services, some 15,443 (69.7%). Consumers with a psychiatric and physical disability were the next largest groups, with 2,585 (11.7%) and 1,451 (6.5%) respectively.
Table 5.7 shows the change in the supported employment services population by primary disability type between 2000-01 and 2007-08. It shows that the number of consumers accessing supported employment services increased for all primary disability types. These increases were greatest among consumers with an intellectual and psychiatric disability, with 2,570 and 1,040 respectively. This equates to an average annual growth of 367 and 149 consumers respectively. Notably, consumers with an intellectual disability accounted for 51.6% of the total growth in the supported employment services population over this period, while consumers with a psychiatric disability accounted for 20.9%.
Also, the greatest percentage growth between 2000-01 and 2007-08 was recorded for consumers with autism and specific learning /ADD disability. Consumers with autism have grown by 155.6% and consumers with a specific learning/ADD disability by 106.3%. This is well above the national average of 28.9%. Despite these gains, the overall growth rate recorded for consumers with an intellectual disability (20.0%) was slightly lower than the national average.
Strong growth rates were also recorded for consumers with a neurological disability (72.4%), psychiatric disability (67.3%), and an acquired brain injury (39.5%). As with consumers with an intellectual disability, overall growth rates for consumers with physical disability (24.8%), speech disability (25.9%), and vision (20.9%) were below the national average.
Chapter Six: State and territory summary statistics
- 6.1 New South Wales
- 6.2 Victoria
- 6.3 Queensland
- 6.4 Western Australia
- 6.5 South Australia
- 6.6 Tasmania
- 6.7 Australian Capital Territory
- 6.8 Northern Territory
This chapter provides summary statistics for all states and territories, and includes information on disability service outlet operations and the characteristics of consumers accessing specialist disability employment assistance in 2007-08.
6.1 New South Wales
6.1.1 Disability service outlet operations
In 2007-08, a total of 418 (34.8%) of the 1,201 Australian Government funded disability service outlets were located in New South Wales. Of these:
- 385 (92.1%) provided disability employment services, of which 229 (54.8%) provided open employment services and 156 (37.3%) provided supported employment services;
- 16 (3.8%) provided advocacy services;
- 14 (3.3%) provided respite services;
- 2 (0.5%) provided print disability services; and
- 1 (0.2%) provided disability information services.
A total of 2,820 FTE staff worked in New South Wales disability service outlets. These staff accounted for 37.2% of all FTE staff working in disability service outlets nationally.
6.1.2 Disability employment service consumer information
Consumers assisted
In 2007-08, a total of 31,084 consumers were assisted by New South Wales disability employment services, accounting for 32.5% of all consumers nationally. Of these:
- 72.9% used open employment services;
- 27.1% used supported employment services;
- 37.9% were female consumers;
- 24.8% were young consumers aged 14-24 years;
- 87.0% were born in Australia or another English speaking country; and
- 4.0% were of Indigenous background.
Disability information
Of the 31,084 consumers in New South Wales disability employment services in 2007-08:
- 28.2% had a profound or severe core activity limitation;
- 31.5% had an intellectual disability;
- 26.0% had a psychiatric disability;
- 21.2% had a physical disability;
- 8.0% had a learning disability;
- 2.7% had an acquired brain injury;
- 2.8% had a neurological disability;
- 2.5% had autism;
- 2.6% had a hearing disability; and
- 2.3% had a vision disability.
Main Source of income
In 2007-08, the main sources of income for the 31,084 consumers in New South Wales disability employment services were:
- Disability Support Pension 51.2%;
- Other pension or benefit 29.2%; and
- Paid employment 3.0%.
6.1.3 Employment outcomes
‘Employment outcomes’ refers to those consumers who were employed for some or all of the year. In 2007-08 some 94.1% of supported employment and 44.4% open employment consumers attained an employment outcome
6.1.4 Supported employment service consumer employment characteristics
At 30 June 2008, 7,036 consumers ‘on the books’ in New South Wales supported employment services attained an employment outcome: Of these:
- 21.4% worked 8-15 hours a week, 39.0% worked 16-30 hours a week, and 38.5% worked 31-40 hours a week;
- 28.9% worked full-time, with 25.5 hours on average worked each week;
- The most common wage range was $1 to $100 a week, with 65.8% of consumers earning within this range; and
- The average gross weekly wage was $91.33, and the average gross hourly rate of pay was $3.69.
[ Return to Top Return to Section ]
6.2 Victoria
6.2.1 Disability service outlet operations
In 2007-08, a total of 280 (23.3%) of the 1,201 Australian Government funded disability service outlets were located in Victoria. Of these:
- 250 (89.3%) provided disability employment services, of which 149 (53.2%) provided open employment services and 101 (36.1%) provided supported employment services;
- 21 (7.5%) provided advocacy services;
- 7 (2.5%) provided respite services; and
- 2 (0.7%) provided print disability services.
A total of 1,458 FTE staff worked in Victoria disability service outlets. These staff accounted for 19.2% of all FTE staff working in disability service outlets nationally.
6.2.2 Disability employment service consumer information
Consumers assisted
In 2007-08, a total of 24,890 consumers were assisted by disability employment services, accounting for 26.0% of all consumers nationally. Of these:
- 80.2% used open employment services;
- 19.8% used supported employment services;
- 39.6% were female consumers;
- 17.3% were young consumers aged 14-24 years;
- 82.4% were born in Australia or another English speaking country; and
- 1.2% were of Indigenous background.
Disability information
Of the 24,890 consumers in Victorian disability employment services in 2007-08:
- 22.5% had a profound or severe core activity limitation;
- 21.0% had an intellectual disability;
- 31.8% had a psychiatric disability;
- 26.7% had a physical disability;
- 6.7% had a learning disability;
- 2.4% had an acquired brain injury;
- 3.2% had a neurological disability;
- 2.2% had autism;
- 3.0% had a hearing disability; and
- 2.5% had a vision disability.
Main source of income
In 2007-08, the main sources of income for the 24,890 consumers in Victorian disability employment services were:
- Disability Support Pension 48.5%;
- Other pension or benefit 31.5%; and
- Paid employment 2.8%.
6.2.3 Employment outcomes
‘Employment outcomes’ refers to those consumers who were employed for some or all of the year. In 2007-08 some 95.2% of supported employment and 47.2% of open employment service consumers attained an employment outcome.
6.2.4 Supported employment service consumer employment characteristics
At 30 June 2008, 4,126 consumers ‘on the books’ in Victorian supported employment services attained an employment outcome: Of these:
- 26.7% worked 8-15 hours a week, 38.7% worked 16-30 hours a week, and 33.7% worked 31-40 hours a week;
- 24.0% worked full-time, with 24.2 hours on average worked each week;
- The most common wage range was $1 to $100 a week, with 62.0% of consumers earning within this range; and
- The average gross weekly wage was $102.38, and the average gross hourly rate of pay was $4.52.
[ Return to Top Return to Section ]
6.3 Queensland
6.3.1 Disability service outlet operations
In 2007-08, a total of 199 (16.6%) of the 1,201 Australian Government funded disability service outlets were located in Queensland. Of these:
- 184 (92.5%) provided disability employment services, of which 134 (67.3%) provided open employment services and 50 (25.1%) provided supported employment services;
- 8 (4.0%) provided advocacy services;
- 6 (3.0%) provided respite services; and
- 1 (0.5%) provided print disability services.
A total of 1,119 FTE staff worked in Queensland disability service outlets. These staff accounted for 14.8% of all FTE staff working in disability service outlets nationally.
6.3.2 Disability employment service consumer information
Consumers assisted
In 2007-08, a total of 18,212 consumers were assisted by Queensland disability employment services, accounting for 19.1% of all consumers nationally. Of these:
- 86.6% used open employment services;
- 13.4% used supported employment services;
- 37.2% were female consumers;
- 26.9% were young consumers aged 14-24 years;
- 94.0% were born in Australia or another English speaking country; and
- 5.0% were of Indigenous background.
Disability information
Of the 18,212 consumers in Queensland disability employment services in 2007-08:
- 22.9% had a profound or severe core activity limitation;
- 25.2% had an intellectual disability;
- 27.7% had a psychiatric disability;
- 21.2% had a physical disability;
- 7.5% had a learning disability;
- 3.0% had an acquired brain injury;
- 3.0% had a neurological disability;
- 5.6% had autism;
- 3.9% had a hearing disability; and
- 2.2% had a vision disability.
Main source of income
In 2007-08, the main sources of income for the 18,212 consumers in Queensland disability employment services were:
- Disability Support Pension 48.6%;
- Other pension or benefit 27.7%; and
- Paid employment 3.5%.
6.3.3 Employment outcomes
‘Employment outcomes’ refers to those consumers who were employed for some or all of the year. In 2007-08 some 91.2% of supported employment and 55.1% of open employment service consumers attained an employment outcome
6.3.4 Supported employment service consumer employment characteristics
At 30 June 2008, 2,022 consumers ‘on the books’ in Queensland supported employment services attained an employment outcome: Of these:
- 13.3% worked 8-15 hours a week, 40.1% worked 16-30 hours a week, and 45.9% worked 31-40 hours a week;
- 40.2% worked full-time, with 27.9 hours on average worked each week;
- The most common wage range was $1 to $100 a week, with 58.5% of consumers earning within this range; and
- The average gross weekly wage was $101.45, and the average gross hourly rate of pay was $3.60.
[ Return to Top Return to Section ]
6.4 Western Australia
6.4.1 Disability service outlet operations
In 2007-08, a total of 98 (8.2%) of the 1,201 Australian Government funded disability service outlets were located in Western Australia. Of these:
- 79 (80.6%) provided disability employment services, of which 45 (45.9%) provided open employment services and 34 (34.7%) provided supported employment services;
- 9 (9.2%) provided advocacy services;
- 8 (8.2%) provided respite services; and
- 2 (2.0%) provided print disability services.
A total of 988 FTE staff worked in Western Australian disability service outlets. These staff accounted for 13.0% of all FTE staff working in disability service outlets nationally.
6.4.2 Disability employment service consumer information
Consumers assisted
In 2007-08, a total of 8,319 consumers were assisted by Western Australian disability employment services, accounting for 8.7% of all consumers nationally. Of these:
- 71.9% used open employment services;
- 28.1% used supported employment services;
- 38.2% were female consumers;
- 24.5% were young consumers aged 14-24 years;
- 91.6% were born in Australia or another English speaking country; and
- 4.5% were of Indigenous background.
Disability information
Of the 8,319 consumers in Western Australian disability employment services in 2007-08:
- 40.9% had a profound or severe core activity limitation;
- 36.1% had an intellectual disability;
- 24.0% had a psychiatric disability;
- 16.9% had a physical disability;
- 6.9% had a learning disability;
- 3.6% had an acquired brain injury;
- 3.0% had a neurological disability;
- 4.1% had autism;
- 3.3% had a hearing disability; and
- 1.8% had a vision disability.
Main source of income
In 2007-08, the main sources of income for the 8,319 consumers in Western Australian employment services were:
- Disability Support Pension 60.0%;
- Other pensions or benefits 17.1%; and
- Paid employment 4.6%.
6.4.3 Employment outcomes
‘Employment outcomes’ refers to those consumers who were employed for some or all of the year. In 2007-08, some 97.0% of supported employment and 65.2% of open employment service consumers attained an employment outcome.
6.4.4 Supported employment service consumer employment characteristics
At 30 June 2008, 1,991 consumers ‘on the books’ in Western Australian supported employment services attained an employment outcome: Of these:
- 21.1% worked 8-15 hours a week, 40.1% worked 16-30 hours a week, and 38.4% worked 31-40 hours a week;
- 21.9% worked full-time, with 25.5 hours on average worked each week;
- The most common wage range was $1 to $100 a week, with 65.3% of consumers earning within this range; and
- The average gross weekly wage was $77.32, and the average gross hourly rate of pay was $2.83.
[ Return to Top Return to Section ]
6.5 South Australia
6.5.1 Disability service outlet operations
In 2007-08, a total of 124 (10.3%) of the 1,201 Australian Government funded disability service outlets were located in South Australia. Of these:
- 113 (91.1%) provided disability employment services, of which 70 (56.5%) provided open employment services and 43 (34.7%) provided supported employment services;
- 6 (4.8%) provided advocacy services;
- 4 (3.2%) provided respite services; and
- 1 (0.8%) provided print disability services.
A total of 856 FTE staff worked in South Australian disability service outlets. These staff accounted for 11.3% of all FTE staff working in disability service outlets nationally.
6.5.2 Disability employment service consumer information
Consumers assisted
In 2007-08, a total of 8,733 consumers were assisted by South Australian disability employment services, accounting for 9.1% of all consumers nationally. Of these:
- 65.6% used open employment services;
- 34.4% used supported employment services;
- 38.1% were female consumers;
- 25.9% were young consumers aged 14-24 years;
- 94.1% were born in Australia or another English speaking country; and
- 2.0% were of Indigenous background.
Disability information
Of the 8,733 consumers in South Australian disability employment services in 2007-08:
- 37.3% had a profound or severe core activity limitation;
- 35.4% had an intellectual disability;
- 20.1% had a psychiatric disability;
- 17.4% had a physical disability;
- 8.8% had a learning disability;
- 2.7% had an acquired brain injury;
- 4.9% had a neurological disability;
- 3.4% had autism;
- 2.1% had a hearing disability; and
- 4.6% had a vision disability.
Main source of income
In 2007-08, the main sources of income for the 8,733 consumers in South Australian disability employment services were:
- Disability Support Pension 61.8%;
- Other pension or benefit 23.4%; and
- Paid employment 3.5%.
6.5.3 Employment outcomes
‘Employment outcomes’ refers to those consumers who were employed for some or all of the year. In 2007-08 some 97.3% of supported employment and 49.3% of open employment service consumers attained an employment outcome.
6.5.4 Supported employment service consumer employment characteristics
At 30 June 2008, 2,518 consumers ‘on the books’ in South Australian supported employment services attained an employment outcome: Of these:
- 17.8% worked 8-15 hours a week, 33.0% worked 16-30 hours a week, and 48.9% worked 31-40 hours a week;
- 35.4% worked full-time, with 27.3 hours on average worked each week;
- The most common wage range was $1 to $100 a week, with 65.3% of consumers earning within this range; and
- The average gross weekly wage was $87.67, and the average gross hourly rate of pay was $3.24.
[ Return to Top Return to Section ]
6.6 Tasmania
6.6.1 Disability service outlet operations
In 2007-08, a total of 39 (3.2%) of the 1,201 Australian Government funded disability service outlets were located in Tasmania. Of these:
- 32 (84.1%) provided disability employment services, of which 17 (43.6%) provided open employment services and 15 (38.5%) provided supported employment services;
- 3 (7.7%) provided advocacy services;
- 3 (7.7%) provided respite services; and
- 1 (2.6%) provided print disability services.
A total of 188 FTE staff worked in Tasmanian disability service outlets. These staff accounted for 2.5% of all FTE staff working in disability service outlets nationally.
6.6.2 Disability employment service consumer information
Consumers assisted
In 2007-08, a total of 2,385 consumers were assisted by Tasmanian disability employment services, accounting for 2.5% of all consumers nationally. Of these:
- 74.3% used open employment services;
- 25.7% used supported employment services;
- 35.3% were female consumers;
- 27.7% were young consumers aged 14-24 years;
- 98.1% were born in Australia or another English speaking country; and
- 5.5% were of Indigenous background.
Disability information
Of the 2,385 consumers in Tasmanian disability employment services in 2007-08:
- 34.9% had a profound or severe core activity limitation;
- 34.1% had an intellectual disability;
- 20.6% had a psychiatric disability;
- 20.7% had a physical disability;
- 10.9% had a learning disability;
- 3.6% had an acquired brain injury;
- 2.7% had a neurological disability;
- 3.0% had autism;
- 2.4% had a hearing disability; and
- 1.6% had a vision disability.
Main source of income
In 2007-08, the main sources of income for the 2,385 consumers in Tasmanian disability employment services were:
- Disability Support Pension 60.0%;
- Other pensions or benefits 23.6%; and
- Paid employment 2.2%.
6.6.3 Employment outcomes
‘Employment outcomes’ refers to those consumers who were employed for some or all of the year. Some 95.6% of supported employment and 54.3% of open employment service consumers attained an employment outcome in 2007-08.
6.6.4 Supported employment service consumer employment characteristics
At 30 June 2008, 537 consumers ‘on the books’ in Tasmanian supported employment services attained an employment outcome: Of these:
- 17.5% worked 8-15 hours a week, 41.7% worked 16-30 hours a week, and 39.9% worked 31-40 hours a week;
- 35.9% worked full-time, with 26.9 hours on average worked each week;
- The most common wage range was $1 to $100 a week, with 68.2% of consumers earning within this range; and
- The average gross weekly wage was $85.76, and the average gross hourly rate of pay was $3.39.
[ Return to Top Return to Section ]
6.7 Australian Capital Territory
6.7.1 Disability service outlet operations
In 2007-08, a total of 23 (1.9%) of the 1,201 Australian Government funded disability service outlets were located in the ACT. Of these:
- 18 (78.2%) provided disability employment services, of which 9 (39.1%) provided open employment services and 9 (39.1%) provided supported employment services;
- 2 (8.7%) provided advocacy services;
- 1 (4.3%) provided respite services;
- 1 (4.3%) provided print disability services; and
- 1 (4.3%) provided information services.
A total of 111 FTE staff worked in ACT disability service outlets. These staff accounted for 1.5% of all FTE staff working in disability service outlets nationally.
6.7.2 Disability employment service consumer information
Consumers assisted
In 2007-08, a total of 1,221 consumers were assisted by ACT disability employment services, accounting for 1.3% of all consumers nationally. Of these:
- 78.6% used open employment services;
- 21.4% used supported employment services;
- 39.1% were female consumers;
- 22.1% were young consumers aged 14-24 years;
- 91.2% were born in Australia or another English speaking country; and
- 2.7% were of Indigenous background.
Disability information
Of the 1,221 consumers in ACT disability employment services in 2007-08:
- 24.7% had a profound or severe core activity limitation;
- 39.0% had an intellectual disability;
- 29.1% had a psychiatric disability;
- 11.4% had a physical disability;
- 5.7% had a learning disability;
- 3.3% had an acquired brain injury;
- 2.4% had a neurological disability;
- 3.5% had autism;
- 3.0% had a hearing disability; and
- 2.3% had a vision disability.
Main source of income
In 2007-08, the main sources of income for the 1,221 consumers in ACT disability employment services were:
- Disability Support Pension 53.4%;
- Other pensions or benefits 19.7%; and
- Paid employment 5.1%.
6.7.3 Employment outcomes
‘Employment outcomes’ refers to those consumers who were employed for some or all of the year. Some 88.5% of supported employment and 68.2% of open employment service consumers attained an employment outcome in 2007-08.
6.7.4 Supported employment service consumer employment characteristics
At 30 June 2008, 214 consumers ‘on the books’ in ACT supported employment services attained an employment outcome. Of these:
- 45.3% worked 8-15 hours a week, 38.3% worked 16-30 hours a week, and 15.0% worked 31-40 hours a week;
- 9.8% worked full-time, with 18.6 hours on average worked each week;
- The most common wage range was $1 to $100 a week, with 58.4% of consumers earning within this range; and
- The average gross weekly wage was $105.39, and the average gross hourly rate of pay was $5.49.
[ Return to Top Return to Section ]
6.8 Northern Territory
6.8.1 Disability service outlet operations
In 2007-08, a total of 20 (1.7%) of the 1,201 Australian Government funded disability service outlets were located in Northern Territory. Of these:
- 14 (70.0%) provided disability employment services, of which 9 (45.0%) provided open employment services and 5 (25.0%) provided supported employment services;
- 3 (15.0%) provided advocacy services; and
- 3 (15.0%) provided respite services.
A total of 37 FTE staff worked in Northern Territory disability service outlets. These staff accounted for 0.5% of all FTE staff working in disability service outlets nationally.
6.8.2 Disability employment service consumer information
Consumers assisted
In 2007-08, a total of 636 consumers were assisted by Northern Territory disability employment services, accounting for 0.7% of all consumers nationally. Of these:
- 79.9% used open employment services;
- 20.1% used supported employment services;
- 40.1% were female consumers;
- 28.1% were young consumers aged 14-24 years;
- 91.5% were born in Australia or another English speaking country; and
- 30.4% were of Indigenous background.
Disability information
Of the 636 consumers in Northern Territory disability employment services in 2007-08:
- 28.8% had a profound or severe core activity limitation;
- 28.6% had an intellectual disability;
- 20.6% had a psychiatric disability;
- 22.3% had a physical disability;
- 7.1% had a learning disability;
- 6.1% had an acquired brain injury;
- 3.9% had a neurological disability;
- 3.9% had autism;
- 3.9% had a hearing disability; and
- 2.7% had a vision disability.
Main source of income
In 2007-08, the main sources of income for the 636 consumers in Northern Territory disability employment services were:
- Disability Support Pension 52.4%;
- Other pensions or benefits 19.2%; and
- Paid employment 4.4%.
6.8.3 Employment outcomes
‘Employment outcomes’ refers to those consumers who were employed for some or all of the year. Some 87.5% of supported employment and 60.6% of open employment service consumers attained an employment outcome in 2007-08.
6.8.4 Supported employment service consumer employment characteristics
At 30 June 2008, 93 consumers ‘on the books’ in Northern Territory supported employment services attained an employment outcome. Of these:
- 40.9% worked 8-15 hours a week, 30.1% worked 16-30 hours a week, and 29.0% worked 31-40 hours a week;
- 15.1% worked full-time, with 21.4 hours on average worked each week;
- The most common wage range was $1 to $100 a week, with 58.4% of consumers earning within this range; and
- The average gross weekly wage was $96.09, and the average gross hourly rate of pay was $4.17.
Chapter Seven: Appendices
7.1 Detailed data tables
Chapter Eight: Glossary of Terms
A | B | C | D | E | F | H | I | J | L | M | N | O | P | R | S | T | U | V | W | Y
A
Aboriginal origin – a person who self-identifies, or is identified, as being of Aboriginal descent.
Aboriginal and Torres Strait Islander origin – a person who self-identifies, or is identified, as being of Aboriginal and Torres Strait Islander descent.
ABS – Australian Bureau of Statistics
Accommodation setting – the setting where the consumer usually resides (e.g. private residence, supported accommodation facility, boarding house/private hotel).
Acquired brain injury (ABI) – any damage to the brain occurring after birth. It can include damage sustained by infection (e.g. meningitis), degenerative neurological diseases (e.g. multiple sclerosis, Parkinson’s disease and Alzheimer’s disease), stroke, tumors, lack of oxygen (e.g. near drowning), prolonged alcohol, drug or other substance misuse, or trauma caused by an impact to the head. The specific losses of functioning depend on which area of the brain has been affected and will be different for each person.
Advocacy services – services that assist people with disability to overcome barriers that impact on their daily life and their ability to participate in the community. Service provision focuses on six different models of advocacy: self advocacy; individual advocacy; citizen advocacy; family advocacy; legal advocacy; and systemic advocacy. The adoption of a range of advocacy models enables advocacy services to deliver flexible and responsive services to meet the needs of people with disability.
Attention Deficit Disorder (ADD) – A behaviour disorder usually diagnosed in childhood. The medical condition is also commonly called ADHD (Attention Deficit Hyperactivity Disorder).
Autism – an umbrella description encompassing Autistic disorder (sometimes called infantile or childhood autism), Asperger’s disorder and Atypical autism. Autism is a lifelong disability that affects the way a person communicates and relates to other people and the world around them. People with autism typically display major impairments in the areas of social interaction, communication and behaviour (restricted interests and repetitive behaviours). Many people with autism also have sensory sensitivities, i.e. over-or-under sensitivity to sight, touch, taste, smell, sound, temperature or pain. As a result of their impairments, they often experience anxiety, frustration and confusion when faced with the demands of everyday life.
Average standard hours – the standard number of hours worked by a consumer. Where the standard number of hours worked vary, this is an estimate of the average hours worked.
Awards/agreements – a written document between an employer and employee about the terms and conditions of employment. Examples of such documents are a Certified Agreement, an Australian Workplace Agreement, and an SWS Productivity Based Wage.
Award wage – the minimum legal rate of pay set in the relevant award for a particular occupation.
[ Return to Top Return to Section ]
B
Basis of employment – the basis on which a consumer is employed indicates the permanency of the position held, including leave entitlements i.e. full-time, part-time, casual, seasonal, permanent and temporary employment.
Business service – another term used to refer to a supported employment service.
[ Return to Top Return to Section ]
C
Casual employment – casual employees are not usually entitled to paid holiday or sick leave. They will generally have a higher hourly rate or loading to compensate for the lack of leave and other entitlements. They may be either permanent or temporary employees and have either fixed or irregular hours of work.
Certified agreement – a specifically negotiated workplace agreement.
Communication – making oneself understood by others, and understanding others.
Community (civic) and economic life – participating in community life, recreation, human rights and economic life, such as handling money.
Consumer – a person who accesses an Australian Government funded CSTDA service.
Consumer ‘on the books’ – the number of consumers on 30 June 2008 registered as receiving support from a disability employment service.
Core activity limitation – refers to whether a person needs help, has difficulty, or uses aids or equipment with the core activities of self-care, mobility or communication. These core activities are commonly referred to as activities of daily living and are strongly associated with autonomy and the performance of other life roles.
CSTDA – Commonwealth State Territory Disability Agreement
[ Return to Top Return to Section ]
D
Days of operation – the days of the week a disability service outlet usually operates. Where days of operation during the Census Week (26 June to 30 June 2008) are not typical of the outlets operations, typical hours are also recorded.
Deafblind – having a sensory impairment to both hearing and sight.
DEWR – Department of Employment and Workplace Relations (Australian Government)
DEEWR – Department of Education, Employment and Workplace Relations (Australian Government)
Direct support staff – staff that have direct contact with consumers in a support role. This includes coordinators, case workers and other staff who spend a major portion of their time in direct consumer contact.
Disability employment services – services providing specialist employment assistance to people with disability to assist them to obtain and retain employment. There are two types of disability employment services, open and supported employment services. Open employment services assist job seekers with disability to obtain and retain employment in the open labour market. Supported employment services provide ongoing on-the-job employment support within a commercial enterprise. Some supported employment services also provide targeted support or non-vocational activities.
Disability employment service type – the type of specialist employment assistance provided i.e. open or supported employment.
Disability service outlet – an administrative business or unit of a funded organisation which provides a service type under the CSTDA at a particular site.
Disability support pension (DSP) – a means-tested income support payment for people with disability who from 1 July 2006, because of their impairment, are unable to work for at least 15 hours a week at or above the relevant minimum wage.
Does not need assistance, uses aids – the consumer does not need help or supervision to perform the task, but uses aids and/or equipment.
Does not need assistance, does not use aids – the consumer does not need help or supervision to perform the task, and does not use aids and/or equipment.
Domestic life – home and living skills such as shopping, housekeeping, cooking and home maintenance.
Domestic-scale supported living – a community living setting where staff or volunteers provide domestic support to people with a disability (e.g. congregate care, community residential units and group homes). These services may or may not provide 24 hour supervision and care.
[ Return to Top Return to Section ]
E
Effective communication – the ability to express more than basic needs to unfamiliar people (e.g. the exchange of thoughts, messages, or information) via speech, signals, writing and/or behaviour.
Employment outcome – identifies whether the consumer had a period of employment in the Census Year (between 1 July and 30 June).
Exit date – the date on which the consumer in a disability employment service left their service.
[ Return to Top Return to Section ]
F
FaCS – Department of Family and Community Services (Australian Government)
FaCSIA – Department of Families, Community Services and Indigenous Affairs (Australian Government)
FaHCSIA – Department of Families, Housing, Community Services and Indigenous Affairs (Australian Government)
Financial year – the period between 1 July and 30 June in any given year.
Full award wage – the income set in the relevant award for a particular occupation.
Full-time employment – full-time employees work the agreed or award hours for a full-time employee in their occupation. If agreed or award hours do not apply, employees are regarded as full-time if they ordinarily work 35 hours or more per week.
Full-time equivalent (FTE) – calculated based on working as the equivalent of a full-time person – 38 hours per week.
Full-time hours – hours of employment of 35 or more hours a week.
[ Return to Top Return to Section ]
H
Hearing disability – a disability encompassing deafness, hearing impairment and hearing loss.
[ Return to Top Return to Section ]
I
Independent worker – a consumer who the supported employment service assisted to obtain employment during 2005-06, who then continues to work but received no employment assistance from the supported employment service during 2006-07.
Indigenous origin – a consumer who self-identifies, or is identified as, being of Aboriginal and/or Torres Strait Islander descent.
Indigenous status – identifies whether a consumer is of Indigenous or non-Indigenous descent.
Indirect support staff – staff who have no, or only minimal, direct contact with consumers e.g. management staff, administrative staff, training personnel, etc.
Information services – services which facilitate access to information by people with disability, their families, carers and professionals, and include services to provide the information necessary to enable people with disability to live full lives in their communities. This includes captioning of all the elements of media entertainment (e.g. television programs, DVDs, cinema) for people who are deaf or hearing impaired.
Intellectual disability – applies to medical conditions appearing in the developmental period (age 0-18) associated with impairment of mental functions, difficulties in learning and performing certain daily life skills and limitation of adaptive skills in the context of community environments compared to others of the same age. Intellectual disability may be associated with Down Syndrome, autism, etc.
Interpersonal interactions and relationships – forming and maintaining friendships, coping with feelings and behaving within socially accepted boundaries.
Interpreter service – a service that interprets the communication between a consumer and an employment service. Spoken languages other than English and non-spoken communication (e.g. Auslan sign language) are interpreted via these services.
[ Return to Top Return to Section ]
J
Job seeker – a consumer who receives support from a disability employment service to prepare them for employment and/or to help place them in employment. It may include skills assessment, pre-employment training, job search, etc.
[ Return to Top Return to Section ]
L
Language spoken at home – the language spoken by a consumer in their home.
Lives alone – consumer lives in a household alone.
Lives with family – consumer lives in a household with a partner or other family members.
Lives with others – consumer lives in a household with friends or a carer who is not a family member.
Living arrangements – whether the consumer lives alone or with other related or unrelated persons.
[ Return to Top Return to Section ]
M
MoG changes – Machinery of Government changes
Main language spoken at home – the language most often used by the consumer to communicate with other people in the home environment.
Main source of income – consumer’s own main source of income, not that of a partner or of other household members. It refers to the source by which a consumer derives most (equal to or greater than 50%) of their income throughout the financial year. Where a consumer has multiple sources of income and none are equal to or greater than 50%, the source which contributes the largest percentage is counted.
Mean (average) hours worked per week – the number obtained by dividing the total hours worked per week by the number of consumers in that group.
Median gross weekly wage – The number of hours worked per week which divides consumers into two groups containing equal numbers of consumers, one half with hours worked per week below the median and the other half with earnings above the median.
Mean (average) gross weekly wage – the amount obtained by dividing the total gross weekly earnings of consumers by the number of consumers in that group.
Median gross weekly wage – The amount of gross weekly earnings which divides consumers into two groups containing equal numbers of consumers, one half with gross weekly earnings below the median and the other half with gross weekly earnings above the median.
Mean (average) gross hourly wage rate – the amount obtained by dividing the total gross hourly earnings of consumers by the number of consumers in that group.
Median gross hourly wage rate– The amount of gross hourly earnings which divides consumers into two groups containing equal numbers of consumers, one half with gross hourly earnings below the median and the other half with gross hourly earnings above the median.
Method of communication – the common way by which the consumer communicates.
Mobility – ability to move around the home or other environments such as the workplace.
Moderate to no core activity limitation – refers to a person who needs no help but has difficulty with a core activity or needs no help but uses aids and equipment.
[ Return to Top Return to Section ]
N
Neurological disability – a disability used to define persons with impairment of the nervous system occurring after birth. Examples include epilepsy, multiple sclerosis, and Parkinson’s Disease.
Newstart Allowance – an income support payment for people who are studying, undertaking training, looking for work or temporarily incapacitated.
NESB – Non-English speaking background.
Non-spoken communication – effective ways of communication other than verbal communication. Examples include the use of sign language, Canon Communicator, and Compic.
Non–vocational activities – non-standard employment e.g. independent living/life skills training, recreational activities, community participation, etc
Not stated – the consumers’ situation in respect to a particular question was not provided by the service outlet.
No wage – the consumer did not receive a wage/earnings for the work undertaken.
[ Return to Top Return to Section ]
O
Open employment services – services providing employment assistance to people with a disability in obtaining and/or retaining paid employment in the open labour market.
Other significant disability – the presence of a disability, other than that indicated as being the primary disability, that can also cause difficulty for the consumer in daily life.
[ Return to Top Return to Section ]
P
Paid employment – employment for which a consumer receives a wage/earnings.
Paid staff – staff employed by a disability service outlet.
Part-time employment – part-time employees work fewer hours than full-time employees, and are employed on a permanent or continuing basis. They accrue paid holidays, sick leave and long service leave entitlements on a pro rata basis. Employment of less than 35 hours per week is considered to be part-time.
Part-time hours – hours of employment less than 35 hours a week.
Permanent employment – permanent employees are employed on a continuing basis, and are entitled to paid holiday leave, sick leave and long service leave. There is a qualifying period.
Phase – the employment status of a consumer on 30 June 2008. Examples include worker, job seeker, work experience and non-standard employment (i.e. non-vocational activities).
Physical disability – a disability that involves conditions attributable to a physical cause that impact on one’s ability to perform physical activities. Examples include paraplegia, quadraplegia, cerebral palsy, spina bifida, arthritis, etc.
Potential population – the potential population is an estimate of the number of people who may at some time require access to specialist disability services. It is not the same as the population needing services but is intended to broadly indicate the number of people with the potential to require specialist disability services at some time. It is calculated by the AIHW using data from the ABS 2003 Survey of Disability, Ageing and Carers.
Primary disability – the disability that most clearly expresses the experience of disability by a person. It can also be considered as the disability causing the most difficulty to the person in daily life, compared with any other disability they may also have.
Print disability services – services producing alternative formats of communication for people who, by reason of their disability, are unable to read, hold or manipulate printed material. These alternative formats include Braille, large print, audio recordings, computer discs and electronic text. The provision of printed materials in alternative formats enables people with print disability to access information relevant to their educational and vocational needs, everyday living and leisure. These materials are delivered mainly through the Postal Concessions for the Blind program, a program funded outside the CSTDA.
Private residence – a home the consumer lives in. It may be a house, flat, unit, caravan, or mobile home.
Profound core activity limitation – refers to a person who is unable to do, or always needs help with, a core activity.
Pro rata - a wage based on the proportion of hours worked out of an equivalent full-time working week.
Productivity based wage – a wage based on a person’s productive capacity, and paid under a legal industrial agreement.
Psychiatric disability – is associated with clinically recognisable symptoms and behaviour patterns frequently associated with distress that may impair personal functioning in normal social activity. Impairments of global or specific mental functions may be experienced, with associated activity limitations and participation restrictions in a range of areas. Psychiatric disability may be associated with schizophrenia, affective disorders, anxiety disorders, addictive behaviours, personality disorders, stress, psychosis, depression and adjustment disorders.
[ Return to Top Return to Section ]
R
Reason for leaving – the main reason a consumer left their disability employment service outlet.
Respite services – services that provide short-term and time-limited break for families and other voluntary caregivers of people with disability, to assist in supporting and maintaining the primary care giving relationship, while providing a positive experience for the person with a disability.
[ Return to Top Return to Section ]
S
SARs – Special administrative regions (Hong Kong and Macau).
Seasonal employment – work in a position or industry that experiences a dramatic employment increase or build up for a defined period of time each year, after which the employment ceases or is greatly reduced until the following season (e.g. fruit picking).
Self-care – undertaking tasks involved in looking after one’s self (e.g. eating, bathing, dressing, and going to the toilet).
Sensory disability – a disability related to one of the senses (e.g., hearing, sight, and speech).
Severe core activity limitation – refers to a person who sometimes needs help with a core activity.
Sign language – a form of non-spoken communication. It incorporates signs, body movements, facial expressions, mime and gesture. Examples include Auslan (Australian Sign Language) and Makaton.
Specific learning disability/Attention Deficit Disorder – Is a general term referring to a group of disorders, presumed due to central nervous system dysfunction rather than an intellectual disability, covering significant difficulties in the acquisition and use of listening, speaking, reading, writing, reasoning or mathematical skills. Specific learning may be associated with Attention Deficit Disorder. Intellectual disabilities are excluded from this group.
Speech disability – a disability encompassing loss of speech, impairment and/or difficulty in being understood.
Staff hours – hours worked by paid staff or volunteers during the reference or a typical week.
Statistical linkage key – a statistical tool that enables consumer data to be counted and confidentialised. It comprises the 2nd, 3rd and 5th letters of the consumer’s surname, 2nd and 3rd letters of the consumer’s first name, their date of birth (DDMMYYYY) and sex (1 for male, 2 for female).
Supported accommodation facility – accommodation which provides board or lodging for a number of people with disability and which has support services provided by rostered care workers, usually on a 24 hour basis.
Supported employment services – services providing ongoing on-the-job employment support within a commercial enterprise.
Support needs – the consumer’s need for assistance in the nine main life areas.
Supported Wage System (SWS) – a productivity based wage determined in accordance with the Supported Wage System.
[ Return to Top Return to Section ]
T
Temporary employment – temporary employees are employed for a short or fixed term and are entitled to paid holiday and sick leave. There is usually a qualifying period.
Torres Strait Islander Origin – a person who self-identifies, or is identified, as being of Torres Strait Islander descent.
[ Return to Top Return to Section ]
U
Unpaid staff – unpaid hours worked by volunteers.
[ Return to Top Return to Section ]
V
Vision disability – a disability encompassing blindness and vision impairment which is not corrected by prescription glasses or contact lenses.
Volunteer work – employment that is unpaid.
[ Return to Top Return to Section ]
W
Wage assessment tool – a wage-setting mechanism which provides a method to determine pro rata minimum wages. Wage assessment tools measure the productive capacity of each individual supported employment service consumer in employment and determine a corresponding pro rata wage for each individual
Wage level and conditions – the current relationship of the consumer’s wage and conditions to an award/ agreement wage.
Weeks of operation – the number of weeks during the financial year the service outlet operated.
Work experience – a consumer who is undertaking paid or unpaid work experience or work trial in a supported employment service.
Worker – a consumer who has been offered a contract of employment and has accepted that contract with a supported employment service. See also independent worker.
Working life area (support needs indicator) – undertaking actions, behaviours and tasks needed to obtain and retain paid employment.
Workplace agreement – a written agreement between an employer and employee about the employee’s terms and conditions of employment. More commonly referred to as an Australian Workplace Agreement.
[ Return to Top Return to Section ]
Y
Youth Allowance – a means-tested income support payment for young people who are studying, undertaking training or an Australian Apprenticeship, looking for work, or sick.
References
ABS 2007a, 2006 Census Tables, Cat. no. 8153.0, ABS, Canberra, viewed 28 February 2008, <http://www.abs.gov.au>.
ABS 2008, Labour Force, Australia, Cat. no. 6102.0, ABS, Canberra, viewed 30 March 2010, <http://www.abs.gov.au>.
ABS 2005, ‘Paid work: Labour force characteristics of people with a disability’ in ABS, Australian Social Trends, 2005, Cat. no. 4102.0, ABS, Canberra, viewed 28 February 2008, <http://www.ausstats.abs.gov.au>.
ABS 2007b, Labour Statistics: Concepts, Sources and Methods, Cat. no. 6102.0, ABS, Canberra, viewed 28 February 2008, <http://www.ausstats.abs.gov.au>.
ABS 2004, Disability, Ageing and Carers: Summary of Findings, Cat. no. 4430.0, ABS, Canberra, viewed 28 February 2008, <http://www.ausstats.abs.gov.au>.
Australian Fair Pay Commission., Fact Sheet: Employees with a Disability – Process for approving new wage assessment tools for use in the business services sector, viewed 19 March 2008, .
Australian Institute of Health and Welfare 2007, Disability support services 2005-06: national data on services provided under the Commonwealth State/Territory Disability Agreement, Cat. no. DIS 51, Disability Series, AIHW, Canberra.
AIHW 2004, Rural, regional and remote health: a guide to remoteness classifications, AIHW cat. no. PHE 53, Rural Health Series, AIHW, Canberra.
AIHW 2003, Australia’s national disability services data collection: redeveloping the Commonwealth-State/Territory Disability Agreement National Minimum Data Set (CSTDA NMDS), Cat. no. DIS 30, Disability Series, AIHW, Canberra.
Bureau of Infrastructure, Transport and Regional Economics 2007, About Australia’s Regions 2007, BTRE, Canberra, viewed 19 March 2008, <http://www.bitre.gov.au/>.
Department of Community Services and Health 1988, Census of Disability Services, DCSH, Canberra.
Department of Human Services and Health 1994, Service Consumer Profile Report 1993, DHSH, Canberra.
Department of Families, Community Services and Indigenous Affairs 2007, Australian Government Disability Services Census 2006, FaCSIA, Canberra, viewed 19 March 2008, <http://www.facs.gov.au>.
FaCSIA 2006, Australian Government Disability Services Census 2005, FaCSIA, Canberra, viewed 19 March 2008, <http://www.facs.gov.au>.
Department of Family and Community Services 2005, 2005 Australian Government Disability Services Census Data Guide: Data Items and Definitions, FaCS, Canberra, viewed 19 March 2008, <http://www.facs.gov.au>.
FaCS 2004, Continuous Improvement Handbook version 2, FaCS, Canberra, viewed 19 March 2008, <http://www.facs.gov.au>.
FaCS 2002, Commonwealth Disability Services Census 2000, FaCS, Canberra, viewed 19 March 2008, <http://www.facs.gov.au>.
FaCS 1999, Commonwealth Disability Services Census 1998, FaCS, Canberra, viewed 19 March 2008, <http://www.facs.gov.au>.
FaCS 1998, Commonwealth Disability Services Census 1997, FaCS, Canberra, viewed 19 March 2008, <http://www.facs.gov.au>.
Department of Health, Housing and Community Services 1991, 1991 Census of Disability Services, North Sydney, AGB Research Australia.
Department of Immigration and Citizenship 2007, Fact Sheet 22 – The Health Requirement, DIAC, Canberra, viewed 28 February 2008, <http://www.immigration.gov.au>.
Mental Health Council of Australia 2007, Let’s get to work – A National Mental Health Employment Strategy for Australia, Mental Health Council of Australia, ACT, viewed 1 May 2008, <http://www.mhca.org.au>.
Migration Regulations 1994 (Cth).
Last updated: